INTRODUCTION
Childhood obesity and overweight represent a major world health problem which is considered as a global epidemic. In Mexico, the prevalence of obesity among children from five to eleven years old is 35.6 % and 38.4 % in adolescents in 2018 (1). Children with obesity are at high risk to present impaired glucose tolerance, insulin resistance, and metabolic syndrome (2). The appearance of these obesity-related complications translates into the increased prevalence of cardiometabolic risk factors in adulthood (3). Therefore, it requires immediate action to prevent its deleterious effects into adulthood. Body mass index (BMI) constitutes the most common obesity diagnostic tool in clinical practice and higher values of BMI have shown a progressive increase in cardiovascular risk (4). However, the use of BMI as an indicator of metabolic health has been debated, given that the concept “metabolically healthy obesity” raises further concerns regarding that could represent a transient state (5). Therefore, the identification of specific molecular biomarkers conferring more accurate assessment of childhood obesity and related metabolic alterations is required.
Erusalimsky et al. discussed the functions of soluble receptor for glycation end-products (sRAGE) and the evidence supporting their use as a promising biomarker of disease risk (6). The cell surface transmembrane multiligand receptor for advanced glycation end-products (RAGE) encoded by the AGER gene is expressed predominantly in the lung, spleen and immune cells, playing an important role in the responses to cell injury stimuli derived from oxidative stress (7). RAGE can interact with diverse ligands such as danger signaling molecules (DAMPs), pathogen-associated molecular pattern molecules (PAMPs) and advanced glycation end-products (AGEs). AGEs are a group of harmful molecules formed by non-enzymatic glycation of biomolecules (mainly protein) with reducing sugars, and their production increases under the conditions of long-term hyperglycemia and pro-inflammatory/pro-oxidative state. AGEs-RAGE interaction leads in NF-κB and nicotinamide adenine dinucleotide phosphate (NADPH) activation, pathways involved in the generation of inflammatory responses such as cytokine release, oxidative stress and apoptosis, which overall contribute to the progression of adiposity-related cardiometabolic diseases (8,9). The soluble isoform sRAGE counteracts AGE-RAGE interaction. sRAGE arises from the cleavage of the extracellular region of the membrane-associated receptor, acting as a competitive inhibitor and thereby protecting against tissue injury and inflammation (10).
sRAGE levels have been measured in childhood in search for associations with disease states (11-16). Several studies reported lower levels of sRAGE in end-stage of renal disease, cardiovascular complications, diabetes and obesity than in healthy subjects (17-21), providing further support to the protective role of sRAGE. In adolescents with obesity, its role as a biomarker of endothelial dysfunction has been suggested, given this association with flow-mediated vasodilation (FMD) (22). It has been reported that obese children and adolescents showed diminished amount of plasma sRAGE compared with normoweight counterparts and negatively correlated with cardio metabolic risks factors (23).
Disease states exhibit lower amount of sRAGE, and this could be partially explained because certain pathological conditions are accompanied by an elevation of AGEs that could be related to an increase of RAGE expression (24). However, RAGE transcript levels related to childhood obesity have not been explored. In this cross-sectional study, the total circulating sRAGE was determined using enzyme-linked immunosorbent assay (ELISA) and AGER expression levels related to full length isoform of RAGE, to explore the relationships with cardiometabolic risk factors in childhood obesity.
MATERIALS AND METHODS
STUDY POPULATION
In this cross-sectional study, anthropometric measurements including height and weight were taken in a total of 260 children between the ages of 6-11 years old who attend at the three full-time school programs located in Escalerillas, San Luis Potosí, México. The above assessment shows that 15.7 % of the children had overweight and 11.1 % had obesity according to Z scores of BMI for age (BMI/A) and taking into consideration the date of birth and gender. BMI/A was classified according to the World Health Organization (WHO) criteria (25). We invited overweight or obese children both male and female by convenience sampling to participate in this study and 40 children were recruited. All the participants were informed of the objective and activities of the study. Both parents and students read the informed consent and assent, respectively, and indicated their agreement to participate in the study. This study was conducted following the guidelines of the Committee of Health Education and Research of the Health Secretary of San Luis Potosi, in San Luis Potosi, Mexico (register number SLP/012-2017) and was approved by the local University Ethics Committee (CONBIOETICA-24CEI-003-20190726).
ANTHROPOMETRIC AND BIOCHEMICAL MEASUREMENTS
All participants underwent physical examination and anthropometric assessment included height (cm), weight (kg), BMI (kg/m2), waist circumference (WC) (cm), neck circumference (NC) (cm), fat mass (FM) (%), free fat mas (FMM) (kg) and central fat mass (CFM) (kg). A bioelectrical impedance analyzer (Tanita BC-418) (Tanita Corp., Tokyo, Japan) and stadiometer (Seca 213) were placed on a flat surface. A standardized nutritionist took these measurements. BMI was calculated using Quetelet formula (kg/m2) and interpreted as Z scores based on age and gender. The classification used was proposed by the WHO; categories were obesity (> 2 Z score) and overweight (> 1 Z score). Furthermore, WC and NC were measured using a Lufkin Executive® Thinline 2 m, W606PM metal tape (Lufkin W606PM, Sparks, MD, USA) to the nearest 0.1 cm with the children standing upright. WC measurement was taken at the midpoint between the iliac crest and the last rib, taken in the narrowest part of the abdomen and at the end of normal expiration. WC risk level for cardiometabolic risk was determined as those above the > 90th percentile, according to percentiles in Mexican-American children (26).
Finally, NC was measured at the level of the thyroid cartilage aligned horizontally, head held erect, and eyes facing forward, as it has been previously described (27).
Blood samples (6 ml) were collected with a BD Vacutainer® system, with a previous 12-hour fasting. The serum was separated to determine fasting plasma glucose, total cholesterol (TC), high-density lipoproteins (HDL-C), low-density lipoproteins (LDL-C), and triglycerides (TG). Samples were processed in a BS 300 Mindray Autoanalyzer, and the fasting plasma glucose was determined by the glucose peroxidase method. The findings were done in a certified clinical analysis laboratory.
SERUM ANALYSIS
The serum levels of total sRAGE were determined using a specific sandwich ELISA kit (Quantikine, R&D Systems, Minneapolis, MN, USA). This ELISA is designed to measure human RAGE (extracellular domain) in cell culture supernatants, serum, and plasma. Measurements were performed in duplicates and the results were averaged. The minimum detectable dose of human RAGE was determined to be 3 pg/ml. The detection limit of the assay was 10 pg/ml. The intra or the inter-assay CV were < 5 and < 10 %, respectively.
GENE EXPRESSION
Total RNA was extracted from peripheral blood mononuclear cells (PBMC) using TRIzol™ reagent (Invitrogen™) according to the manufacturer's instructions. RNA concentration and purity were determined with a spectrophotometer (Synergy™ HT, BioTek). A total amount of 100 ng of RNA was used to synthesize cDNA with a High-Capacity cDNA Reverse Transcription Kit (Applied Biosystems™). A total of 250 ng of cDNA were used as a template to perform qPCR using TaqMan® Universal Master Mix (Applied Biosystems™). To evaluate the mRNA expression of RAGE, iTaq™ Universal SYBR Green Supermix and specific primers for AGER (sense: 5'-gcatcagcatcatcgaacca-3', antisense: 5'-tgcacgctcctcctctt-3') were used. The analysis was performed on the CFX96 Touch™ Real-Time System (BioRad). The data were analyzed with the 2-ΔCq method against the level of the transcripts ACTIN for mRNAs.
STATISTICAL ANALYSIS
Data are shown as the mean ± standard deviation (SD) or the mean ± SD. The distribution of each one of the variables was assessed by the Shapiro-Wilk test. The assessment of differences in the levels of sRAGE between children with overweight or obesity was determined using both parametric t test. The statistical analysis was performed using InStat GraphPad software (InStat GraphPad Inc., San Diego, CA, USA), version 7.0. Spearman's correlation coefficient was evaluated for correlation analysis. Univariate and multivariate linear regression models were estimated to assess the possible dependence of sRAGE on some explicative variables. Multivariate model (by stepwise procedure) was estimated considering the following independent variables: WC, glucose triglycerides (TG), and HDL-C. Statistical analyses were performed using SPSS 20.0 for Window package. A p-value lower than 0.05 was considered as statistically significant.
RESULTS
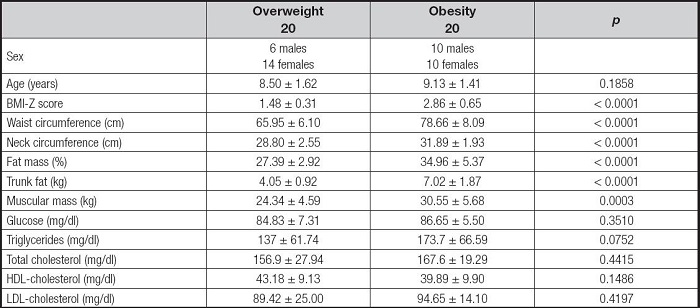
A total of 40 children of both genders were evaluated with a mean (IR) age of 8.6 (6.3-11.1), 40 % were boys (n = 16) and 60 % were girls (n = 24). Anthropometric characteristics, glucose, and lipid profile of the individuals are summarized in table I. The two groups were comparable for age and sex and no significant age differences were detected. In the obesity group, the mean (SD) BMI Z-score was 2.86, 60 % of the children in this group presented abdominal obesity (WC > 90 percentile), and mean WC was 78.66 ± 8.09.
Table I. Comparison analysis of cardio-metabolic risk factors between groups.

Mean and standard deviation are shown. BMI: body mass index; HDL: high density lipoprotein; LDL: low density lipoprotein. According to the Bonferroni test, p value between overweight and obesity groups is p < 0.0001.
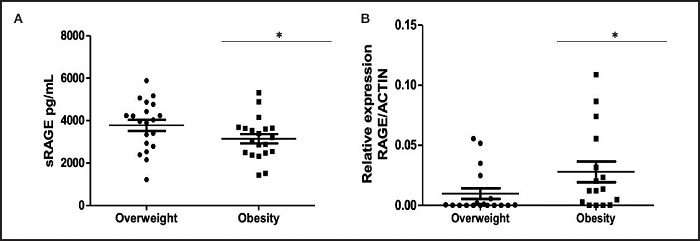
Figure 1 shows the distribution of circulating sRAGE levels between overweight and obesity children. Moreover, sRAGE serum levels were higher in the overweight group compared to the obesity group (p = 0.0366) (Fig. 1A) and RAGE expression levels were higher in the obesity group (p = 0.0315) (Fig. 1B). Serum sRAGE was noted to have a significant inverse correlation with RAGE expression levels (r -0.3528, p 0.0407) (Fig. 2).

Figure 1. Distribution of sRAGE and RAGE levels between tested groups. A. Serum sRAGE concentrations were measured by multiplex immunoassay and analyzed by t-test. B. Relative expression of RAGE was measured by RT-qPCR from peripheral blood mononuclear cells (PBMC) in individuals within the two groups and analyzed by t-test. Graphs show medians with a range. Statistical significance is shown as *p < 0.05. Circles indicate the overweight group and squares indicate the obesity group.

Figure 2. Correlation observed between sRAGE and RAGE levels. Correlation between relative expression of RAGE in peripheral blood mononuclear cells (PBMC) and serum levels of sRAGE were analyzed using Pearson's (r) correlation. Graphs show means ± SEMs. Statistical significance is shown as *p < 0.05.
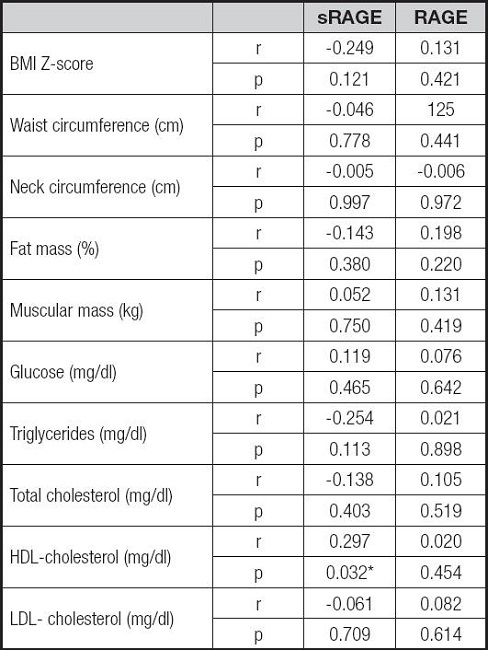
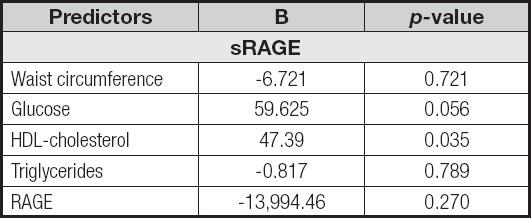
Correlation analysis between cardiometabolic markers, RAGE and sRAGE levels are reported in table II. Only serum sRAGE levels were significantly correlated with the cardiometabolic risk factor HDL-cholesterol (r .297, p = 0.032). The associations among sRAGE and the main cardiometabolic risk factors and RAGE expression levels were analyzed by univariate linear regression analysis (Table III). To investigate the independent effect of cardiometabolic risk factors on sRAGE levels, a multivariate stepwise regression analysis was performed (Table IV). The above suggests that HDL-C and RAGE levels represents predictors of sRAGE.
Table II. Correlation analysis among sRAGE, RAGE and cardiometabolic risk factors.

BMI: body mass index; HDL: high density lipoprotein; LDL: low density lipoprotein; sRAGE: soluble receptor for advanced glycation end-products; RAGE: receptor for advanced glycation end-products. Pearson's correlation test has been made.
*Correlation is significant, p < 0.05.
Table III. Statistically significant associations at univariate linear regression analysis.

sRAGE: soluble receptor for advanced glycation end-products; RAGE: receptor for advanced glycation end-products; HDL: high density lipoprotein.
DISCUSSION
This study suggests that obesity children display significantly lower sRAGE serum levels than overweight children, and shows the relationships between anthropometric, biochemical and adiposity parameters of cardio-metabolic risk in prepubertal children. The results support the observation that in overweight/obesity lower levels of the soluble receptor are found compared to lean controls in study population that included children and adolescents (22,23). However, the distinction between both levels of adiposity had not been evaluated. Moreover, in our study a significant association between HDL and sRAGE serum levels was documented. At regression analysis HDL was an independent predictor of sRAGE serum levels, therefore childhood obesity seems to play a regulating role on the metabolic homeostasis.
sRAGE is implicated in the pathogenesis of several adiposity-related disorders, showing a lower serum level of the receptor compared to normal weight controls. However, research involving adolescents are contradictory (28). Oxidative stress markers have been proved to be involved in the progression of the most relevant liver disease present in childhood and adolescence obesity, nonalcoholic fatty liver disease (NAFLD), showing a significantly lower amount of sRAGE in obese prepubertal children with liver steatosis (29). However, the key role of sRAGE in obesity, especially in a pre-pubertal population without a chronic disease, has been poorly explored.
Childhood overweight and obesity (especially in prepubertal age), the relationships between oxidative stress, stressors and antistressors, biochemical features and anthropometric variables, considered as markers of cardiometabolic risk, have not been widely investigated. There is a need to identify individuals at the highest risk that could later lead to vascular complications and diabetes and to an adverse cardiovascular health (30). The above shows the importance of assessing an oxidative profile including more than one member of the RAGE axis and exploring the association with cardiometabolic risk factors. To address this issue, we have shown for the first time the AGER, the gene encoding RAGE expression levels analysis related to childhood obesity. Given that RAGE can release from a diverse number of splice variants, where the full-length RAGE variant has been fully characterized, the altered variants of RAGE incapable of transducing signals were excluded from the primers design (31,32). We found that individuals with obesity exhibit higher AGER transcripts levels compared with the overweight group. However, RAGE expression shows no association with cardiometabolic risk factors in the study groups. At regression analysis, RAGE was an independent predictor of sRAGE serum levels, which is in accordance with a recent study reporting that basal levels of sRAGE are significantly negatively correlated with RAGE cell surface expression in healthy children (33).
The main limitation of this study is related to its sample size. However, our research group has achieved positive results for the analysis of gene expression in small numbers of patients (34,35). It might be argued that another limitation of the present study is the lack of normal-weight control group. Previous studies include individuals with overweight or obesity in the same group for later comparison with normal weight controls. Nevertheless, the main strength of the current study is the fact that it shows that receptors for advanced glycation end-products are differentially expressed among overweight and obesity status.
Cardiometabolic risk factors are altered in childhood overweight and obesity. Moreover, in our study, at regression analysis only HDL-C levels were an independent predictor of sRAGE serum levels, suggesting that the HDL and sRAGE molecules play a fundamental role in reducing the cardiometabolic risk and provide relevant information that supports the hypothesis of the differences between overweight and obesity, favoring the use of specific biomarkers.
For the first time, a comparative analysis of the sRAGE and RAGE levels between overweight and obesity pre-pubertal children has been performed, showing that HDL was an independent predictor of sRAGE serum levels. However, future research is needed to fully elucidate the differences among bout adiposity degrees and test the plausibility of sRAGE and RAGE transcript as a novel biomarker of obesity-related cardiometabolic risk.


