INTRODUCTION
Nutritional intake and dietary patterns are potential determinants of health outcomes in hemodialysis (HD) patients. Patients on maintenance HD require intensive nutritional education, good instruction, as well as repeated reinforcement to cope with the complex renal diet due to dietary and fluid restrictions and control of electrolytes that can limit food choices and make meals unappetizing, leading to reduced food intake and poor nutritional adherence (1).
Moreover, uremic metabolites, metabolic acidosis, inflammation and the presence of other comorbidities can also worsen appetite, decreasing protein and energy intake and increasing catabolic processes in this population (2).
All of the causes mentioned above could give rise to diet, fluid and electrolyte imbalances that can lead to malnutrition in maintenance HD patients. Malnutrition is mild to moderate in approximately 33 % of these patients and severe in approximately 6 % to 8 % (3), and its presence causes increased morbidity, decreased functional capacity and increased number and duration of hospital admissions, leading to a low quality of life (QoL), being a major risk factor for mortality (3,4).
Dietary advice in HD patients is recommended by the Kidney Disease Outcomes Quality Initiative (KDOQI), through a nutritional care plan and individualized dietary counseling emphasizing the work of the dietitian nutritionist to prevent or treat potential or ongoing nutritional deficiencies and alterations as an essential task for optimal care of the patients with chronic kidney disease (CKD) (5).
An early nutritional intervention program (NIP) during regular follow up has been shown to prevent nutritional insufficiencies, avoid malnutrition and improve the QoL of HD patients (6-9), can have a positive impact on their survival (3,10). Therefore, the objective of this study was to evaluate the effect of an NIP after one year of follow-up on the nutritional status of HD patients and its impact on QoL and mortality.
MATERIALS AND METHODS
STUDY POPULATION
This was a longitudinal intervention study of a cohort of maintenance HD patients with 12 months of follow-up. The nutritional care model for HD patients was set in accordance with the clinical guidelines of the National Kidney Foundation's Kidney Disease Outcomes Quality Initiative on nutritional support for HD patients (5).
As per hospital protocol, the malnutrition-inflammation score (MIS) questionnaire is administered every 3 months and the KDQOL-SF is administered twice a year. Both are performed at the beginning of HD sessions by a nutritionist and trained nursing assistants who work in the Nephrology Unit.
Ethical approval was granted by the Costa del Sol Research Ethics Committee on May 30, 2019 with approval number 85-05-2019. This study was conducted in accordance with the ethical principles set forth in the most recent version of the Declaration of Helsinki and the standards of good clinical practice. All participants signed an informed consent form prior to their inclusion in the study.
STUDY DESIGN
One hundred and twenty patients underwent an initial assessment. Twenty-seven patients dropped out of the study due to death (n = 16) or change of dialysis center (n = 11); and 18 patients were excluded due to an invalid QoL questionnaire. Finally, 75 patients had a valid MIS and QoL questionnaire, which was the sample used for this study. Data for these patients were collected by non-purposive sampling, from January 2017 to December 2019, and were retrospectively analyzed. Participants met the following inclusion criteria: adults (18 years or older) who had not previously consulted with a dietician and who had been in the HD program for at least 3 months. HD sessions were held three times per week for 4 hours.
Nutritional assessment and kidney disease quality of life
The assessment and the tools used to determine nutritional status and QoL are described in the methodology of the scientific article of the previous descriptive study (11). The MIS score was used to determine nutritional risk (12), and QOL was measured using the validated Spanish version of the KDQOL-SF version 1.2 (13).
Nutritional Education Program
All dialyzed patients received individualized consultations with a trained dietitian over the study period. Each consultation lasted for about 35 to 40 minutes and focused on adequate food intake for each patient's energy and protein needs. All patients were comprehensively assessed every 3 months, or on a more frequent basis in the case of malnourished patients and those at nutritional risk, to check adherence to the prescribed nutritional treatment and prevent further deterioration of nutritional status.
According to the KDOQI clinical practice guidelines (5), protein intake for each patient was calculated as 1.0-1.2 g/kg of real, ideal or adjusted body weight. We also calculated the energy intake for each patient as 25-35 kcal/kg of real, ideal or adjusted dry weight. Moreover, we suggested a daily recommended sodium intake below 2300 mg, a potassium intake of 1500- 2000 mg/day and a phosphate intake of 800-1000 mg/day. In addition, we calculated levels of serum calcidiol to correct vitamin D deficiency or insufficiency using the same treatment strategies accepted for the general population. The daily recommended vitamin D intake was 800-1000 IU/day.
The content of the nutritional education program included a focus on individual energy and protein needs, tips to restrict the intake of potassium, phosphorus, sodium and fluid and advice on how to prevent hypovitaminosis D. Three types of educational materials in the form of pamphlets were created and given to patients: 1) an individual meal plan; 2) a list of “cautionary” foods and cooking tips for low sodium, potassium and phosphorus intake; and 3) a list of foods rich in vitamin D with general recommendations. These recommendations were developed by nutritionists from the Pharmacy and Nutrition Department of Hospital Universitario Costa del Sol.
In the first session, general information on nutrition therapy and a recommended meal plan were given to the patients. Food exchange lists for preparing diets and planning individualized menus were used (14) based on the food composition table adapted to the Spanish population (15).
Later, the patients were instructed on how to control or prevent the development of hyperpotassemia, hypernatremia or hyperphosphatemia according to each patient's serum concentration of these electrolytes. In the educational materials, foods were classified graphically according to low, medium or high content. Cooking techniques and food processing methods that help reduce their concentration were also included. Lastly, a list of foods classified according to their vitamin D content was given, promoting greater consumption of these foods in patients with hypovitaminosis D and in patients in whom low intake of vitamin D-rich foods was observed in the food diary. In addition, all patients were informed of the importance of consuming vitamin D and its repercussions on their health.
In successive consultations, changes in the patients' diets were assessed and tailored solutions were suggested to achieve adequate intake. Knowledge was consolidated and education on nutritional therapy was reinforced if needed.
Laboratory evaluations
Blood measurements were taken in the morning after an 8-hour overnight fast every 3 months. Blood samples consisted of electrolyte assay (phosphorus, potassium, sodium) and biochemical parameters (hemoglobin, cholesterol, total proteins, albumin, transferrin, prealbumin, C-reactive protein and 25-hydroxyvitamin D [25(OH)D]) assessed by standard laboratory methods.
Statistical methods
Data are presented as means ± standard deviation. Categorical variables are shown as percentages. The Pearson correlation coefficient was used for independent quantitative variables, the Mann-Whitney U test for dichotomous qualitative variables and the ANOVA test for qualitative variables with three or more categories.
Descriptive analysis was performed using measures of central tendency, dispersion and position for quantitative variables, and frequency distribution for qualitative variables. To evaluate pre-post change, the McNemar test was used for categorical variables, and Student's t-test (or Wilcoxon singed-rank test) for quantitative paired samples. To evaluate changes in the three assessments in the quantitative variables, the generalized linear model for repeated measures was used. Finally, survival was evaluated by means of survival curves using the Kaplan-Meier method, comparing categories using the log-rank test. The level of statistical significance was set at p < 0.05. SPSS v28 statistical software was used.
RESULTS
Among the 75 HD patients, 66 % were men, and 47 % had diabetes mellitus. The Charlson comorbidity index predicted a 10-year mortality of 14 % for the participants of the study. The mean age of the patients was 71 ± 13 years, and their mean dialysis duration was 3 ± 3 years.
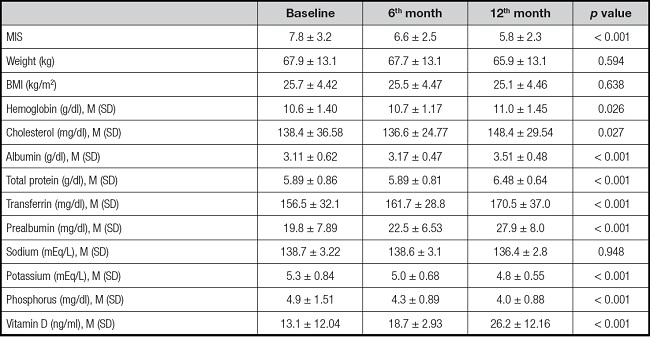
To examine the changes in clinical outcome with continuous nutritional counseling over time, baseline nutritional parameters were compared with the measurements at 6 and 12 months of follow-up (Table I).
Table I. Changes in nutritional parameters through personalized nutritional counseling over time.

Data are expressed as mean ± standard deviation for normal data.
MIS: malnutrition-inflammation score; BMI: body mass index.
p value is representative over time.
The MIS scale score was two points lower at the end of the study (p < 0.001), indicating a relatively less serious risk of developing malnutrition. In this regard, the presence of nutritional risk had a reduction rate of 12.5 % at the end of the study.
There were no significant changes in body composition (weight or BMI), with 45 % of the patients having a BMI in the normal weight range at the end of follow-up. During the NIP, 23 % of the patients experienced weight loss, 52 % of whom lost weight in a balanced and healthy way following the nutritionist's recommendations.
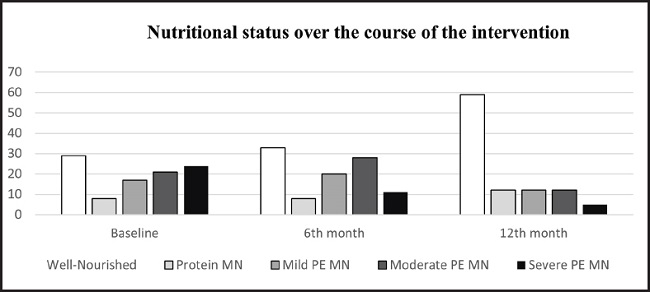
Regarding the nutritional diagnosis, figure 1 shows the percentage change in the nutritional status of the patients at baseline, 6 months and 12 months. The number of patients with severe protein-calorie malnutrition decreased by 19 %, while the percentage of patients diagnosed as well-nourished increased by 30 % (p < 0.001), with well-nourished patients representing 59 % of the total study population.

Figure 1. Nutritional status over the course of the intervention. Data are expressed as % (MN: malnutrition; PE: protein-energy).
In addition, of the 53 patients who had some degree of malnutrition at the start of the study and who were likely to improve after the nutritional intervention, nutritional status improved in 42 of them (p < 0.001).
Concerning nutritional management, during the NIP, 100 % of the patients received individualized nutritional recommendations and a diet based on weight-adjusted portions, as well as informative material about fluid intake, potassium, phosphorus, protein, sodium and additives management. Sixty-five percent of the patients required renal-specific oral nutritional supplements for patients in renal replacement therapy and 14 % required personalized intradialytic parenteral nutrition.
All patients responded to the KDQOL-SF version 1.2 questionnaire while being monitored by trained staff at the beginning and at the end of the study.
Nutritional status was compared to scores on the KDQOL-SF components. Well-nourished patients had better scores on the general summary areas than malnourished patients both at baseline and at the end of the study. Statistically significant differences were found in scores on the general areas of the SF-36 questionnaire in both periods (Table II).
Table II. Changes in scores on the general summary areas of the KDQOL-SF according to nutritional status by personalized nutritional counseling over time.

Data are expressed as mean ± standard deviation for normal data.
p value is representative over time.
The subareas with significantly higher scores at the end of the study in well-nourished patients on the specific part were symptoms/problems, effects of kidney disease, cognitive function, quality of social interaction, dialysis staff encouragement, and patient satisfaction with the care received; and on the generic part (SF-36) these were role-physical, pain, social function energy/fatigue and general health.
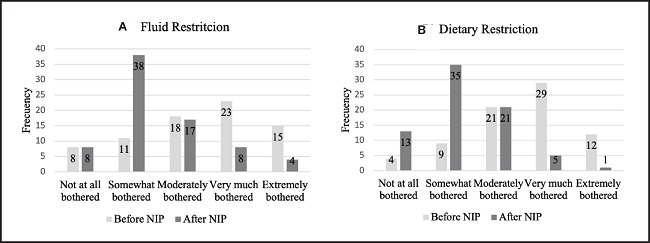
Fluid and dietary restrictions are two aspects that are bothersome in the daily life of HD patients and are addressed in the effects of kidney disease dimension. After starting the NIP, there was a 63.4 % (p < 0.001) reduction in feeling bothered by fluid restrictions and a 90.2 % (p < 0.001) reduction in feeling bothered by dietary restrictions (Fig. 2).

Figure 2. A. Fluid restriction. B. Dietary restriction of the patients over the course of the study. McNemar's statistical test was used; p < 0.001.
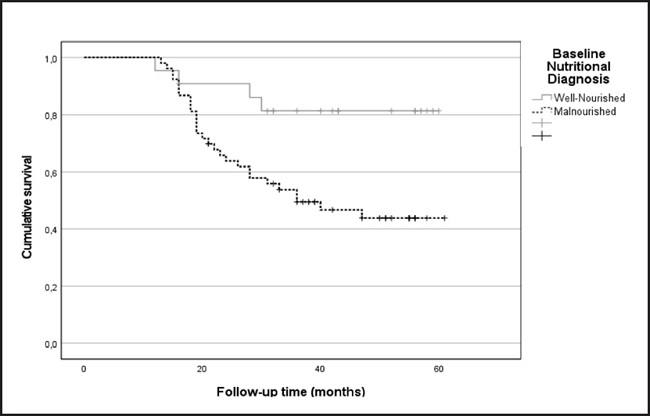
The five-year survival rate of well-nourished (52.8 ± 3.2 months) and malnourished (40.2 ± 2.7 months) patients was studied, with the survival rate being 12 months higher in the cohort of well-nourished patients (p < 0.01). Furthermore, adjusted for age, malnourished patients had a hazard ratio of death of 3.4 (95 % CI: 1.2-9.8) compared to well-nourished patients (Fig. 3).
DISCUSSION
Clinical practice guidelines in CKD recommend that patients in maintenance HD have a dietary interview and receive nutritional counseling with a renal dietitian at least every 3 months and more often in the case of malnourished patients or those at high nutritional risk (5,6). Following these recommendations, since 2017, patients in the hemodialysis unit of the Costa del Sol Hospital have benefited from the early nutritional intervention program led by dietitian nutritionists as the findings of the present study show that, in agreement with results of previous international studies (7-9,16-18), nutritional intervention improves nutritional status, QoL and increases mean survival.
A lack of dietary adherence can affect nutritional status leading to renal disease progression and readmission, as well as negatively impacting patient response to HD and deterioration of nutritional status and QoL (19). The results of this study demonstrated a statistically significant improvement in the control of fluid restriction and dietary management in hemodialysis patients through a nutritional educational program with encouragement and positive reinforcement (p < 0.001), showing less worry in their daily life, better knowledge of their diet and an improvement in their quality of life. These results are in agreement with other studies in the scientific literature (19-22).
Improved adherence to nutritional recommendations not only resulted in a 30 % (p < 0.001) improvement in the nutritional status of the well-nourished patients, but also an improvement in serum levels of visceral proteins and cholesterol at the end of the follow-up. Similar to our results, Jo et al. showed that after the sixth month of nutritional intervention, albumin and cholesterol levels improved significantly (9). Other research associates this improvement with the use of oral nutritional supplements and intradialytic parenteral nutrition (23,24). In our study, 65 % of the population required oral nutritional supplements. These may improve serum albumin levels and other nutritional parameters, which together with the support of nutritional, counseling and the intervention of dietitians, may improve clinical outcomes.
Overall, the results also showed that nutrition education significantly improved the electrolyte status of the patients. Serum potassium and phosphorus levels at 12 months were significantly reduced (p < 0.001). In the study by Garagarza et al. (8), the number of patients with hyperkalemia decreased by 16.2 % after 6 months of follow-up, and the research of Ford et al. (16) reported significantly lower levels of serum phosphorus in patients who received additional diet education specifically targeting phosphorus than in the control group.
Our study also focused on micronutrients, specifically vitamin D, since hypovitaminosis D, assessed by serum concentration of 25(OH)D, has been found to be common in HD patients (25,26). In our study, concentrations of 25(OH)D increased significantly following nutrition education (13.1 ± 12.04 vs 26.2 ± 12.16) despite falling short of the recommended optimal concentrations (5). Pilz et al. (27), suggested that for each 10 ng/ml increase in 25(OH) vitamin D levels, there is a 14 % lower relative risk of death [0.86 (95 % CI, 0.82-0.91)].
The results of this study demonstrate that the difference in mean scores on the general summary areas of the KDQOL-SF according to nutritional status before and after the intervention was higher in well-nourished patients than in malnourished patients. Since our results support the positive effects of educational intervention on patient knowledge, QOL and the different dimensions of health, it can be concluded that education as a whole and dietary educational intervention as a specific approach can facilitate improved patient health status, reduce the consequence of disease and improve QOL (general and specific areas) in HD patients, in line with the results of other scientific reports (18,28).
Malnutrition has been shown to have a negative correlation with morbidity and mortality in HD patients (10,29). Data from our study show that after one year of nutritional management, well-nourished patients had a higher 12-month survival rate than malnourished patients (p < 0.01). Our findings are consistent with those of Blumberg et al. (10), who reported that the deterioration of nutritional status during the first 3 months on dialysis significantly increases the risk of death during the first 3 years on dialysis. Data from the large Dialysis Outcomes and Practice Patterns Study cohort also considered that malnourished HD patients have an increased risk of mortality, with patients with severe malnutrition having a 33 % higher mortality risk than those who are well nourished (30). These data do not prove that poor nutritional intake or malnutrition is a cause of the high mortality in malnourished maintenance HD patients. However, the data are consistent with the thesis that malnutrition or inadequate nutrient intake does contribute to high mortality in these patients.
This study was designed as intervention research, but there was no control group of patients who did not receive nutritional counseling, which is a limitation of the study.
To conclude, our study findings suggest that the NIP during regular follow up in dialyzed patients ensures the effectiveness of nutritional training through individualized counseling and specific dietary plans and materials, improving nutritional status, QoL and increasing survival. However, to evaluate the effectiveness of an NIP more objectively, studies including a control group that does not receive nutritional counseling are needed.


