


 Servicios personalizados
 Inglés (pdf)
 Articulo en XML
 Referencias del artículo
 Enviar articulo por email
 Citado por SciELO
  Citado por Google
  Similares en
SciELO
Similares en
SciELO  Similares en Google
 Permalink
INTRODUCTION
Since the concepts of internal and external load were first introduced by Impellizzeri et al. (2004; 2005), it has been widely spread and became a common practice among sport scientists and coaches. External load is often described as the physical work performed by the athlete during training or competition and is usually seen as objective measures associated to organization, quality, and quantity of exercise (Bourdon et al., 2017; Impellizzeri, Marcora, & Coutts, 2019). On the other hand, internal load is the psychophysiological response of the individual organism to cope with the requirements elicited by a given dose, or external load (Foster, Rodriguez-Marroyo, & de Koning, 2017; Impellizzeri et al., 2019; McLaren et al., 2018). Monitoring the adaptative response in relation to the provided stimulus by the exercise is challenging for everyone involved in the training process, particularly in understanding how the individual copes with the training program or competition.
A wide range of monitoring tools are available and include physiological and mechanical measurements, each with its own limitations and strengths. Measures of ratings of perceived exertion (RPE), wellness questionnaires, psychological inventories, heart rate (HR), blood lactate or oxygen consumption are commonly used to assess internal load, while session organization (including time, frequency, activity counts and mode), power output, time-motion analysis, and global positioning system (GPS) parameters are common methods to measure external workload (Bourdon et al., 2017). Complementary to GPS, accelerometry-based workloads are used to inform about movement, through a large quantity of variables such as acceleration and deceleration, impact, steps, and change of direction, for instance. Other accelerometry-derived training loads have been created to quantify the total load subjects are exposed to and these variables are usually obtained from the acceleration in the vertical, horizontal and medio-lateral planes recorded by the accelerometers, measured in arbitrary units (a.u.) (Gomez-Carmona, Bastida-Castillo, Ibanez, & Pino-Ortega, 2020; Gomez-Carmona, Pino-Ortega, Sanchez-Urena, Ibanez, & Rojas-Valverde, 2019). Impulse Load has been proposed as a beneficial tool over other variables, such as Player Load as it only includes locomotor activity and represents the sum of locomotor events (Gentles, Coniglio, Besemer, Morgan, & Mahnken, 2018).
Among the numerous wearable physiological monitoring devices, the ZephyrTM BioHarness (BH; Zephyr Technology Corporation, Annapolis, MD, USA) is a wireless chest-based wearable system, capable of real-time and long-distance recording of a set of physiological and mechanical variables. Literature has shown the reliability and validity of the ZephyrTM BioHarness as a multivariable monitoring device, both in laboratory settings and in field-based assessment, including assessing variables such as respiratory rate (RR) (Hailstone & Kilding, 2011), HR (Nazari et al., 2018), accelerometry, infra-red skin temperature and posture (Johnstone, Ford, Hughes, Watson, & Garrett, 2012a, 2012b; James A. Johnstone et al., 2012). More recently (Nazari & MacDermid, 2020), it was demonstrated that RR and HR are responsive indicators when transitioning from a resting to a submaximal state and conversely. These authors found that a change in HR scores that would exceed ±5.85 beat∙min-1 at rest, ±9.78 beat∙min-1 at sub-maximal activity or ±9.73 beat∙min-1 at recovery would provide coaches and sport scientists with the 95 % confidence that a true change in this parameter has occurred, whereas RR was a sensitive indicator of change in activity states. So, the ZephyrTM BioHarness can be used to characterize and monitor the physiological and mechanical loads during exercise, so that training programs prescription can be adjusted and individualized.
During an official match, football referees are required to keep up with play at all times to ensure an optimal positioning to judge and decide on key moments. A comprehensive body of literature on match performance (Castagna, Abt, & D'Ottavio, 2007; Reilly & Gregson, 2006; Weston et al., 2012) shown that during a competitive match, a football referee can cover from 9000 to 13000 m, with ~900 m of high-speed running, attaining approximately 85-90 % and 70-80 % of maximal HR and maximal oxygen uptake (VO2max), respectively. Although the variability of these values is extremely high, depending on match-to-match variability, player level, age, or fitness, findings underlie the importance of intermittent high intensity running activities of football refereeing, similarly to player activity profiles (Weston, Drust, Atkinson, & Gregson, 2011). Also, we must consider the variation associated to the role in refereeing.
The assistant referee match profile is characterized by brief intense bouts of forward and sideways running interspersed with low-activity periods, as they move from end-line to half-way line over approximately 50 m along the verge of the sideline (Krustrup et al., 2009; Reilly & Gregson, 2006; Weston et al., 2012). On average, an assistant referee covers a total distance of 6.76±0.83 km, from which 0.97±0.22 km are covered at high-intensity running, and 1.54±0.66 km are covered running sideways (Krustrup et al., 2009). Lower external match responses in assistant referees were previously observed (Barbero-Alvarez, Boullosa, Nakamura, Andrin, & Castagna, 2012), where high-intensity accelerations during matches were ~29 % lower than those reported in field referees. More recently, a study shown that the refereeing role has a large effect on internal match responses, where assistant referees had lower values of HRmax (166.11±13.65 beat∙min-1), HRmean (129.76±15.61 beat∙min-1), and %HRmax (77.88±4.23 %) (Castillo, Camara, Lozano, Berzosa, & Yanci, 2019). Nevertheless, internal and external monitoring during official matches rarely included accelerometry-derived workload variables. Therefore, understanding the physical demands or refereeing is critical to examine the different internal and external responses required and optimize the adaptation processes in conditioning programs.
This exploratory study aimed to examine the variation between-half in physiological and mechanical load parameters in sub-elite referees and according to their specific role as officials. We hypothesized that the field referee and assistant referees would differ in physiological and mechanical load variables during the match-play. Whenever possible, this knowledge may be used to individualize and optimize specific training programs according to football referees' level.
MATERIALS AND METHODS
Participants
The present empirical research included the examination of three football male officials: one field referee (32.0 years, 74 kg, 180 cm, 22.8 kg/m2) and two assistant referees (assistant 1: 31.0 years, 79 kg, 178.0 cm, 24.9 kg/m2; assistant 2: 30.0 years, 67 kg, 171.0 cm, 22.9 kg/m2). All participants started their refereeing career in the 2003-2004 season, corresponding 15 years of experience in refereeing. Their training routines followed the general recommendations by the Refereeing Board of the Portuguese Football Association. These recommendations comprised 4 to 5 training sessions during the competitive period, focusing on fitness and conditioning, including active recovery, high intensity training, resistant speed, reaction speed and injury prevention. Throughout the season, there are also planned several moments of integrated training sessions, focusing on technical aspects of refereeing. Following the study procedures indication and informed consent signed by a field football referee and assistant referees belonging to the national second category (C2), corresponding to a sub-elite level, the participation in this study was authorized by the Portuguese Football Association Refereeing Committee. The standards research in sports medicine were considered according to the Declaration of Helsinki. For this descriptive study design, all the three elements were monitored during 4 official matches of Portugal's Championship during the 2018-2019 season. The time window for data collection was of a convenience nature, limiting the interpretation and extrapolation of the data.
Data collection
Each one of the participants were assigned and familiarized with the wear and operational procedures of the ZephyrTM BioHarness (BH; Zephyr Technology Corporation, Annapolis, MD, USA) before the first match. Referees were equipped with a BH, that included a Biomodule (version 3.0) and a strap.
The Biomodule device was placed on the side of an adjustable strap, located under subject left arm. The garment strap includes electrode sensors for capturing heart rate (i.e., detecting R wave forms) sampled at 250 Hz, and a capacitive pressure sensor (25 Hz) that detects circumference expansion and contraction of the torso for respiratory rate. The Biomodule contains a triaxial accelerometer that samples at 100 Hz, convertible to gravitational force (1 g=9.81 m s 2 ). Acceleration data is monitored in gravitational force (g) on each single axis or as Vector Magnitude Units (VMU) which is an integrated value over the previous 1 second epoch (stationary = 0 VMU, walk ~ 0.2 VMU and run ~0.8 VMU). Acting as an inclinometer, data in angular degrees (°) ranges between -180° and +180°, it assesses the subject inclination (anterior inclination is positive value, posterior is negative, while medio-lateral inclination does not affect sign of posture value) reported at a 1 Hz frequency. Skin temperature, recorded at the inferior sternum, was collected through and infra-red sensitive sensor. This sensor reports data (1 Hz) in degrees Celsius (ºC). BH data was then downloaded using the BioHarness Log Downloader and analyzed with the OmniSenseTM Analysis (version 4.1.4; Zephyr Technology Corporation, Annapolis, MD, USA).
Variables
Data was collected on a field referee and two assistants during 4 official football matches of the Portugal's Championship, corresponding to the adult third division (senior age category), which is classified as a sub-elite or semi-professional level. All BH were powered on by one of the researchers prior to each match. Match-play included two 45 min halves, a 15 min half-time, and stoppage time, which was added to the end standard play in each half. Match total time was recorded. Due to erroneous physiological data such as zero breathing rate recorded or accelerometry, some data was removed from analysis. Consequently, physiological, and mechanical data could only be recorded from 3 matches of two of the refereeing team members was retained for analysis. Thus, a total of 10 matches (corresponding to 20 halves) were analyzed among the three elements.
The BH is a wireless physiological monitoring device capable of capture and transmit a wide range of physiological and mechanical data (OmniSense Analysis Help, 2016), including estimated skin temperature, respiratory rate (RR), heart rate (HR), posture, activity levels and acceleration peak (ACCpeak). The mean values were calculated for the 1st half, 2nd half and for the total match-play, after extraction of all data recorded in each second to an Excel file. Percentage of maximum heart rate (%HRmax) was obtained according to Tanaka, Monahan, and Seals (2001): HRmax=208 −0.7×age. This age-predicted HRmax regression equation was cross-validated in 514 healthy adults, as an alternative to the most commonly used equation for prescribing exercise programs: HRmax=220 −age.
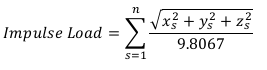
Impulse Load corresponds to a cumulative measurement of mechanical load, i.e., the sum of the areas under the accelerometer magnitude curve for all impulses, expressed as N∙s. The equation for Impulse Load is displayed below, where x=g forces in the medio-lateral ("side-to-side") plane, y=g forces in the anterio-posterior ("forwards and backwards") plane, and z=g forces forces in the vertical ("up and down") plane (OmniSense Analysis Help, 2016). This variable only includes detected locomotor events (e.g., walking, running, bounding or jumping) and impacts. Mean Impulse Load was calculated for half (1st and 2nd) and total match-play.
Statistical analysis
Statistical procedures included descriptive statistics (range, mean, mean standard error, confidence intervals, and standard deviation) for all data recorded over a total of 10 matches, considering the three elements (Table 1). Coefficient of variation (CV%) was also computed for each variable (CV%=(sd÷mean)×100) in the entire sample. Normality assumptions were also tested using the Shapiro-Wilk test and verified by visual inspection. When assumptions of normality were violated, non-parametric tests were performed.
Then, inter-individual differences were calculated using the Mann-Whitney U test based on each half of the match (1st half vs 2nd half) and the role within the refereeing team (field referee vs assistant referees). To estimation of the effect size for nonparametric tests, followed the suggested equation (Fritz, Morris, & Richler, 2012): r=Z/√n. Interpretation of effect size was performed according as following (Rosnow & Rosenthal, 1996): <0.2 (trivial); 0.2-0.6 (small); 0.6-1.2 (moderate); 1.2-2.0 (large); 2.0-4.0 (very large); > 4.0 (extremely large). The significance level was set at 5 %.
All data analyzes were computed using IBM Statistical Package for Social Science software for Windows (SPSS v.23.0, IBM Corp.; Armonk, NY, USA) and GraphPad Prism version 5.03 (GraphPad Software, Inc.; La Jolla, CA, USA).
RESULTS
Table 1 shows the results for the physiological and mechanical measurements considering all the refereeing team members.
Table 1. Descriptive statistics for the physiological and mechanical measurements for a sub-elite refereeing team during a match-play (n = 4).
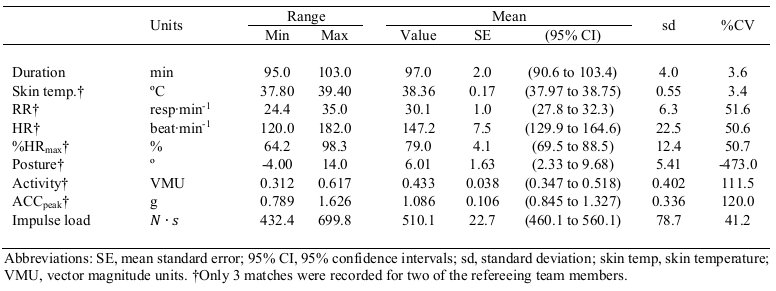
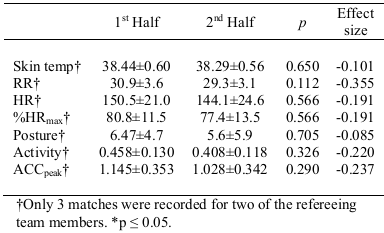
Table 2 shows the results for the different physiological and mechanical variables between the 1st and 2nd halves, considering the three members of the refereeing team. No differences were found between match periods, and small to trivial effects were noted (table 2). This comparison reveals an average tendency to maintain the values, with no statistically significance. Complementary, the match period-associated variation was examined, and no differences were observed between the 1st and the 2nd half (p > 0.05) according to the role within the refereeing team.
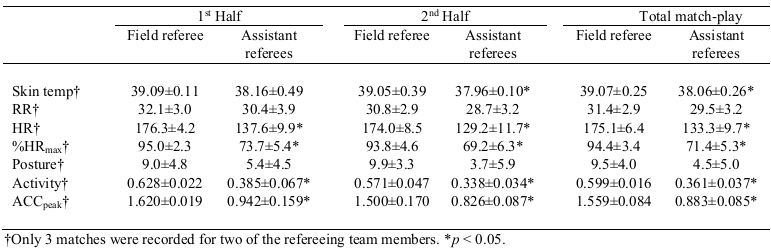
On the contrary, physiological and mechanical differences were observed between the field referee and the assistant referees for both the 1st and 2nd halves, and for the total match-play (table 2). In more detail, at the end of the first 45 minutes it was possible to observe significant differences for HR (p = 0.017; r = -0.775), %HRmax (p = 0.017; r = -0.775), activity (p = 0.017; r = -0.757), and ACCpeak (p = 0.017; r = -0.757), with moderate effects. This trend is also apparent throughout the 2nd half, as skin temperature becomes significantly (p = 0.016, r = -0.759) different among the refereeing team members (HR: p = 0.017; r = -0.775; %HRmax: p = 0.017; r = -0.775; activity: p = 0.017, r = -0.757; ACCpeak: p = 0.017, r = -0.757). Finally, on average, our results showed significant differences for skin temperature, activity and ACCpeak, with a moderate effect size (p = 0.017; r = -0.757) for the mentioned variables, as well as for HR and %HRmax (p = 0.017; r = -0.775).
Results in figure 1 showed no significant differences in impulse load between the field referee and the assistant referees during the 1st half (p = 0.734; r = -0.100), the 2nd half (p = 0.734; r = -0.100), neither for the total match-play (p = 1.0; r = n.a.).
DISCUSSION
The present study sought to examine the physiological and mechanical responses during competition in a field referee and two assistant referees of a sub-elite level. Our results noted no significant effect of match half when considering the three match officials, i.e., no differences were observed between the 1st and the 2nd half. By contrast, a significant variation was noted among football officials for both the 1st and the 2nd halves, as well as for total match-play. Our results also suggested that the use of Impulse Load as accelerometry-based workload might not be such a valuable tool to apply in sub-elite football referees.
Table 3. Comparison between the refereeing team elements considering their specific roles in each half and the total match-play.
Understanding the physical demands of refereeing and the physiological capacities required by football officials is critical, regardless the competitive level. Several studies indicated that a referee's physical demands are highly dependent on player activity profile, and these tend to vary according to competitive level (Castagna et al., 2007; Krustrup et al., 2009; Reilly & Gregson, 2006; Weston et al., 2012; Weston et al., 2011). However, the emphasis has been drawn into examining refereeing within top football levels. Sixty-three football officials of the Spanish National Third Division were analyzed during thirty matches across the 2014-2015 season (Castillo, Weston, McLaren, Camara, & Yanci, 2017), and field referees (n = 20) internal and external load was considerably higher when compared to assistant referees (n = 43), with differences ranging from very likely to most likely extremely large. This study also found no clear relationship between internal load and external loads, suggesting that these factors are somewhat independent of one another in sub-elite referees. At this level, the use of ratings of perceived exertion might be preferable over the use of internal load parameters based on HR, like the Edwards' Training Load (Costa et al., 2013), particularly by the significant association with external load such as distance covered at 90-100 % of HRmax and maximal speed (km∙h-1).
Conflicting results have been reported when analyzing the match period-associated variation (Castagna et al., 2007; Weston et al., 2012). In our study, no differences were apparent between the 1st and the 2nd half, both for the refereeing team and for the field referee and assistant referees. It was suggested that a simple between-half comparison might not be sensitive enough to detect the accumulated fatigue during match-play (Weston et al., 2012) and the observation of workload across limited periods of time would be useful. The total distance covered and the covered distances by activity zones were observed for every 15-minute match period during Korean National League football matches and showed similar patterns of physical activity for players and referees (Joo & Jee, 2019). However, in this study a greater amount of foul decision errors occurred at longest distances of the field referee and assistant referees, particularly after halftime. Therefore, to reduce the decision error rate, it is important to recognize the relevance of sustaining high physiological responses, as a reaction to the players' physical profile during a match. Generally, the training of football officials tends to be self-led (McEwan, Unnithan, Easton, & Arthur, 2020) and mainly focused on physical activities (Weston et al., 2012). Although physical fitness alone may not be enough to help referees coping with the physical and contextual stress during match-play (Schmidt et al., 2019), the design of specific training strategies for field referees must focus on cardiovascular capacity and sprinting ability, as longer distances at high intensity and acceleration and decelerations are covered, whereas the assistant referees training must highlight sprint ability and agility.
Literature is consistent in the demonstration of how internal and external loads are affected by the physical demands associated to the specific role within a refereeing team (Castagna et al., 2007; Reilly & Gregson, 2006; Weston et al., 2012). Reported values of HR and %HRmax tend to range between 85 to 90 % of HRmax in field referees and ~78 % in assistant referees. Match activities and physical demands of thirty referees were examined by Krustrup et al. (2009) and the HRmean during 14 international matches was 151±9 beat∙min-1 for field referees and 124±15 beat∙min-1 for assistant referees. For field referees the HRmean was not altered during the game, although differences were found for assist referees from 45 to 60, 60 to 75, and 75 to 90 min when compared to 0 to 15 min. At a sub-elite level, Castillo et al. (2019) found higher internal match responses for HR indicators (field referee: 156.87±11.06 beat∙min-1, 85.68±2.80 % of HRmax; assistant referee: 129.76±15.61 beat∙min-1, 77.88±4.23 % of HRmax). A similar trend was also noted in our sample, where higher mean values of HR (175.1±6.4 beat∙min-1) and percentage of HRmax (94.4±3.4 %) observed in field referees, and 135.9±11.2 beat∙min-1 and 72.8±6.1 %, respectively, in assistant referees. This tendency was also verifiable in both halves. Heart rate is often used to translate different workloads expressed as a percentage of individual's HRmax to evaluate the contribution of aerobic and anaerobic energy production during exercise. A rising skin temperature and breathing frequency are physiological responses that follow the higher physical demands, suggesting that the physical conditioning of our sample is not optimally adapted to the required competitive effort.
According to the training load monitoring framework (Vanrenterghem, Nedergaard, Robinson, & Drust, 2017), in which the physiological and biomechanical load-adaptation pathways are considered separately, the activities performed by an individual lead to biomechanical stresses and mechanical stresses on the different tissues that comprise the musculoskeletal system. A unique aspect of the current study was the equipment used for analyzing physiological and mechanical characteristics in football referees during official matches, particularly containing a triaxial accelerometer. Although no consensus is apparent regarding the best use of accelerometry-based external indicators (Gomez-Carmona et al., 2019), accelerometers can measure static high-intensity actions without covering grounds (jumps, collisions, falls, tackle, etc.) with high accuracy. Indexes such as Impulse Load or Force Load may provide benefits over other variables such as Player Load (Buchheit & Simpson, 2017), besides having numerous advantages compared to training loads obtained by a GPS device. Gentles et al. (2018) demonstrated that Impulse Load was related to total distance (r = 0.95; p < 0.001) in women's football players, thus suggesting the use of accelerometry workloads that include only locomotor activity as a helpful tool. However, Impulse Load is not sensitive enough to detect differences among football officials, between halves. In fact, no differences were noted between the field referee and assistant referees in our study. On the other hand, Castillo et al. (2017) used the Player Load index to successfully observe most likely extremely large differences between Spanish sub-elite field referees and assistant referees. Our results suggest that the posture, activity, and ACCpeak might be sufficiently informative regarding the variation of mechanical load among football referees associated to match half. In this sense, field referees have more running activities, which is corroborated by a higher inclination, obtaining the largest acceleration magnitude as they are required to keep up with play, positioning for judging and deciding at all moments. Nevertheless, our data is not clear enough to refute the use of Impulse Load as this index showed higher mean results for the field referee when compared to assistant referees.
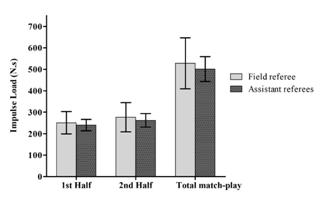
Figure 1. Impulse load (N∙s) comparisons between the field referee and assistant referees during the 1st and 2nd half, and total match-play (mean±sd).
Limitations of the present study must be clearly acknowledged, and these include a limited number of observations. Future studies should consider a larger sample of referees and examined matches. Between-match variation was not properly addressed in our study, particularly when it has been shown high mean coefficients of variation, ranging from 25.9±10.1 % in high-speed running distance, to 54.0±20.7 % sprint frequency, for example (Weston et al., 2011). Also, the interrelationship between the physical activity profile of match officials and players, and some contextual and situational variables (Carvalho, Esteves, Nunes, Mendez, & Travassos, 2020) could be considered. Additionally, a direct measure of HRmax would be advised. For instance, more task-specific tests such as the Yo-Yo Intermittent Recovery Test (YYIRT) have been developed and validated for use with referees (Castagna et al., 2007). Further limitations are related to the use of other accelerometry-based external indicators, since there is no standardization of a universal index (Gomez-Carmona et al., 2019).
CONCLUSIONS
In summary, between-half comparisons did not reveal any significant differences, while the role played within a refereeing team is associated to physiological and mechanical load differences. The field referee consistently presented higher values for HR, %HRmax, activity and ACCpeak when compared with the assistant referees during 4 observed matches of a sub-elite level. Our understanding of the variation associated to the refereeing level is still increasing and more information is necessary, particularly if we take into consideration the development, training, and career progression of a football official. Therefore, it is suggested that literature focus on training load monitoring to select appropriate, specific and adjust training methodologies to better cope with the physical demands during an official match.
PRACTICAL IMPLICATIONS
Even though each official football match implies a variability on physical demands, the field referee and assistant referees internal and external loads are substantially different, and this information should be used for a more individualized training prescription program. For example, physical conditioning programs of field referees should focus on the cardiovascular capacity, while agility is recommended in assistant referees' sessions. Considering that the load-adaptation of both physiological and mechanical pathways have different response rates, consequences for the individualized planning and/or rehabilitation sessions when to enhance performance and prevent (re-injury) (Vanrenterghem et al., 2017). Thus, the analysis of match workload is of great importance to physical preparation and assessment of referees, being dependent upon competition level.

