INTRODUCTION
Oropharyngeal dysphagia (OD) is a symptom of swallow dysfunction that provokes difficulty or inability to form or move the alimentary bolus safely from the mouth to the esophagus, and occurs between the mouth and stomach (1); this condition may be caused by different diseases such as neurological or neurodegenerative diseases (Parkinson and Alzheimer diseases, dementia, amyotrophic lateral sclerosis) and head and/or neck diseases (cancer, Zenker diverticulum, osteophytes). OD may result in malnutrition, dehydration, and tracheobronchial aspiration (1,2).
The occurrence of malnutrition in patients with OD is often 2.4 (CI: 1.264 to 4.649, p < 0.008) times higher than in subjects with normal swallowing function during the rehabilitation stage (3,4). It has been reported that 17 % of older adults with OD have malnutrition, while 34 % are at risk of malnutrition (5). A higher prevalence of malnutrition was reported in patients with OD (45.3 %) when compared to those without OD (18 0%) (p < 0.001). When malnutrition and OD co-existed, one-year mortality reached 65.8 % (p < 0.008) (6).
The reduction in dietary food and liquid intake of OD patients could be a risk factor for weight loss and malnutrition (7), which causes structural changes in the body, including a decrease in cell mass, loss of proteins, or modifications in fluid balance. These impairments may cause changes such as loss of muscle mass and strength, adipose changes, and fluid imbalance (2). Handgrip strength (HGS) is a validated and reliable method frequently used as an inexpensive surrogate of overall muscle strength (8). The Nutritional Risk Screening 2002 (NRS-2002) tool has been proposed as a universal screening instrument for malnutrition in hospitalized patients, as it assesses body mass index (BMI), weight loss, appetite, and severity of disease. It allows a rapid and simple identification of patients requiring nutritional support, and reflects especially the severity of acute comorbidities (9).
Bioelectrical impedance analysis (BIA) is a practical, portable, non-invasive method. BIA offers a reliable approach to assessing body composition and prognosis by evaluating the quality of the entire cell membrane, and describes the distribution of fluids (10). BIA components include resistance (R), which shows a purely resistive component of the intra- and extracellular solutions, and reactance (Xc) or capacitive component in the tissues according to the polarity of cell membranes. Another component of BIA is phase angle (PA), which serves as an indicator of integrity and vitality of the cell membrane, and depends on age, sex, fluid distribution, BMI, and parameters such as disease, inflammation, malnutrition, and physical inactivity. It is associated with tissue status, and therefore PA values will differ depending on clinical conditions. Higher values can be proportionally considered as an index of vitality, while lower values are indicators of cell membrane deterioration. Lower values are also related to decreased muscle function, and increased risk of mortality (11-13).
Body composition is an important factor for nutritional status, and understanding changes in these parameters is important to recognize health implications and decide a nutritional intervention (14). The purpose of this study was to evaluate the presence of cachexia, PA, muscle strength, and nutritional risk according to the type of feeding regimen tolerated by patients as established with the volume-viscosity swallow test (V-VST).
MATERIAL AND METHODS
STUDY POPULATION
A cross-sectional study was conducted in a tertiary referral center. We included hospitalized adults of both sexes who had been diagnosed with OD, confirmed by the Eating Assessment Tool-10 (EAT-10) and V-VST (15,16), by standardized, specialized personnel. Subjects were excluded if they exhibited clinical signs of hydration imbalance or acute illness, or if they had a pacemaker or metallic implants. All subjects or their legal representatives were informed about the purpose of the study and signed an informed consent form before inclusion. The study was approved by the Ethics Research Committee of the institution.
CLINICAL MEASUREMENTS
Clinical and demographic data (diagnosis at admission, age, sex, and type of caregiver) were obtained from medical records.
The EAT-10 consists of 10 items used to assess the severity of OD symptoms. The tool scores on a scale from 0 (no problem) to 4 (severe problem). A final score of ≥ 3 is abnormal and indicates the presence of swallowing difficulties (15,17,18). In subjects with an EAT-10 final score ≥ 3, a V-VST was performed to confirm OD and establish the ideal tolerated volume and viscosity to be fed safely.
The V-VST is a clinical screening tool with high diagnostic accuracy in the identification of clinical signs and symptoms regarding the effectiveness and safety of swallowing. It uses different volumes (5, 10, and 20 mL) and viscosities: 250 mPas (called nectar by the National Dysphagia Diet (NDD) nomenclature), < 50 mPas (called thin liquid by the NDD), and 3500 mPas (called spoon-thick by the NDD) (19). The algorithm proposed by Clavé et al. for the identification of evidence for impaired efficacy of swallow (abnormal sealing of the lip, presence of oral residues, fractional swallow, and symptoms of pharyngeal residues) and impaired safety (wet voice, cough, and decrease in oxygen saturation by ≥ 3 %, as measured with a digital pulse oximeter). If a patient exhibits one or more signs of deterioration in the efficacy and/or safety of the swallowing process, they are diagnosed with OD (16).
According to tolerated (without showing signs of impaired efficacy or safety) viscosity as determined by V-VST results, patients were classified into the nectar oral intake, spoon-thick oral intake, or exclusive tube feeding groups when they did not tolerate any of the aforementioned viscosities due to exhibiting signs of impaired efficacy and safety in swallowing (1).
NUTRITIONAL AND BODY COMPOSITION MEASUREMENTS
Nutritional parameters were assessed in every patient by a trained nutritionist and included the following:
- Nutritional risk was determined with the Nutritional Risk Screening 2002 tool (NRS-2002) (20). Anthropometric measurements included body weight, height, and calf circumference, which were measured according to an anthropometric standardization manual (21). Body weight was measured in kilograms using a digital scale (SECA model 810; SECA Corp.), and rounded to the nearest 0.1 kg; height was measured in meters using a stadiometer (SECA model 213; SECA Corp.), and recorded to the nearest 0,1 cm. BMI was calculated with the formula: BMI = weight (kg) / height (m2).
- Handgrip strength (HGS) was measured with a Takei Smedley Hand Dynamometer. The patient was instructed to apply the most pressure possible with their dominant hand. The measurement was repeated three times, with a separation of 1 min to avoid fatigue, and the mean value was recorded.
- The detailed analysis of nutritional intake was assessed using a 24-hour recall, and was analyzed using the ESHA Food Processor SQL software, version 11.1.0.
- Body composition was measured using tetrapolar mono-frequency (50 kHz) equipment (Quantum X, RJL Systems, Clinton Township, Michigan, USA). Patients refrained from eating and drinking for 6 hous, without portable electric heaters, and were instructed to lie supine with their hands at their sides and with their legs apart in a comfortable area. All measurements were performed by the established tetrapolar protocol (13,22). Values (R, Xc) were normalized for patient height, and bioelectrical impedance vector analysis (BIVA) software was used to obtain the impedance vector, which is represented in the RXc graph of the healthy population (11). Patients with vectors outside the 75 % tolerance ellipse graph of the reference population, on the right side of the RXc graph were classified as cachectic (10).
STATISTICAL ANALYSIS
Continuous variables were reported as mean ± standard deviation (SD) or median and interquartile range (IQR: 25th-75th percentile), according to their distribution. Categorical variables were presented as numbers and percentages. The study population was divided into three groups according to type of feeding regimen and the viscosity level tolerated by patients as determined by the V-VST (nectar viscosity, spoon-thick, and exclusive tube feeding). We adopted a univariate analysis of variance (ANOVA) test for continuous variables or the Kruskal-Wallis test for variables with asymmetrical distribution. Post-hoc analyses with the Mann-Whitney U-test and Bonferroni's correction were performed to identify the differences between groups. For categorical variables we used Pearson's χ2 test. We set a p-value < 0.05 as statistically significant. The analysis was performed with the Statistical Package for the Social Sciences (IBM SPSS Statistics for Windows; IBM Corp, Armonk, NY) software, version 21.
RESULTS
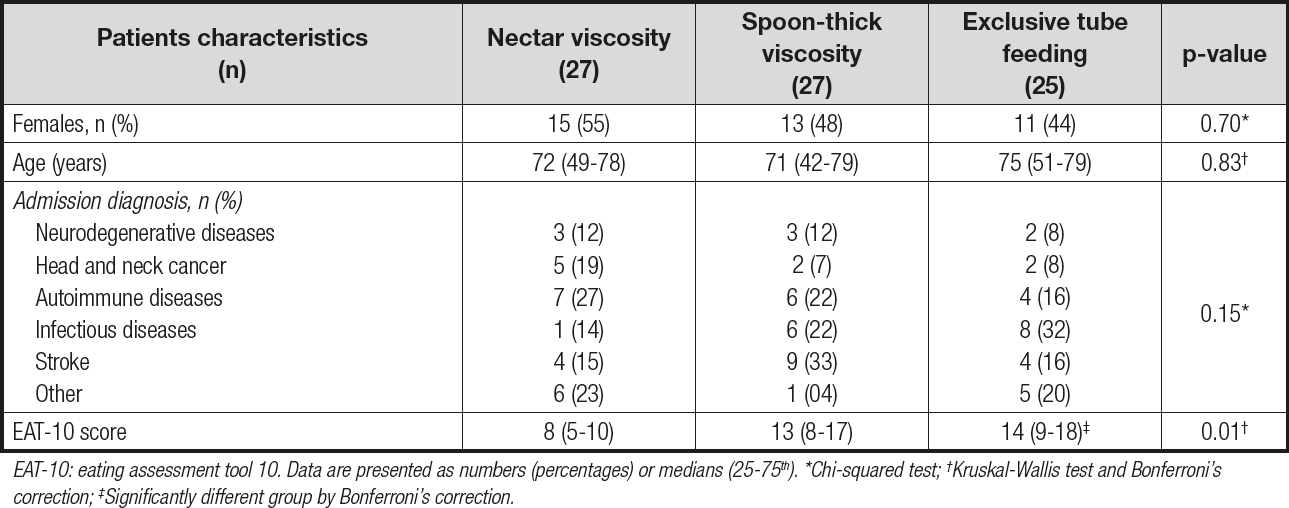
A total of 79 patients (39 women, 49 %) with a median age of 73 years were included. Table I shows the demographic and clinical characteristics of the subjects. The predominant cause of OD was associated with neurological and infectious diseases, without statistical differences. In 81 % of patients the primary caregiver was a family member. According to the V-VST, 27 (34.2 %) patients tolerated nectar viscosity, 27 (34.2 %) spoon-thick food, and 25 (31.6 %) exclusive tube feeding. Patients with exclusive tube feeding presented a higher EAT-10 score as expected.
Table I. Demographics and clinical characteristics of the study subjects according to feeding regimen type and tolerated viscosity level

EAT-10: eating assessment tool 10. Data are presented as numbers (percentages) or medians (25-75th). *Chi-squared test; †Kruskal-Wallis test and Bonferroni‘s correction; ‡Significantly different group by Bonferroni‘s correction.
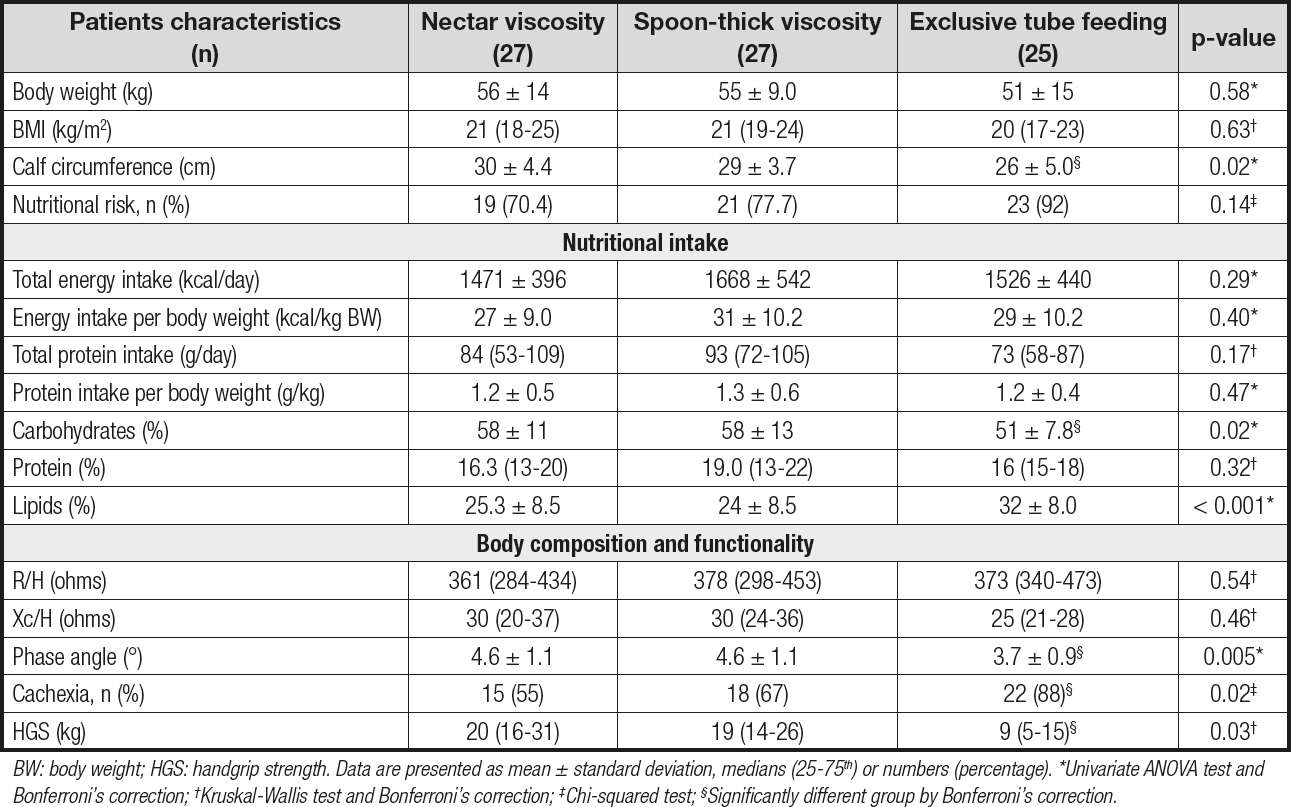
Most of the patients were identified to be at nutritional risk (79.7 %); BIVA also revealed the presence of cachexia (69.6 %). The nutritional risk in patients with exclusive tube feeding was 92 %; furthermore, it was 78 % in both oral intake groups, the nectar viscosity group and the spoon-thick viscosity group (p = 0.15).
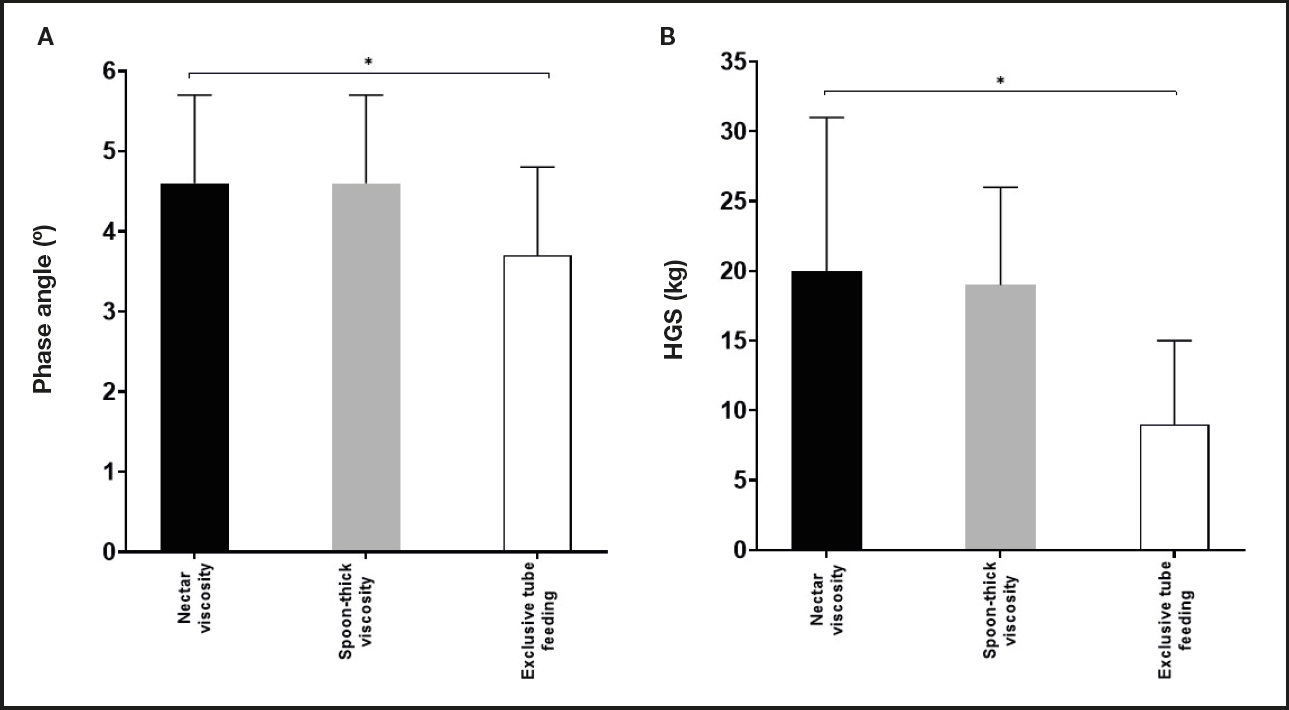
Nutritional intake, body composition, and HGS differences between groups are presented in table II. No significant differences were observed in the dietary intake (calories and protein) of the different groups. Weight, BMI, and calf circumference were higher in the nectar viscosity group as compared to the other groups. Differences in body composition and functionality were also observed between groups. PA (p = 0.005) and HGS (p = 0.03) were lower in the exclusive tube feeding group when compared to the nectar and spoon-thick viscosity groups (Fig. 1). The presence of cachexia as evaluated by BIVA was more frequent in the exclusive tube feeding group compared with the nectar and spoon-thick viscosity groups, with differences being statistically significant (p = 0.02).
Table II. Nutritional characteristics, body composition, and functionality according to feeding regimen type and tolerated viscosity level

BW: body weight; HGS: handgrip strength. Data are presented as mean ± standard deviation, medians (25-75th) or numbers (percentage). *Univariate ANOVA test and Bonferroni‘s correction; †Kruskal-Wallis test and Bonferroni‘s correction; ‡Chi-squared test; §Significantly different group by Bonferroni‘s correction.
DISCUSSION
Undiagnosed or untreated OD and malnutrition can result in clinical complications that may impact the quality of life and well-being of patients. Despite being a highly prevalent condition in patients with OD, malnutrition has been poorly evaluated in this setting. Previous studies reported that the presence of malnutrition in OD patients has serious implications for prognosis, disease recovery, prolonged hospital stay, and higher treatment costs (5,23).
In our study of 79 subjects, nutritional risk was higher in patients with OD who were on exclusive tube feeding. Likewise, the anthropometric parameters and indicators of body composition were significantly lower than in those on oral feeding, whatever the viscosity level. The variety of admission diagnoses that were related to the etiology of OD indicates the importance of identifying subjects with swallowing impairment and malnutrition, as recommended by the European Society for Swallowing Disorders (6,14,24).
Compared with other investigations, we observed a higher frequency of nutritional risk (79.9 %). These results may be related to differences in the study population (heterogeneity of OD etiologies and age range). Carrión et al. observed a frequency of malnutrition and risk of malnutrition ranging up to 68.4 % (5,6). Concerning the evaluation of cachexia by BIVA, a high frequency was also observed. For both parameters, frequency was higher in the exclusive tube feeding group; in these subjects OD was severe, and they could not tolerate any viscosity level because the safety or efficacy of swallowing was compromised.
The evaluation of nutritional status through techniques such as BIVA allows to identify cellular integrity and tissue hydration. Medical nutrition therapy can improve these indicators and lead to an improved prognosis (25).
The exclusive tube feeding group showed lower PA and HGS values, which have been related to their nutritional risk and reduction in muscular strength (12,26,27). Under malnutrition conditions PA is frequently lower than normal, and its use has been recommended as a prognostic marker of morbidity and mortality. Lower PA appears to be consistent with an alteration of cell integrity or with changes in the selective permeability of the cell membrane. A higher PA is associated with healthy cell membranes and higher body cell mass (27). These results in PA and HGS that were found in the exclusive tube feeding group may be thought of as prognosis indicators of survival; however, studies including a representative sample and follow-up are required to justify this association.
Our findings are consistent with those of previous research in the literature, which reported that malnutrition and nutritional risk are frequent conditions in patients with OD (5,28). Furthermore, any medical condition that may lead to OD can directly reduce dietary intake and result in weight loss because of reduced muscle mass, and therefore increase nutritional risk. Besides, the coexistence of OD and malnutrition results in a vicious circle, since malnutrition may worsen OD itself, leading to increases in morbidity and mortality (26,29).
In the indicators of dietary intake (energy and protein) we did not observe any statistically significant differences between study groups. As mentioned before, OD affects food intake, which subsequently increases the risk of malnutrition in these patients; therefore, in most cases, it is necessary to modify or adjust viscosities and volumes to improve both the swallowing process and nutritional status (14,30,31).
This article has several limitations. The heterogeneity of OD etiologies, the paucity of information regarding the severity of the disease, and the wide range of ages limit the comparison of our findings with those of studies previously conducted on specific populations. Despite using a small sample to obtain statistical significance, clinical differences can be observed in the different parameters evaluated between the groups. However, as the sample is small, a sensitivity analysis could not be made.
This study contributes to underscoring the value of an early and accurate assessment of impaired swallowing, and consequently of the prevention of malnutrition, wasting, and loss of muscle mass. Furthermore, it argues for the implementation of an effective and early intervention to preserve nutritional status and body composition. BIVA allows to evaluate the integrity of muscle mass and tissue hydration, both of which are related to phase angle.
In conclusion, nutritional risk was present with a higher frequency in the study population (79.9 %), and lower PA and HGS values were observed in the exclusive tube feeding group. These factors are considered important for the prognosis.


