


 Servicios personalizados
 Inglés (pdf)
 Articulo en XML
 Referencias del artículo
 Enviar articulo por email
 Citado por SciELO
  Citado por Google
  Similares en
SciELO
Similares en
SciELO  Similares en Google
 Permalink
INTRODUCTION
Osteoporosis is the most prevalent bone disease characterized by low bone mineral density (BMD) leading to an increased risk of fracture. Osteoporosis-related fractures represent an immense economic burden on the healthcare systems. Common diseases such as osteoporosis are usually polygenic, involving many genetic variants rather than rare monogenic mutations (1). Several studies have shown that BMD is a highly polygenic trait, which is directly associated with bone fracture (2). Over the past 15 years, genome-wide association studies (GWAS) have identified many genomic loci as related to the risk of various complex diseases (3). The knowledge of the genetic variants involved in a specific trait allows the early identification of subjects at risk and the initiation of preventive measures. Thus, in the GWAS era, several genetic variants have been related to BMD and fracture risk. The seminal study of Estrada et al. identified 56 loci associated with BMD and 13 SNPs with bone fractures (4). Another more recent study from the UK Biobank database analyzed the association of genetic variants and heel quantitative ultrasound (eBMD) in a total of 426 824 individuals to finally identify 518 significant loci (5).
The results of those studies are being used to develop risk scores based on the analysis of multiple gene variants (polygenic risk scores, PRSs). Hence, a PRS can be defined as an individual's mark made of the allelic signature at a number of polymorphic loci (often, tens or hundreds, or even thousands) related to the genetic susceptibility to develop a disorder (2). A representative analysis with PRSs involves an association between a PRS and a trait from the main data. This association can be evaluated with standard analytical procedures such as the p value to test a null hypothesis; effect size estimate (OR of high vs low risk individuals), and/or with measures of discrimination like the area under the curve (AUC). Several statistical tests can be applied to check the significance of the association including linear or logistic regression with or without adjusting for covariates like sex and age (6).
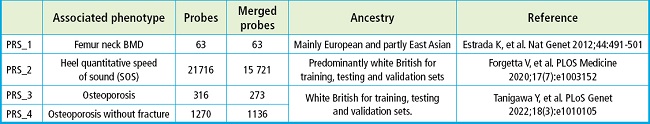
Several PRSs have been generated in relation to BMD and/or risk of fracture. First, the 56 loci identified (n = 63 probes) from the seminal study described above (4) were used as a PRS related to femoral neck BMD. Richards' lab developed a prediction of fracture risk PRS (n = 21717 probes) by using ultrasonography data of the calcaneus as an intermediate phenotype (7). Their polygenic risk score was more strongly associated with the risk of fracture than many other clinical risk factors, including age, sex, BMI and FRAX clini- cal factors (8). Additionally, Tanigawa et al. generated two distinct PRS models, incorporating the results at 316 and 1270 loci, respectively (9).
The objective of this study was to analyze the capacity of the previously mentioned PRSs to discriminate between patients with osteoporosis and controls in the Spanish population.
METHODS
SAMPLE RECRUITMENT
Our dataset included two groups. The group of cases corresponds to patients with osteoporosis recruited at the Marques de Valdecilla University Hospital (n= 304; 293 women; mean age, 65 years; range 47 to 87 years). Subjects with secondary osteoporosis were excluded. BMD was measured by dual X-ray densitometry (DXA) at the spine (mean BMD 0.744 [Interquartile range, IR, 0.692 to 0.792]) and the hip (mean BMD 0.737 [IR 0.679 to 0.803]) using a Hologic QDR 4500 densitometer (Waltham, MA, United States).
The control included samples from the overall Spanish population that were provided by the “Banco Nacional de ADN Carlos III (BNADN; https://www.bancoadn.org) (n = 3199; 1458 women; mean age, 48 years; range 18 to 104 years).
These data were not included in former GWAS. The study protocol was approved by the institutional review board (Comité de Ética en Investigación Clínica de Cantabria). All patients gave their informed written consent.
DNA ISOLATION AND GENOTYPING
DNA was isolated from aliquots of peripheral blood using commercially available column-based kits, following the manufacturer's instructions for use. Quantification of DNA was performed using Qubit dsDNA BR Assay Kit (ThermoFisher, Waltham, MA, United States). DNA samples from both groups were genotyped at the Spanish National Genotyping Center (“Centro Nacional de Genotipado-Fundación Pública Galega de Medicina Xenómica”), using the Axiom™ Spain Biobank array following the manufacturer's instructions for use (Axiom™ 2.0 Assay 96-Array Format Manual Workflow; ThermoFisher Scientific). Briefly, total genomic DNA (200 ng) was amplified and randomly fragmented into 25 to 125 base pair fragments, which were then purified and resuspended in a hybridization cocktail. The hybridization-ready targets were then transferred to the GeneTitan Multichannel Instrument for automated, hands-free processing (including hybridization to Axiom array plates, staining, washing and imaging). CEL files were automatically processed for allele calling using the Axiom GT1 algorithm available through the Axiom Analysis Suite v4.0.3.3 and following the Axiom™ Genotyping Solution Data Analysis User Guide (ThermoFisher Scientific, Waltham, MA, United States).
QUALITY CONTROL AND PRS ANALYSIS
The Axiom Analysis Suite was applied to conduct the quality control of genotyped data. Thresholds applied were DQC ≥ 0.85, and call rate ≥ 97 %. The percent of passing samples was ≥ 95, and the average call rate for passing samples was ≥ 98.5. To assess the existence of stratification and to identify kinship relationships, PCA and IBD analyses were implemented with PLINK software. After that, genotyped data was imputed with TOPMED imputation software. Minor allele frequency (MAF) or Hardy-Weinberg equilibrium (HWE) thresholds were not implemented because of the possibility of losing selected probes from the PRSs databases.
Four different PRSs datasets were computed based upon previous publications. Details for each PRS are shown on table I.
Statistical tests were performed with the R software (version 4.2.1). Moreover, ROC curves were generated with the “pROC” package (10).
RESULTS
Three of the 4 PRSs showed significantly higher scores in the osteoporosis group compared to the control group (PRS-1 p = 1e-7; PRS-2 p = 1.87e-15; PRS-3 p = 0.1477; PRS-4 p = 8.98e-9). Moreover, in those three PRSs with significant differences the individuals from the risk quartile (which corresponds to the first quartile for PRS-2 and upper quartile for PRS-1 and PRS-4) had a significantly higher risk of osteoporosis compared to those individuals from the other quartiles (PRS-1 OR, 1.83 [CI, 1.41-2.36]; PRS-2 OR, 2.11 [CI, 1.64-2.71]; PRS-3 OR, 0.96 [CI, 0.72-1.27]; PRS-4 OR, 1.72 [CI, 1.32-2.21]) (Fig. 1).

Figure 1. Density plots with osteoporotic cases in blue and controls in orange for each PRS tested in the manuscript. The p value is estimated using Student t tests to look for the differences in the mean of each group. Vertical red dot line limits the upper quartile (first quartile for PRS-2), which should have a higher risk of cases. The quartiles are calculated with all samples together, not by group. Moreover, Odds ratio (OR) are estimated from the quartile selected vs the other quartiles.
Furthermore, the frequencies and the probability of disease are shown on figure 2. PRS-1 and PRS-4 have an ascending curve because the higher the score the higher the risk of osteoporosis. PRS-2 values are inversely correlated to osteoporosis because it is associated with heel quantitative speed of sound (SOS) data, which are translated into a higher risk when the scores are more negative. PRS-3 has an almost horizontal regression line due to the non-significant association.
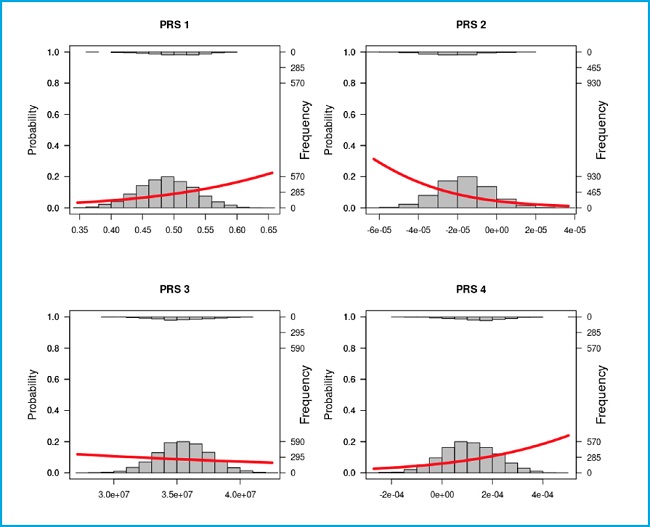
Figure 2. Frequency and linear logistic plots with the controls as zero (the bottom) and the cases as one (the top) for each PRS tested in the manuscript. Left axis is the probability of being control or cases according to the linear logistic regression. Whereas, the right axis shows the frequency of each group in a score range. The X axis scores corresponds to the PRS obtained.
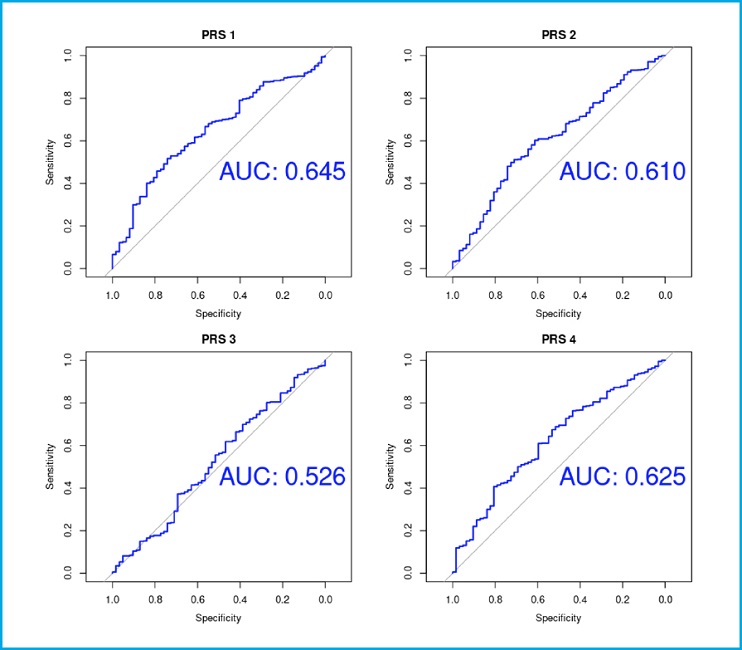
The studied PRSs showed a moderate discriminative capacity, as evidenced by the areas under ROC curves (PRS-1 AUC, 0.645; PRS-2 AUC, 0.61; PRS-3 AUC, 0.526; PRS-4 AUC, 0.625) (Fig. 3).
DISCUSSION
In the present study, we tested four previously published PRSs derived from high-powered GWAS of various osteoporosis-related traits. By comparing the results in a group of patients with osteoporosis and in the control Spanish population, we demonstrate that three of the four PRSs tested are significantly associated with osteoporosis. So, our findings confirm that genetic profiling may help in the identification of osteoporosis, although their discriminative capacity is only moderate and their clinical relevance is still to be demonstrated.
The seminal study conducted by Estrada et al. back in 2012 was the largest GWAS on osteoporosis to that date and identified a total of 63 genetic variants associated with femur neck BMD. They showed that their genetic score predicted the risk of osteoporosis (1.56 odds for osteoporosis of women in the highest bin). The prediction ability was small, with an area under the curve (AUC) of 0.59 with the genetic score alone for osteoporosis (4). In the present study the odds ratio was 1.83 for osteoporosis in the last quartile with an AUC of 0.645 with the genetic score alone. Thus, these results appeared to be somewhat better compared to those from the original study. Hence, this predictive model might be of interest for the Spanish population.
More recently, Forgetta et al. created a PRS model trained with LASSO including 21 717 from a total of 345 111 SNPs significantly associated with ultrasound speed of sound (SOS), which decreased the number of people requiring CRF-FRAX and BMD-FRAX assessments (7). The prediction model, known as gSOS, can improve fracture risk prediction. Thus, a lower gSOS that is related to a lower SOS, was associated to a higher rate of major osteoporotic and hip fractures in European populations (8). The authors showed that the population in the quartile with the lowest gSOS had an odds ratio of 1.68 for major osteoporotic fracture risk and 1.57 for hip fracture. They also demonstrated that gSOS predicts major osteoporotic fracture and hip fracture with an AUC of 0.734 and 0.798, respectively. In our data, people with PRS score in the first quartile had a 2.11-fold risk of osteoporosis and an AUC of 0.61. The AUC is not as high as the one from the reference article. However, we could not use the fractures as a dependent variable because we did not have those data. Hence, our comparisons were not as clean as theirs in terms of the dependent variable.
The UK Biobank project is a noteworthy program that permits to study GWAS data with different phenotypes in a large number of individuals from the UK overall population (11). Thanks to these genetic and phenotypic data, various PRSs have been created. A study conducted by Rivas et al. proposed up to 813 PRSs models to predict over 1500 traits with genetic and phenotypic data from the UK Biobank including 2 PRSs models related to osteoporosis identified as PGS001273 and PGS001274 in the Polygenic Score Catalog (www.pgscatalog.org). Both have been trained with data from more than 260 000 individuals with European ancestry. The first one has been related to ‘osteoporosis' (n = 316 SNPs) whereas the second one is associated with ‘osteoporosis without pathological fracture' (n = 1270). Overall, they have found that the size of the PRS model is related to an increased predictive power. Thus, with the score model, they obtained an AUC of 0.629 and 0.718 in PGS001273 and PGS001274, respectively (9). In our own study, PGS001273 did not show a significant association with osteoporosis. However, the largest PRS (PGS001274) was associated with osteoporosis (OR of the first quartile vs other quartiles 1.72), and a predictive power with an AUC of 0.625.
The heterogeneity between PRSs predictions is based on the heterogeneity between GWAS results, which are possibly different due to the use of distinct variables, outcome measurement, and the ancestry of samples (12). That is the reason why combining the results of the PRS tested does not improve the levels of prediction. For the same reasons, prediction models validated in each of these studies are somewhat better compared to ones obtained from our own data except for the study conducted by Estrada. This might also be associated with the fact that BMD was used as an outcome measure in Estrada's report and in the present study whereas calcaneal ultrasound was used in the UK Biobank-derived studies. Nevertheless, the predictive ability of the PRSs is low and, nowadays, they must be used as a complement for diagnosis with other clinical parameters such as FRAX scores.
This study has several limitations. We included a well-characterized group of individuals with primary osteoporosis of Spanish ancestry. However, our control group obtained from the Spanish DNA biobank is well characterized according to the ancestry, sex and age. However, there are not data regarding clinical bone factors. As a matter of fact, some of them might present osteoporosis, which would decrease the study power. Also, the limited sample size, particularly of the patients' group, limit the statistical power of the study. This, and the lack of data about the controls, precluded the adjustment of the genetic associations by some relevant clinical factors.
In conclusion, several PRSs show significant differences between the overall Spanish population and patients with osteoporosis. This result supports the concept that PRSs may help identify individuals at risk of osteoporosis. Their exact role alone and in combination with other clinical factors remains to be elucidated.

