


Mi SciELO
 Servicios personalizados
Servicios Personalizados
Revista
Articulo
 Inglés (pdf)
 Articulo en XML
 Referencias del artículo
 Enviar articulo por email
Indicadores
-
 Citado por SciELO
 -
 Accesos
Links relacionados
-
 Citado por Google
 -
 Similares en
SciELO
Similares en
SciELO -
 Similares en Google
Compartir

 Permalink
Revista de Psicología del Trabajo y de las Organizaciones
versión On-line ISSN 2174-0534versión impresa ISSN 1576-5962
Rev. psicol. trab. organ. vol.32 no.2 Madrid ago. 2016
https://dx.doi.org/10.1016/j.rpto.2016.02.002
Invisible, therefore isolated: Comparative effects of team virtuality with task virtuality on workplace isolation and work outcomes
Invisible, luego aislado. Efectos comparativos de la virtualidad del equipo y de la tarea en el aislamiento en el trabajo y los resultados laborales
Mehmet A. Orhan, John B. Rijsman and Gerda M. van Dijk
Tilburg University, The Netherlands
ABSTRACT
The new standards of technological and flexible arrangements have made virtual work prevalent for almost everyone in all levels of an organization. Whether in a virtual or traditional setting, current working conditions allow anyone to collaborate, work and interact with others through electronic means of communication, thereby creating a lack of face-to-face contact. Even though the dynamics of virtuality have been widely elaborated at the team level, there are still many unknowns about the impacts of virtuality experienced at an individual level. This paper aims to shed light on the relationship between workplace social isolation, job satisfaction, perceived performance and turnover intention comparing individual responses to team virtuality and task virtuality. Our findings propose that there are statistically significant relations between individual task virtuality, workplace social isolation, satisfaction, perceived performance and turnover intention in organizations. The results also reveal that task virtuality is a better predictor than team virtuality in estimating workplace social isolation and turnover intention.
Key words: Task virtuality. Team virtuality. Workplace isolation. Job satisfaction. Perceived performance. Turnover intention.
RESUMEN
Los nuevos criterios de disposición flexible han conseguido la predominancia del trabajo virtual para casi todos en todos los niveles de la organización. Ya sea en un contexto virtual o en uno tradicional, las actuales condiciones de trabajo permiten que cualquiera colabore, trabaje e interactúe con los demás por medio de sistemas de comunicación electrónicos, lo que da lugar a una falta de contacto cara a cara. A pesar de que la dinámica de la virtualidad se ha elaborado mayormente al nivel de equipo, se desconoce mucho sobre la repercusión de la virtualidad experimentada a un nivel individual. Este trabajo pretende arrojar luz sobre la relación entre aislamiento social en el trabajo, satisfacción laboral, percepción del desempeño e intención de abandono, al comparar respuestas individuales con la virtualidad del equipo y de la tarea. Los resultados apuntan a que hay relaciones estadísticamente significativas entre la virtualidad individual de la tarea, aislamiento social en el trabajo, satisfacción, percepción de desempeño e intención de abandono en las empresas. También los resultados muestran que la virtualidad de la tarea predice mejor que la virtualidad del equipo el nivel de aislamiento social en el trabajo y la intención de abandono.
Palabras clave: Virtualidad de la tarea. Virtualidad del equipo. Aislamiento en el trabajo. Satisfacción laboral. Percepción del desempeño. Intención de abandono.
Technological integration in business has changed workplace dynamics over the last few decades. With the new forms of organizations and sub-units, both jobs and methods of communication have become more dependent on information technology. This shift has resulted in the drastic change of many facets of a variety of jobs in organizations. From an organizational design point of view, more flexible structures such as virtual teams have emerged (Curseu, Schalk, & Wessel, 2008). However, numerous studies on behavioral perspectives have illustrated that greater technology dependence and consequently less face-to-face contact detrimentally impact work-related outcomes (Gibson & Gibbs, 2006; Martins, Gilson, & Maynard, 2004). One recent study reported that jobs at the macro level in Europe have become more monotonous in the face of increasing technology involvement and intensity (Greenan, Kalugina, & Walkowiak, 2014). At the micro level, in virtual settings where the dependency on technology is high and physical face-to-face contact is low, decreased job satisfaction, commitment, and identification as well as increased workplace social and physical isolation have been detected (Bartel, Wrzesniewski, & Wiesenfeld, 2012; Kurland & Egan, 1999; Mulki, Locander, Marshall, Harris, & Hensel, 2008). The evidence from previous studies has also shown that virtuality in teams detrimentally impacts the performance of both the team and the individual (Arling & Subramani, 2011; Lu, Watson-Manheim, Chudoba, & Wynn, 2006; Schweitzer & Duxbury, 2010).
Since the focus of research has shifted from virtual teams to the virtuality in teams, greater attention has been paid to the impacts of virtuality in team settings (Dixon & Panteli, 2010; Hosseini, Zuo, Chileshe, & Baroudi, 2015). By the same token, researchers have started studying the individual and behavioral effects influenced by virtuality (Arling & Subramani, 2011; Orhan, 2014; Suh, Shin, Ahuja, & Kim, 2011). Social support and the need for affiliation are often considered the missing elements in virtual work settings (Wiesenfeld, Raghuram, & Garud, 2001). Kenyon, Lyons, and Rafferty's (2002) study suggested that due to the absence of physical, face-to-face contact, increased virtuality leads to a higher degree of social isolation. These findings are corroborated by the conclusion of Golden, Veiga, and Dino (2008) that there is a negative correlation between isolation and the degree of face-to-face interactions. A recent experiment performed by Bloom, Liang, Roberts, and Ying (2015) revealed that home-office applications, one of the most frequently used flexible working arrangements in organizations, appeared to be increasing individuals' work performance. However, they also reported that working from home caused increased feelings of loneliness and worries that one's performance was not visible. Visibility is a factor that plays a crucial role in both performance and job satisfaction (Allen & Griffeth, 2001). Jobs in virtual settings vary greatly in terms of visibility. In extreme virtuality contingencies, where no physical contact with others takes place, lack of visibility in addition to social, physical, and informational isolation negatively impact work outcomes (Bartel et al., 2012; Mulki & Jaramillo, 2011). As a result, there is a need to distinguish individual exposure to the impacts of virtuality.
The majority of studies relating social isolation to virtuality, however, have focused on interactions within a team. Our knowledge about the impacts of virtuality outside of teams is therefore limited. When studying isolation, emphasis is mostly placed on the individual's interactions with colleagues, supervisors, and team members (Golden et al., 2008). One of the main reasons for this specificity is that virtuality is usually referred to as a team or organizational-level phenomenon. Given the design differences in organizations, the feelings of an employee who has no physical interaction with another person will not be the same as those of one having a certain level of interaction with people outside of the team. However, the nature of interactions beyond team members is often neglected. In contrast to previous studies, we investigated the role of face-to-face interaction with parties that are separate from team members, such as colleagues outside teams, clients, or suppliers.
Theory and Hypotheses
Virtuality and Isolation
It has long been argued that virtuality in teams causes distinct challenges compared to traditional team settings, where co-workers are centralized in one location. One of the most apparent difficulties is the isolation of virtual employees because of the lack of frequent face-to-face contact with team members (Furst, Reeves, Rosen, & Blackburn, 2004; Hertel, Geister, & Konradt, 2005; Kirkman, Rosen, Gibson, Tesluk, & McPherson, 2002; Malhotra, Majchrzak, & Rosen 2007; Mulki et al., 2008; Shachaf, 2008). On the other hand, due to differing approaches and definitions, "virtuality in organizations" is one of the last decade's most highly debated concepts in organization research (Gilson, Maynard, Young, Vartiainen, & Hakonen, 2014). The term "virtuality" is notoriously ambiguous because disagreements still exist as to whether electronic communication, geographic dispersion, or other dimensions make a team more virtual (Schweitzer & Duxbury, 2010). Gibson and Cohen (2003) identified task interdependence as an important charactersitic of virtual teams, thus helping to create a distinction between virtual teams and other groups and network structures that also communicate via information and communication tools (ICT). Task interdependence is defined as "the extent to which an individual needs information, materials and support from others to be able to carry out his or her job" (Vegt, Van de Vliert, & Oosterhof, 2003, p. 717). Depending on the job, different task interdepencies result in a fluctuating mixture of interfaces with others. As a result, the degree of information received face to face or via electronic communication varies as well. The degree is critical from an organizational effectiveness point of view because task interdependence also affects employee performance (Ganesh & Gupta, 2010). Shekhar (2006) proposed a multidimensional virtuality measure that allows all potential technological interfaces with others to be taken into account, including customers, suppliers, and employees; all have an impact on the magnitude of virtuality. While this approach carries its own merits to evaluate virtuality from a broader perspective, it does not fully detect the actual influence of virtuality at the individual level. To illustrate with an example, let us consider a virtual team composed of salespeople working in the field. Since their task is to go out and sell to potential customers in their environment, face-to-face contact is required. Although the team is virtual, the impacts of virtuality will not be felt as heavily as it would be by a telesales representative. On the other hand, a call center agent working in a traditional team setting has more exposure to virtuality because customers are contacted via electronic means of communication. If task interdependence within a team declines, the virtuality of the team becomes a less critical element. Contrarily, if a task becomes more dependent on other parties contacted via communication tools, the virtuality becomes critical. Orhan (2014) introduced the task virtuality concept to address virtuality as a phenomenon that can be experienced by individuals not necessarily belonging to a virtual team. The ultimate determinant of task virtuality relies on the lack of face-to-face communication with all people on whom tasks are dependent. This approach identifies virtuality as a salient characteristic that can be present in all kind of jobs, if the tasks are contingent on non-face-to-face contact regardless if there is a team or another setup. We have therefore focused on the impacts of task virtuality on job outcomes and testing the hypotheses discussed in this section.
The extent of face-to-face interaction has a strong impact on the social support received in the workplace (Marshall, Michaels, & Mulki, 2007; Mulki & Jaramillo, 2011; Wiesenfeld et al., 2001). Especially for virtual workers, lack of face-to-face contact creates threatening conditions that cause isolation in the workplace and subsequently detrimental effects on the well-being of employees (Wiesenfeld et al., 2001). Besides organizational disconnectedness, lack of informal socialization opportunities is found particularly problematic for virtual workers (Kurland & Egan, 1999; Raghuram, Garud, Wiesenfeld, & Gupta, 2001). While increased face-to-face interactions promote individuals' sense of social belongingness (Sacco & Ismail, 2014), lack of social support is associated with feelings of loneliness (Song et al., 2014) and perceptions of isolation (Wiesenfeld et al., 2001). Based on the work of Marshall et al. (2007), workplace social isolation can be defined as a "lack of satisfying friendship relationships or a lack of access to social networks in workplace" (p. 198-199). Although virtual workers are often considered to be "remote workers," very few opportunities for contact with others occur. If a virtual employee sees colleagues every day in the office, even though they are not team members, feelings of social isolation will be considerably less than a home-office virtual worker, who is potentially without any contact whatsoever in the workplace, which is home. As the former carries the opportunities for and access to workplace friendships, the latter completely hinders them. Besides colleagues, direct contact with customers also provides social connections and friendship opportunities. As task virtuality is concerned with who is involved in delivering tasks and how much face-to-face contact is maintained, Hypothesis 1a (H1a) is thus suggested:
H1a. The degree of task virtuality is positively associated with workplace social isolation.
Workplace isolation is believed to be a multidimensional construct (Bartel et al., 2012; Cooper & Kurland, 2002; Marshall et al., 2007). The actual source of workplace isolation is caused by the physical distance. When people are not co-located, it thus follows that they are physically separated. This separation in turn makes coordination and collaboration more challenging. Even though Bartel et al. (2012) recognize physical isolation as the main difficulty of virtual working, they also acknowledge that working remotely with team members does not necessarily signal complete physical isolation as there may still be interactions with others such as suppliers or clients. On the other hand, this does not mean that physical contact with others cannot lead to physical isolation. Co-working spaces and shared offices have become a trend, primarily bringing virtual workers together (Gandini, 2015; Waber, Magnolfi, & Lindsay, 2014). To overcome an individual's sense of being separated, co-working spaces are considered remedies (Garrett, Spreitzer, & Bacevice, 2014). However, research shows that physical isolation may still be experienced when all direct contacts are dispersed and there is no face-to-face contact in terms of performing work-related tasks (Morgan & Symon, 2002). This implies that task virtuality is at its maximum level when there are no face-to-face contacts maintained with those whose informational and relational input is relevant. Thus, the following hypothesis is developed:
H1b. The degree of task virtuality is positively associated with physical isolation.
Another aspect of isolation in the virtual workplace is connected to employee perceptions of missing information and lacking access to key people involved in tasks (Marshall et al., 2007). Curseu et al. (2008, p. 633) propose that "tacit knowledge transfer takes place through direct interactions." The implication is that both knowledge and social context is somehow blurred when working apart, as nonverbal cues are lost during information transfer due to lack of face-to-face interaction (Jong, Schalk, & Curseu, 2008; Wang & Haggerty, 2009). Furthermore, remote team members are often overlooked in reporting and information-sharing chains. Therefore, when individuals are out of sight, they are mostly out of mind, thereby delaying task-related information to arrive, if not skipped entirely (Gajendran & Joshi, 2012; McCloskey & Igbaria, 2003). Golden et al. (2008, p. 1413) stated that "some individuals can feel professionally isolated despite working alongside coworkers." This usually occurs when individuals lack connections and access to resources, resulting in a failure to receive required information. While these implications have an impact on negative social feelings, when task-related information is missing, the likelihood of informational isolation feelings increases. Employees with the least face-to-face contact with others would ultimately feel the highest level of informational isolation, as they are more likely to be kept out of information loops (Rook, 1984; Wiesenfeld, Raghuram, & Garud, 1999) and informal information exchange (Gajendran & Joshi, 2012; Marshall et al., 2007). However, the negative effects are not only felt at the absence of face-to-face contact with team members. When contact with non-team members like customers or suppliers does not take place in person, then the clarity of information is always somewhat skewed; the perception of missing information and restricted access to key people is thus likely to increase. Hence, we suggest H1c to test the relationship between informational isolation and task virtuality:
H1c. The degree of task virtuality is positively associated with informational isolation.
Isolation and Work Outcomes
The levels of social contact and connectedness determine employees' feelings of isolation at work (Wiesenfeld et al., 1999; Wohlwill, 1974). Harrington and Santiago (2006, p. 1) remark that "social isolation occurs because of lack of interaction with people." When working remotely, physical distance and lack of social context cause dissatisfaction (Morgan & Symon, 2002). Hypothesis 2a is to be tested in order to estimate the impact of workplace social isolation on job satisfaction:
H2a. Workplace social isolation has a negative impact on job satisfaction.
Because physical separation reduces interfaces with others and consequently opportunities for making friendships, social isolation increases. Home-office workers often have no opportunities for physical contact with others. While Sims, Szilagyi, and Keller (1976) did not find a direct association between job satisfaction and dealing with others and friendship opportunities, later studies supported that contact with others and friendship opportunities significantly influence satisfaction at work (Levin & Stokes, 1989; Maslach & Jackson, 1981; Morrison, 2004). The relationship between physical isolation and job satisfaction is to be tested through Hypothesis 2b:
H2b. Physical isolation has a negative impact on job satisfaction
Organizational justice theories propose that fair distribution of information among employees is as important as fair distribution of rewards (Colquitt, 2001). This also entails fair access to resources, including information and key contacts. When employees do not have this opportunity, the meaning and joy received from work will diminish identification with the organization and feelings of dissatisfaction may be experienced. To extend the findings of Marshall et al. (2007) and Mulki et al. (2008), Hypothesis 2c will be tested:
H2c. Informational isolation has a negative impact on job satisfaction.
In light of the existing body of literature on work outcomes and overall isolation in the workplace, we also argue that perceived performance is negatively affected by more isolation in the workplace. Previous studies confirm the relationship between isolation and a negatively affected perceived performance (Allen & Griffeth, 2001; Golden et al., 2008). Thus Hypotheses 3a, 3b and 3c are structured as follows:
H3a. Workplace social isolation has a negative impact on perceived performance.
H3b. Physical isolation has a negative impact on perceived performance.
H3c. Informational isolation has a negative impact on perceived performance.
Performance and Satisfaction
One of the most trivial and complicated relationships in the organizational psychology domain is between performance and job satisfaction (Judge, Thoresen, Bono, & Patton, 2001). This complication arises because the directionality is not always easy to determine. However, a significant amount of research suggests that performance follows satisfaction (Judge et al., 2001). According to Ryan and Deci (2000), self-determination theory also argues that individuals inherently possess growth needs, which allow them to continue to perform well, thus further constituting the grounds that lead to higher satisfaction. Moreover, researchers agree on the moderating effects of task characteristics when directionality goes from performance to satisfaction (Brass, 1981; Dubinsky & Skinner, 1984; Hackman & Lawler, 1971). The theory of Hackman and Lawler (1971) suggests that dealing with others creates social belongingness and friendship opportunities at work. Moreover, the social support is required for both relational and informational contexts on the job (Raghuram et al., 2001). When social connectedness is lost, the conditions for accomplishing tasks also disappear (Golden et al., 2008). The underlying assumption is that when individuals feel they perform better, they are more likely to value the outcomes of job, thereby encouraging them to achieve more. As such, the quality of communication at work and the nature of work are perceived as more satisfying because they are supportive for performance. Hypothesis 4 is formulated to test the relationship in the model:
H4. Perceived performance positively affects job satisfaction.
Turnover Intention
The relationship between turnover intention and job satisfaction remains one of the most studied areas in organizational psychology literature. (Tschopp, Grote, & Gerber, 2014). Job satisfaction is considered to be a multidimensional construct composed of different facets (Fila, Paik, Griffeth, & Allen, 2014). Spector (1985) identified various facets that are significantly correlated with turnover intention, which is the best predictor of voluntary quitting behavior (Griffeth, Hom, & Gaertner, 2000). Certainly, the quality of communication is central to job satisfaction (Giri & Kumar, 2010). The lack of non-verbal and para-verbal cues and remote means make communication particularly challenging and consequently more vital in employee engagement (de Jong, Schalk, & Curseu, 2008; Robbins, Judge, Millett, & Boyle, 2013). It is commonly observed in virtual working environments that employees sometimes miss information required to perform tasks (Elron & Vigoda, 2003) and do not receive messages in a clear and timely manner (Walther, 1996). When these conditions occur, the quality of communication is negatively impacted. On the other hand, other conditions harmfully impacting the nature of work cause dissatisfaction, consequently leading to quitting behavior (Swider, Boswell, & Zimmerman, 2011). Individuals performing monotonous jobs often find their roles less interesting and rate them as less satisfying (Chung & Ross, 1977; Fisher, 1993). Considering the implications of increased technology involvement (Greenan et al., 2014) and declined relational ties, coupled with reduced face-to-face contact with others (Massey, Montoya-Weiss, & Hung, 2003), the potential of performing less complex and less interesting jobs becomes quite high. To confirm with the majority of studies testing the relation between job satisfaction and turnover intention, we formulated Hypothesis 5:
H5. The higher the job satisfaction, the lower the intention to leave the organization.
Another predictor of turnover intention is employee performance (Cohen, 1999). Past research examined the directionality of both dimensions' association. When employees show poor performance, negative feelings result in a decision to leave (Jackofsky, 1984). The studies of McEvoy and Cascio (1987) also reveal that while good performers consider staying, poor performers consider leaving, thus confirming the negative association. Thus, Hypothesis 6 is developed to test the same relation:
H6. The lower the perceived performance, the higher the intention to leave the organization.
Further Hypotheses
Given the comprehensive nature of task virtuality, it is further hypothesized that task virtuality is a better predictor than team virtuality in estimating physical isolation (H7), informational isolation (H8), workplace social isolation (H9), job satisfaction (H10), perceived performance (H11), as well as turnover intention (H12).
Two separate models are developed to test hypothesized associations. Figure 1 is the comprehensive conceptual model (Model 1), which integrates the constructs from an overall social isolation point of view. Model 2, on the other hand, tests the dimensional impacts of workplace social isolation, namely the impacts of physical isolation and informational isolation on job satisfaction and perceived performance (Figure 2).
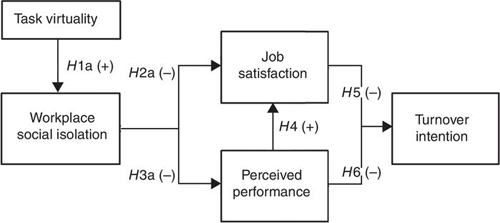
Figure 1. Integrated Conceptual Model (Model 1).
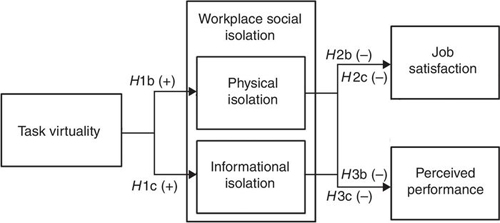
Figure 2. Dimensional Impacts of Workplace Social Isolation (Model 2).
Method
Data Collection and Sample
In this study, the self-reported survey method is used to collect data for the constructs examined. A questionnaire was developed in the English language and prepared over the Internet using the Qualtrics survey tool of the Tilburg School of Humanities. An invitation message was sent to 908 prospective participants in several platforms facilitating convenience and snowball sampling (also known as chain referral sampling) methods. Snowball sampling is considered as an effective method when researching sensitive issues because it enables respondents to provide honest responses as participation requests chain through trusted referrals (Atkinson & Flint, 2001; Biernacki & Waldorf, 1981). In the selection of prospective respondents, we relied on the authors' personal, extended personal, and social networks which targeted employees who work in different organizational settings and asked them to refer to their colleagues to participate. The inclusion criterion solely depended on the employment condition of the participants. In total, 278 respondents completed the survey (response rate = 30.62%). Participants were of 41 different nationalities and reported 33 different countries of their workplaces. The highest frequencies of the participating nationalities, Serbia (74), Belgium (62), Turkey (32), Czech Republic (14), the United States (10), and the United Kingdom (9), composed 72.3% of the entire sample. Other demographic information also asked of respondents included their highest educational attainment, type of organization they work for, role and position in that organization, and duration of service in the current role. Gender and age information were purposely not requested, as these variables were not considered as primarily relevant for the scope of this research. Of the participants, 174 (62.6%) were working for a privately owned company, 39 (14%) for a publicly owned company, 14 (5%) for a non-profit organization, and 43 (15.5%) for a governmental organization/public sector. Eight participants indicated the type of organization as "other." A total of 138 respondents (49.6%) reported that they perform managerial level jobs at the supervisory, departmental, and upper management levels. Participants with at least an undergraduate level of education accounted for 83% of the entire sample. Finally, the average duration of employment was calculated as 61.39 months (> 5years) with a standard deviation of 76.8 months (min = 2 months, max = 300 months).
Measures
In this questionnaire, we asked respondents to evaluate their isolation levels in the workplace, satisfaction levels, self-performance in the current position, and turnover intentions. We further asked for their assessment of to what extent their daily tasks depend on others and how much face-to-face interaction they have with those people. Table 1 exhibits the details of the items for each construct explored.
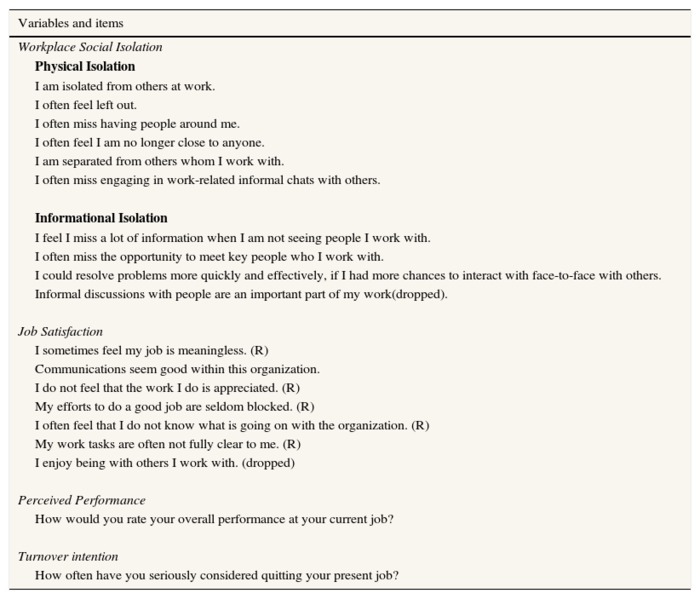
Workplace Social Isolation - Job Satisfaction
To measure overall the workplace social isolation construct, 10 items were selected and adapted from the original 65-item workplace isolation inventory developed by Marshall et al. (2007). Its conceptual development primarily aimed at virtual workers enabled the formation of two sub-dimensions: physical and informational isolation. The physical isolation scale included six items, such as "I am isolated from others at work" and "I often miss having people around me." Respondents indicated their informational isolation based on items such as "I feel I miss a lot of information when I am not seeing people I work with" and "I often miss the opportunity to meet key people whom I work with". One item was dropped because it failed to satisfy the desired loading level (> .60). The reliability (Cronbach's alpha) score for the composite isolation construct was .84. For physical isolation, the score was found to be .89, and .60 for informational isolation.
For the job satisfaction scale, Spector's (1985) Job Satisfaction Survey instrument is used. In particular, items from "nature of work" and "communication" facets are gathered to construct a combined satisfaction score. A seven-item scale is derived to measure the feelings of employees. The reported reliability scores (Cronbach's alpha) for nature of work and communication were .78 and .71, respectively. The combined job satisfaction in our study yielded a reliability score of .80.
The level of agreement for isolation and satisfaction constructs is determined by a six-point Likert-type scale (1 = strongly disagree, 2 = disagree, 3 = somewhat disagree, ... 6 = strongly agree). An especially beneficial merit of using a six-point scale is that it increases the normality pattern in distributions (Leung, 2011). Another advantage of using a six-point scale in this study is to extract participants' feelings explicitly by removing the neutrality option and avoiding it as an escape response (Wakita, Ueshima, & Noguchi, 2012). Previous studies using a six-point scale for determining respondents' agreement level of satisfaction and social isolation include Templer (2012), Zou, Ingram, and Higgins (2015), Jeske and Santuzzi (2015), and Calvete, Orue, and González-Diez (2013).
Turnover Intention - Perceived Performance
For turnover intention and self-rated performance, single items are utilized with five-point scales. The use of single-item measures are accepted as appropriate, especially in the field of organizational behavior psychology, where respondents are asked to rate their feelings and attitudes (Fisher & To, 2012; Tong, 2010). Bergkvist (2015) also argued that with single-item measures, less boredom and quitting behavior was observed. For unidimensional and distinct constructs, such as turnover intention or perceived performance, single-item measures are widely used in the literature (Lambert, Hogan, & Barton, 2001; Sandelands, Brockner, & Glynn, 1988; White & Lehman, 2005). Turnover intention is assessed with the item "How often have you seriously considered quitting your present job?" as suggested by Spector, Dwyer, and Jex (1988). The options for responses were coded as: 1 = never,... 5 = extremely often. Perceived performance is measured with the item asking "How would you rate your overall performance at your current job?" The choices of responses ranged from 1 = poor to 5 = excellent.
Degree of Virtuality (Task and Team Level)
Because there are various approaches to appraising the level of virtuality of a team, it is still a fervently debated topic (Gilson et al., 2014). Although there are contrasting approaches and divergent definitions of virtuality, a common factor of the measurement of this construct is the level of face-to-face interaction among team members, as a proxy of virtuality (Hakonen & Lipponen, 2007). To assess the level of team virtuality, we followed the same approach proposed by Rapp, Ahearne, Mathieu, and Rapp (2010), Maynard, Mathieu, Rapp, and Gilson (2012), and Gajendran and Joshi (2012). The respondents were asked to indicate a percentage of how much face-to-face interaction they have with others. We categorized each group as follows: (1) team members; (2) colleagues, peers, co-workers other than team members; (3) clients, customers; (4) suppliers, business partners; and (5) others. The team virtuality score is determined by subtracting the indicated percentage for face-to-face communication with team members from 100. When an employee had no face-to-face interaction with team members, then the team virtuality score was recorded as 100. Task virtuality is operationalized as put forward by Orhan (2014). It is assessed with respect to the respondents' level of virtual collaboration with the others on whom they depend for completing work-related tasks. To determine the level of task virtuality, respondents were asked to distribute a percentage out of 100 reflecting their interdependence among the five aforementioned categories (the total sum of all categories may not exceed 100%). Based on this scale, the task virtuality score was calculated as the sum of products of interdependence with groups of people and the corresponding non-face-to-face contact level with each group.
The formulas for the calculation of team virtuality and task virtuality scores are as follows:
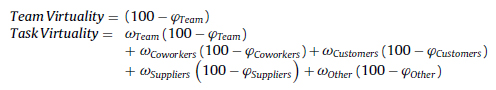
and,

where,
φ indicates the percentage score of the self-reported level of face-to-face interaction ranging [0, 100],
ω indicates the self-reported weight of interdependence ranging [0, 1].
Results
The correlation matrix revealed that task virtuality has a significant correlation with all variables measured in this study at the .01 significance level. Moreover, the directions of relationships demonstrate that the directions of hypothesized models are confirmed. Task virtuality was found significantly and positively correlated with workplace social isolation (r = .30, p < .01), physical isolation (r = .28, p < .01), informational isolation (r = .18, p < .01), and turnover intention (r = .21, p < .01). Negative and significant associations are found between task virtuality and job satisfaction (r = -.19, p < .01) and perceived performance (r = .22, p < .01).
The relationship between team virtuality and task virtuality is also explored in this study. While team virtuality is included after a multiplication with the weighted score in task virtuality calculation, it also has a significant and positive relation with the other (r = .33, p < .01). However, even though it has been previously argued that individual virtuality is a direct result of team virtuality (Suh et al., 2011), Figure 3 shows that the relation is not unidirectional, thus confirming Orhan's (2014) argument. It can therefore be concluded that a causal relationship between team virtuality and task virtuality is not an inevitability. The illustration of scatter plots is imperative in this context because it represents extreme cases, data structures, and variations better than a simple regression method (Anscombe, 1973). Our sample revealed that 155 observations (55.76%) out of 278 are categorized under low-low and high-high combinations of team and task virtuality. The remaining 123 observations (44.24%) are classified either under low team-high task virtuality or high team-low task category. In this study, team virtuality can explain 11% of overall task virtuality for the entire sample (R2 = .103, β = .326, p < .01, n = 278). The explanatory power of team virtuality increases (adj. R2 = .160, β = .408, p < .01) when task virtuality is measured as high (task virtuality score ≥ 50, n = 146). When task virtuality is low (task virtuality score < 50, n = 132), the explanatory power of team virtuality decreases (adj. R2 = .051, β = .242, p < .01).
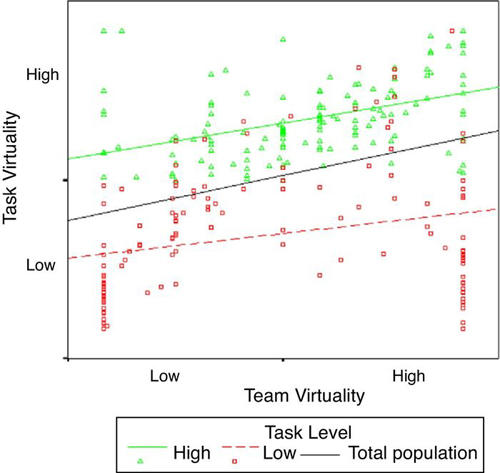
Figure 3. Predicting Task Virtuality with Team Virtuality.
To evaluate the fitness of the model, both confirmatory and exploratory factor analyses are used. After determining the minimum loading criteria as above .60 for all items, both results of confirmatory and exploratory factor analyses are taken into account. Due to poor loadings, one item from the job satisfaction scale and one item from the informational isolation scale are dropped. For Model 1, integrating all dimensions, the calculated chi-square was 91.5, with 33 degrees of freedom (chi-square/df = 2.77). The goodness of fit (GFI) is measured as .94, and comparative fit index (CFI) as .92. The root mean square error of approximation (RMSEA) is .080. For Model 2, the chi-square was measured as 240.3 with 111 degrees of freedom (chi-square/df = 2.16). The GFI score for this model was found to be .91 and CFI was .93. The RMSEA result was .065. Both models indicated an acceptable fit for the testing of the hypotheses. In addition, based on exploratory factor analyses, all loadings found were above .60. The reliability analyses have also shown that workplace isolation, physical isolation, informational isolation, and job satisfaction were acceptable measures. Excluding informational isolation, all Cronbach's alpha measures were over .80. The alpha score computed for the three-item informational isolation scale was slightly over the moderate threshold of .60, which is still acceptable for the model. While larger internal consistency is desired in psychometric measures, the alpha score is still considered adequate when exceeding .60 (Robinson, Shaver, & Wrightsman, 1991). The average variances extracted (AVE) for each construct measured were recorded over .50, thereby indicating that the convergent validities of measures are satisfied (Ward, Fischer, Lam, & Hall, 2009). Further details of descriptive statistics are presented in Table 2.
Table 2. Descriptive Statistics, Correlation Matrix, and Reliability Statistics. 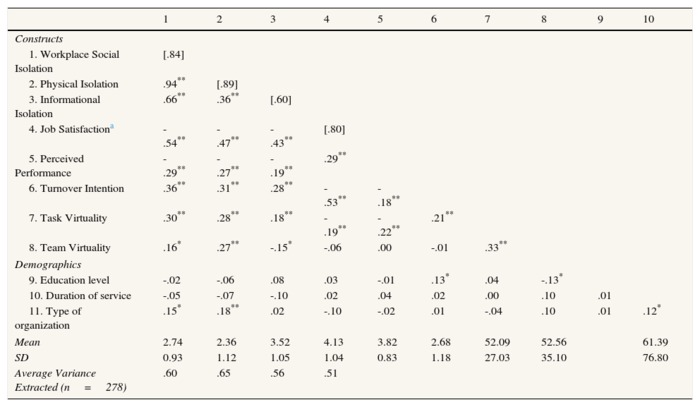
Note. Cronbach's alpha reliability scores are indicated diagonally in brackets.
a - Reverse items on job satisfaction scale are recoded.
*p < .05.
**p < .01.
Structural Equation Models
The direct effects in the model testing integration of task virtuality in respect to workplace social isolation, job satisfaction, perceived performance, and turnover intention are shown in Figure 4. Based on the structural equation model conducted in AMOS 16, the paths have significant direct effects, which support all hypotheses, except for H6. While the expected negative effect between perceived performance and turnover intention is found, the path is not drawn for the model because its significance did not meet the minimum desired level of p < .05. Thus, the model suggested the full mediation of perceived performance. The impact of perceived performance on job satisfaction was significant at the .05 level. The remaining effects were found significant at the .01 level. With this model, turnover intention can be estimated with R2 = .33.
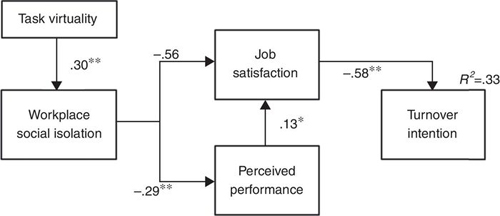
Figure 4. Integrated Structural Equation Model (Model 1).
Note. χ2 = 91.45, df = 33, χ2/df = 2.77, p < .001, GFI = .94,
AGFI = .90, CFI = .92, TLI = .91, RMR = .90, SRMR = .05, RMSEA = .080,
CI90% [0.061- 0.100]. * p < .05, ** p ≤ .01.
Structural equation models (SEM) expose the details of the hypotheses tested in this study. H1a is confirmed, as task virtuality is significantly and positively associated with the effect size of .30 (p < .01). The more task virtuality is experienced, the more isolation will be felt. This, of course, has multiple implications. First, an increase in social isolation in the workplace decreases job satisfaction. This effect is measured with the path coefficient of -.56 (p < .01), thereby supporting H2a. Similarly, social isolation has a negative impact on perceived performance. Validating H3a, the effect size is found to be -.29 (p < .01). Job satisfaction has the highest effect = -.58 (p < .01) in relation to turnover intention. As predicted with H5, satisfied individuals often consider staying on at their current jobs. Though H6 is not supported by the model, further analysis suggests an interesting finding. We conducted a regression to reveal the interactional effect of task virtuality on the relationship between perceived performance and turnover intention. Figure 5 presents the differences in interactional effects of task virtuality on perceived performance-turnover association. For individuals facing low task virtuality (n = 132), perceived performance has a significant and positive effect (r = .29, p < .01). The same association for individuals with high task virtuality (n = 146) cannot be observed (r = .04, p = .65). Pure task virtuality suggests lack of face-to-face interaction with all others that are somehow involved in daily tasks. This directly influences the visibility of individuals. When individuals' performance can be assessed by other parties, higher visibility moderates the relationship between performance and turnover intention (Allen & Griffeth, 2001). Hence, the relationship between perceived performance and turnover intention appears to be as expected in H6 when an individual works in a low task virtuality setting. Conversely, when there are fewer chances for individual performance to be assessed by others, even weaker self-assessments do not influence the intention to leave. More explicitly, since visibility is missing in high task virtuality contexts, the real performances of individuals can be harder to measure or even deceiving. Therefore, even when there is a gap between real performance and perceived performance, individuals can hide this gap due to less visibility. Adversely, it may also imply that high performers can have as much intention to leave as low performers because performance assessments cannot be undertaken easily and objectively when they cannot be observed. Under such circumstances, perceived performance does not influence turnover intention.
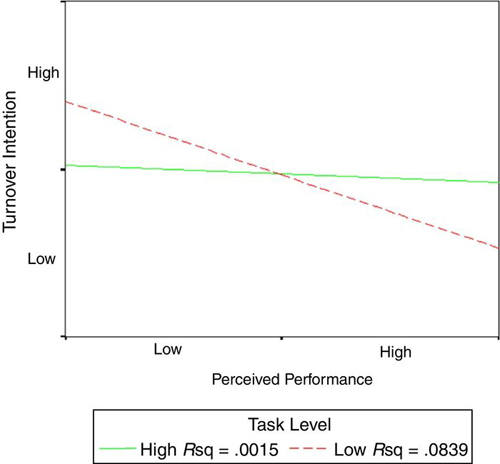
Figure 5. Interaction Effect of Task Virtuality on Perceived Performance
- Turnover Intention Association.
To test the dimensional impacts of social isolation in the workplace, an additional model (Model 2) is tested through assessing path coefficients. Figure 6 represents the structural model diagram. As hypothesized with H1b and H1c, task virtuality is significantly and positively associated with physical isolation (r = .30, p < .01) and informational isolation (r = .26, p < .01). The implication is that individuals working with dispersed contacts lack face-to-face communication. This has an influence not only on an individual's feelings of physical isolation, but also on the exchange of information. Being unable to physically interact with key people at work gives the remote worker the feeling that some information is lost in communication. Information transfer also becomes challenging because individuals feel that information is missing when there is no physical contact with colleagues. As a result, feelings of loneliness and of missing information have a compound set of further impacts. Supporting H2b and H2c, physical isolation and informational isolation decrease job satisfaction, with computed negative effects of .36 and .58, respectively (p < .01). The sense of being left out and not being able to engage in informal chats with others incite adverse feelings and affect job satisfaction (Marshall et al., 2007; Mulki et al., 2008). At the same time, missing opportunities for information exchange exert performance-related issues. Our study results also provide evidence that a lack of social support triggered by physical and informational isolation causes perceived performance to be affected negatively. Participants experiencing the impact of high virtuality indicated that they could perform better if they had more chances to have physical communication opportunities with others. Both H3b and H3c are supported by the data. The effect sizes of physical isolation and informational isolation on performance are found to be .22 and .19 respectively at the .01 significance level, indicating inverse relations. As a result, the model exposes that the higher the task virtuality, the higher the impacts on the sub-dimensions of social isolation in the workplace. These dimensions consequently deter feelings of satisfaction and performance at work.
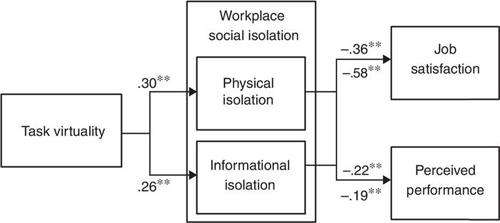
Figure 6. Structural Equation Model for Dimensional Impacts of Workplace Social Isolation (Model 2).
Note. χ2 = 240.33, df = 111, χ2/df = 2.16, p < .001,
GFI = .91, AGFI = .88, CFI = .93, TLI = .90, RMR = .56,
SRMR = .10, RMSEA = .065, CI90% [0.054 - 0.076]. ** p ≤ .01.
Post-Hoc Analyses
To analyze relations further, we continued with post-hoc analyses to test Hypotheses 8-12. First, we conducted a four-step hierarchical regression analysis. Measurement variables are included in the regression equation as independent variables. The second step collated the demographic data. Team virtuality was subsequently added as the next step. In the final step, task virtuality was inserted. The details of the standardized beta coefficients and regression results corresponding to each step are shown in Table 3.
Table 3. Results of Hierarchical Regression Analysis. 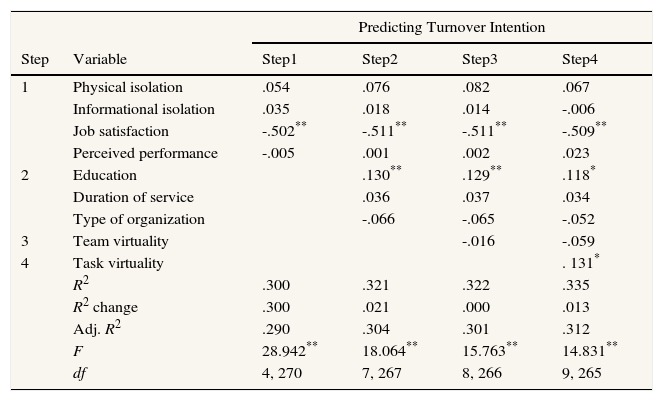
*p < .05. **p < .01.
While in step 1 only the satisfaction variable is significant, education becomes the second independent variable significantly affecting the turnover intent in the following steps. A higher level of education leads to a higher level of intention to leave. In the first step, 29% of the variance of turnover intention is explained. With the introduction of the demographic part of data, the explained variance slightly increases to 30.1%. The highest level of adjusted R2 is obtained when task virtuality is added into the regression. The total explained portion of the variance of turnover intention is recorded as 31.2%.
For assessing predictive capacities of team virtuality and task virtuality, we also employed a two-step hierarchical regression for each construct. In this analysis, team and task virtuality turned into independent variables. In step 1, the direct impacts of team virtuality on the dependent variables (workplace social isolation, physical isolation, informational isolation, job satisfaction, perceived performance and turnover intention) are observed. The results of comparative prediction of team virtuality vs. task virtuality are shown in Table 4.
Table 4. Results of Comparative Prediction of Team Virtuality vs.
Task Virtuality for the Tests of Hypotheses 7-12. 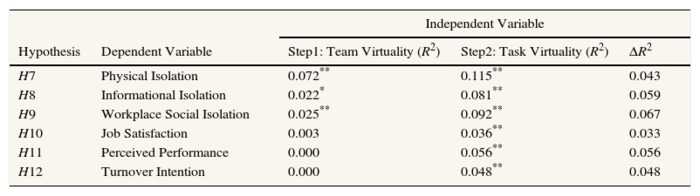
* p < .05, ** p < .01.
According to the results of explained variances for each regression, team virtuality has a significant explanatory power on social isolation and its sub-dimensions. The level of significance for social isolation and physical isolation is .10 and for informational isolation .05. On the other hand, task virtuality appears to be significantly interacting with each dimension. Relating to the hypotheses, the data did not support the claim that task virtuality is a better predictor of physical isolation than team virtuality (H7). Although both effects of team virtuality and task virtuality are significant, the incremental increase in the variance explained when task virtuality (4.3%) was added is smaller than the variance explained by team virtuality (7.2%). On the other hand, H8 is validated as an explained variance of workplace social isolation that increased from 2.5% to 9.2% when the task virtuality variable was inserted. Similarly, for informational isolation, task virtuality was better at predicting: the variance explained rose from 2.2% to 8.1% when task virtuality was added into the regression analysis. H9 is therefore supported by the data. The remaining hypotheses (H10, H11, and H12) are also supported. For job satisfaction, in the first step, no significant explanatory power is provided by team virtuality. The second step increases the explained variance by 5.6% with the addition of the task virtuality variable into the equation. Finally, when team virtuality cannot predict perceived performance and turnover intention, task virtuality manages to explain variances of these variables 5.6% and 4.8%, respectively. Figure 7 also illustrates each regression line for the variables predicted by team and task virtualities.
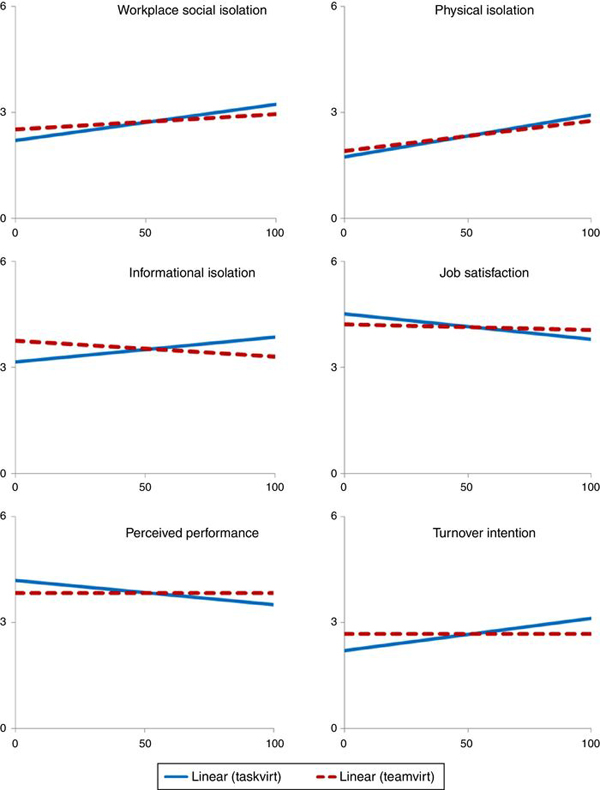
Figure 7. Regression Lines of Team Virtuality vs. Task Virtuality Predicting Study Variables.
To test the effect of each team and task virtualities, mean comparisons were also conducted. Table 5 summarizes the t-test results of differences within groups. Based on these results, team virtuality is significantly associated with physical isolation (p < .01) and overall social isolation in the workplace (p < .05). Task virtuality, on the other hand, is found to significantly impact perceived performance and turnover intention at the .01 level and on the satisfaction, informational, and social isolation levels at work.
Table 5. T-tests Results of Differences within Groups. 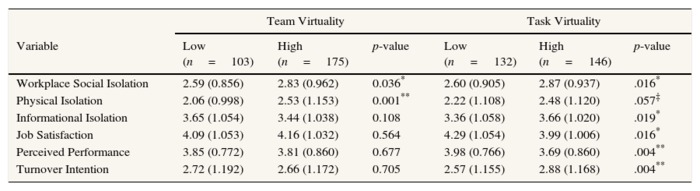
Note. Scores represent means of each variable, and values in parentheses
are standard deviations.‡ p < .10, * p < .05, ** p < .01.
In Figure 8, we visualize the categorical distinction of team virtuality and task virtuality. For each individual, two score pairs of team and task virtualities are positioned. Based on these pairs, we determined each individual's category representing virtuality composition. Four categories were generated. The first category is comprised of individuals with low team virtuality and low task virtuality (Low Team Low Task). The second category covered individuals with high team virtuality and low task virtuality (High Team Low Task). In the third category, we covered employees experiencing low team virtuality but high task virtuality (Low Team High Task). The last category contained the data with high team virtuality coupled with high task virtuality (High Team High Task). According to this distinction, we found 56 people in the Low Team Low Task category, 76 people in the High Team LowT ask category, 47 people in the Low Team High Task category, and 99 people in the High Team High Task category.
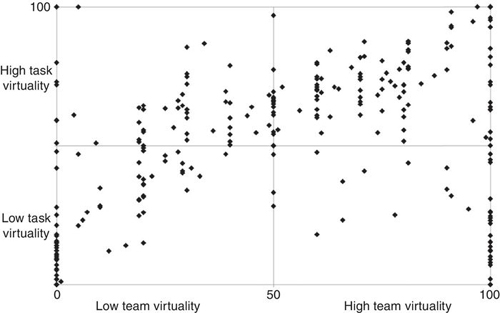
Figure 8. Mapping Team Virtuality vs. Task Virtuality.
In Table 6, the descriptive nature of variables for each category and analysis of variance (ANOVA) results are provided. The significant levels of pairwise comparisons are determined using the Scheffe and Games-Howell tests, where appropriate. The Games-Howell test shows robustness when unequal sample sizes are in place and the assumption of homogeneity of variance does not hold (Toothaker, 1993). When sample variances are regarded as homogeneous, Scheffe tests are taken into consideration.
Table 6. One-way ANOVA Test Results of Differences between Groups. 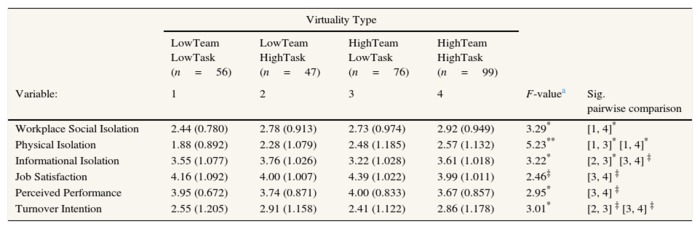
a - df = 3, 274 ‡ p < .10, * p < .05, ** p < .01.
The lowest social isolation score belongs to the first category that experiences low team-low task virtuality. The significant difference is found between the high team-high task virtuality group (F = 3.29, p ≤ .05). For physical isolation, the differences are found to be significant as well. Again, the lowest physical isolation is felt by people categorized in the Low Team Low Task (F = 5.23, p ≤ .01). For both physical and social isolation constructs, individuals working in the high team-high task virtuality context felt loneliness the strongest. For the informational isolation construct, team virtuality appeared irrelevant because even people with low team virtuality felt high informational isolation, because the highest informational isolation is observed in groups with high task virtuality (F = 3.22, p ≤ .05). The results of pairwise comparison for job satisfaction and perceived performance yielded meaningful differences as well. The least satisfied and lowest rated performance observed in the group occurred when both team and task virtualities measured high. F-test measured for satisfaction is 2.46 (p ≤ .1), and for perceived performance is 2.95 (p ≤ .05). Significant differences are found within teams scoring high in team virtuality. When task virtuality is also high, given there is high team virtuality, employees feel significantly less satisfied and that they perform worse as compared to individuals with less task virtuality but with high team virtuality.
Discussion
Our models have resulted in a number of important personal and work-related outcomes by presenting empirical evidence as to how task virtuality triggers feelings of isolation in the workplace. The results of this study revealed that individual exposure to virtual tasks, which require interaction and interdependence with people in a face-to-face manner, determines the level of isolation at work. In alignment with the findings of previous studies (Golden et al., 2008; Mulki et al., 2008; Wiesenfeld et al., 1999), it has been demonstrated that increased face-to-face interaction is associated with lower degrees of isolation. On the other hand, in contrast to previous studies, our results have shown that a higher level of face-to-face interaction with team members only is not enough to explain isolation. Face-to-face interactions with all others, who have a direct impact on performance and whose input is required, are found significantly correlated with social, physical, and informational isolation at work. For example, for a salesperson, being able to interact with clients in person can mean a great deal more than meeting with team members. Clients possess more useful information than team members and thus can make a difference in a salesperson's performance. It is very difficult to predict which products should be offered and what the needs/wants/expectations of the client are when there is no face-to-face interaction. Although individual experience varies between employees, our study has nevertheless identified solid patterns: when individuals interact physically with those who are important for their tasks, they feel a sense of belongingness, receive social support, and find friendship opportunities (Morrison, 2004; Mulki & Jaramillo, 2011; Wiesenfeld et al., 2001). When employees are physically separated from others, they sense that they lack the resources necessary for performing tasks, lose the shared social context (Cramton, 2001), and feel socially isolated (Levin & Stokes, 1989; Maslach & Jackson, 1981; Rook, 1984;). As a result, both meaning and pleasure obtained from a job and strong work performance are positively influenced, as discussed by Golden et al. (2008). It can thus be concluded that more satisfied employees prefer to stay with an organization, while those who are dissatisfied are more likely to choose to leave.
Published results in relation to the impacts of virtuality are infamously contradictory. From organizational and behavioral standpoints, in particular, the conclusions of studies vary enormously (Gilson et al., 2014). This is not a coincidence. Because the root causes of how virtuality influences individual feelings, perceptions and attitudes in organizations have not been taken into consideration, there can be very little consensus about team virtuality. Our study shows that the impacts of team virtuality do not reflect an individual's feelings and attitudes in a one-to-one manner. In essence, virtuality of a team is concerned with the virtual work performed collectively with team members. With this study, however, the empirical evidence has reinforced the outlined concept of task virtuality as a valid phenomenon. This implies that team members are only a part of a larger community that employees work with. The experiences with virtuality may not be purely dependent on the level of team interactions. In contrast, lack of face-to-face interaction with others may complicate jobs and daily tasks of individuals and create conditions that could be considered challenges if they occur in teams. Therefore, when assessing virtuality, team virtuality remains a vague concept, maybe even irrelevant. If team members have little or no interdependence, then the virtuality of a team may not influence the variables explored in the literature. Task virtuality comprises overall exposure to the lack of face-to-face communication with all others concerned, not only team members (Orhan, 2014). It thus takes into account the impact of other players who have a stake in the tasks and in the jobs performed. Task virtuality as opposed to team virtuality allows the researcher to conceptualize the real implications and exposures to working conditions that involve electronic communication or geographical dispersion, or both. The contribution of our study is that virtual work with all others associated with the task can be tested via the proposed task virtuality measure. Specifically, this study distinguishes task virtuality from individual impacts of team virtuality and identifies it as a separate measure that allows for more accurate comparisons and contrasts of different virtuality conditions of individuals.
Limitations and Direction for Further Research
This study, as many others, comes with limitations. The first suggestion for further research is to improve the interpretation of the results through comparison with alternative study designs. As the aim of this study was to measure organizational-psychological feelings, perceptions, and attitudes, our design that relied on self-reports can be regarded appropriate (Spector, 2006). Nonetheless, there could be a need to cross-check self-reported scores versus (actual) peer/supervisor-rated scores particularly for task virtuality/team virtuality and performance components. This cross-checking would enhance the validity of further studies, as well as the results of this study. On the other hand, to address the common method variance issue, the Harman's single-factor test is performed. Based on this test, results have indicated that the common method variance was not an issue, as total variance explained remained at 32.85%. Another limitation worth mentioning is the unequal sample sizes across different categories identified in this study. Even though significant differences are found between different types of virtuality combinations, the nature of sampling had an impact on equal variance assumptions and related tests of ANOVA comparisons. Researchers can bear the categorical combination of virtuality types in mind so that the data collection can be made under different conditions in order to collect a more representative sample size in all categories; therefore, clustered sampling may be the most appropriate means to test the differences between groups. On the other hand, the advantage of the sampling methods used in this study can be seen as a factor that improves the generalizability of findings in various organizations. In fact, one of the purposes of the introduction of the task virtuality measure is that it enables a comparison with individual impacts of virtual work, although individuals are not necessarily the members of a virtual team.
As previously discussed in this study, co-working spaces and shared offices have become an increasingly common practice for virtual workers (Gandini, 2015; Waber et al., 2014), and they are considered a mechanism that can resolve the isolation problem of virtual workers (Garrett et al., 2014). On the other hand, our study only measured work-related interactions, so the interactions with individuals out of the work scope have been neglected. Co-working spaces and shared offices are interesting avenues to explore the isolation levels of individuals by comparing task virtualities versus non-work-related face-to-face interactions. Although research verified the impacts of (lack of) work-related face-to-face interactions on physical isolation (Morgan & Symon, 2002), the impacts of non-work-related face-to-face interactions are as of yet unclear.
Future studies are necessary for validating the exclusive findings of this study and are therefore strongly encouraged. Thus far, researchers investigated a series of relations affected by team virtuality. As such, only intra-team interactions have been measured for the individual impacts of the virtuality construct. Conversely, this study may propose as an alternative the measuring of overall virtuality that is linked to tasks. Thus, future research could consider using the task virtuality concept to replicate and validate previously studied and preconceived correlations that have already been found idiosyncratic to team virtuality.
Practical and Managerial Implications
This study also posits highly relevant and crucial insights for managers and organizational designers. Virtual working is generally perceived as inherent only to virtual teams. Nevertheless, this study presents a case that virtual team members performing tasks that do not require electronic communication, but necessitate face-to-face interactions with others (e.g., virtual salespeople interacting with clients) may feel less isolated even though they are virtual team members. On the other hand, traditional team members can still perform tasks that require virtual coordination or collaboration (e.g., call center agents) that can cause higher levels of isolation at work, even when co-located in the same space with other team members. Managers often ignore the implications and challenges of virtuality when employees are not working in virtual teams. However, this study shows the importance of task virtuality, which influences a number of important factors behind a desire to resign. The implication is that not only are employees in virtual teams impacted by virtuality, but also employees in traditional settings who perform virtual tasks.
In order to manage virtuality effectively, Maznevski and Chudoba (2000) highlighted the crucial role played by face-to-face meetings. Curseu et al. (2008) noted that physical, face-to-face encounters lead to the development of interpersonal trust. Interestingly, however, a significant number of employees at present perform tasks with people that they never meet. If the interdependence between those two parties is higher, then the difficulty in performing virtual tasks increases. As a result, higher isolation and increased feelings of being deprived of information and access to key people affect satisfaction received and performance shown. For effective functioning, virtual employees require specifically designed training that teaches them to overcome communication issues when they are not able to have physical interactions (Malhotra et al., 2007; Warkentin & Beranek, 1999). Likewise, the management of traditional employees, especially if they have restricted face-to-face interactions with others, should also provide training. Rosen, Furst, and Blackburn (2006) concluded that there is an acute need for effective training programs particularly for virtual settings, as the skills required to perform in such an environment can differ vastly. Consequently, these skills need to be acquired by those who encounter the challenges of virtual work, no matter how their teams are designed (i.e., virtual or traditional).
Results show that the least social and physical isolation are experienced by those who have the most frequent face-to-face interaction with others (respondents categorized in Low Team Low Task), while the highest social and physical isolation are experienced by people with high team virtuality - high task virtuality (respondents categorized in High Team High Task). This group of people also perceived the least satisfaction and least self-performance. Thus, for managers, being able to offer social support and to create conditions that could increase identification to goals and organizations carries more importance for those highly isolated employees. In the end, turnover decisions are dependent on the factors that are explored in this study.
Conflict of Interest
The authors of this article declare no conflict of interest.
References
1. Allen, D. G., & Griffeth, R. W. (2001). Test of a mediated performance-turnover relationship highlighting the moderating roles of visibility and reward contingency. Journal of Applied Psychology, 86, 1014-1021. [ Links ]
2. Anscombe, F. J. (1973). Graphs in statistical analysis. The American Statistician, 27, 17-21. [ Links ]
3. Arling, P. A., & Subramani, M. (2011). The effect of virtuality on individual network centrality and performance in on-going, distributed teams. International Journal of Internet and Enterprise Management, 7, 325-348. [ Links ]
4. Atkinson, R., & Flint, J. (2001). Accessing hidden and hard-to-reach populations: Snowball research strategies. Social Research Update, 33(1), 1-4. [ Links ]
5. Bartel, C. A., Wrzesniewski, A., & Wiesenfeld, B. M. (2012). Knowing where you stand: Physical isolation, perceived respect, and organizational identification among virtual employees. Organization Science, 23, 743-757. [ Links ]
6. Bergkvist, L. (2015). Appropriate use of single-item measures is here to stay. Marketing Letters, 26, 245-255. http://dx.doi.org/10.1007/s11002-014-9325-y. [ Links ]
7. Biernacki, P., & Waldorf, D. (1981). Snowball sampling: Problems and techniques of chain referral sampling. Sociological Methods & Research, 10, 141-163. [ Links ]
8. Bloom, N., Liang, J., Roberts, J., & Ying, Z. J. (2015). Does working from home work? Evidence from a Chinese experiment. The Quarterly Journal of Economics, 130, 165-218. [ Links ]
9. Brass, D. J. (1981). Structural relationships, job characteristics, and worker satisfaction and performance. Administrative Science Quarterly, 26, 331-348. [ Links ]
10. Calvete, E., Orue, I., & González-Diez, Z. (2013). An examination of the structure and stability of early maladaptive schemas by means of the Young Schema Questionnaire-3. European Journal of Psychological Assessment, 29, 283-290. [ Links ]
11. Chung, K. H., & Ross, M. F. (1977). Differences in motivational properties between job enlargement and job enrichment. Academy of Management Review, 2, 113-122. [ Links ]
12. Cohen, A. (1999). Turnover among professionals: A longitudinal study of American lawyers. Human Resource Management, 38, 61-76. [ Links ]
13. Colquitt, J. A. (2001). On the dimensionality of organizational justice: A construct validation of a measure. Journal of Applied Psychology, 86, 386-400. [ Links ]
14. Cooper, C. D., & Kurland, N. B. (2002). Telecommuting, professional isolation, and employee development in public and private organizations. Journal of Organizational Behavior, 23, 511-532. [ Links ]
15. Cramton, C. D. (2001). The mutual knowledge problem and its consequences for dispersed collaboration. Organization Science, 12, 346-371. [ Links ]
16. Curseu, P. L., Schalk, R., & Wessel, I. (2008). How do virtual teams process information? A literature review and implications for management. Journal of Managerial Psychology, 23, 628-652. [ Links ]
17. de Jong, R., Schalk, R., & Curseu, P. L. (2008). Virtual communicating, conflicts and performance in teams. Team Performance Management. An International Journal, 14, 364-380. [ Links ]
18. Dixon, K. R., & Panteli, N. (2010). From virtual teams to virtuality in teams. Human Relations., 63, 1177-1197. [ Links ]
19. Dubinsky, A. J., & Skinner, S. J. (1984). Impact of job characteristics on retail salespeople's reactions to their jobs. Journal of Retailing, 60(2), 35-62. [ Links ]
20. Elron, E. & Vigoda, E. (2003). Influence and political processes in virtual teams. In C. B. Gibson, & S. G. Cohen (Eds.), Virtual Teams That Work. (pp. 317-334). San Francisco, CA: Jossey-Bass. [ Links ]
21. Fila, M. J., Paik, L. S., Griffeth, R. W., & Allen, D. (2014). Disaggregating job satisfaction: Effects of perceived demands, control, and support. Journal of Business and Psychology, 29, 639-649. [ Links ]
22. Fisher, C. D. (1993). Boredom at work: A neglected concept. Human Relations, 46, 395-417. [ Links ]
23. Fisher, C. D., & To, M. L. (2012). Using experience sampling methodology in organizational behavior. Journal of Organizational Behavior, 33, 865-877. [ Links ]
24. Furst, S. A., Reeves, M., Rosen, B., & Blackburn, R. S. (2004). Managing the life cycle of virtual teams. The Academy of Management Executive, 18(2), 6-20. [ Links ]
25. Gajendran, R. S., & Joshi, A. (2012). Innovation in globally distributed teams: The role of LMX, communication frequency, and member influence on team decisions. Journal of Applied Psychology, 97, 1252-1261. [ Links ]
26. Gandini, A. (2015). The rise of coworking spaces: A literature review. Ephemera, 15, 193-205. [ Links ]
27. Ganesh, M. P., & Gupta, M. (2010). Impact of virtualness and task interdependence on extra-role performance in software development teams. Team Performance Management, 16, 169-186. [ Links ]
28. Garrett, L. E., Spreitzer, G. M., & Bacevice, P. A. (2014). Co-constructing a sense of community in coworking spaces. Academy of Management Annual Meeting Proceedings, 1015-1020, doi: 10.5465/AMBPP. 2014.139. [ Links ]
29. Gibson, C. B., & Cohen, S. G. (2003). Virtual teams that work: Creating conditions for virtual team effectiveness. San Francisco: Jossey-Bass. [ Links ]
30. Gibson, C. B., & Gibbs, J. L. (2006). Unpacking the concept of virtuality: The effects of geographic dispersion, electronic dependence, dynamic structure, and national diversity on team innovation. Administrative Science Quarterly, 51, 451-495. [ Links ]
31. Gilson, L. L., Maynard, M. T., Young, N. C. J., Vartiainen, M., & Hakonen, M. (2014). Virtual Teams Research 10 Years, 10 Themes, and 10 Opportunities. Journal of Management, 41, 1313-1337. [ Links ]
32. Giri, V. N., & Kumar, B. P. (2010). Assessing the impact of organizational communication on job satisfaction and job performance. Psychological Studies, 55, 137-143. [ Links ]
33. Golden, T. D., Veiga, J. F., & Dino, R. N. (2008). The impact of professional isolation on teleworker job performance and turnover intentions: does time spent teleworking, interacting fact-to-face, or having access to communication-enhancing technology matter? Journal of Applied Psychology, 93, 1412-1421. [ Links ]
34. Greenan, N., Kalugina, E., & Walkowiak, E. (2014). Has the quality of working life improved in the EU-15 between 1995 and 2005? Industrial and Corporate Change, 23, 399-428. [ Links ]
35. Griffeth, R. W., Hom, P. W., & Gaertner, S. (2000). A meta-analysis of antecedents and correlates of employee turnover: Update, moderator tests, and research implications for the next millennium. Journal of Management, 26, 463-488. [ Links ]
36. Hackman, J. R., & Lawler, E. E. (1971). Employee reactions to job characteristics. Journal Of Applied Psychology, 55, 259-286. [ Links ]
37. Hakonen, M., & Lipponen, J. (2007). Antecedents and consequences of identification with virtual teams: Structural characteristics and justice concerns. The Journal of E-working, 1, 137-153. [ Links ]
38. Harrington, S., & Santiago, J. (2006). Organisational culture and telecommuters quality of work life and professional isolation. Communications of the IIMA, 6(3), 1-10. [ Links ]
39. Hertel, G., Geister, S., & Konradt, U. (2005). Managing virtual teams: A review of current empirical research. Human Resource Management Review, 15, 69-95. [ Links ]
40. Hosseini, M. R., Zuo, J., Chileshe, N., & Baroudi, B. (2015). Evaluating virtuality in teams: A conceptual model. Technology Analysis & Strategic Management, 27, 385-404. [ Links ]
41. Jackofsky, E. F. (1984). Turnover and job performance: An integrated process model. Academy of Management Review, 9, 74-83. [ Links ]
42. Jeske, D., & Santuzzi, A. M. (2015). Monitoring what and how: psychological implications of electronic performance monitoring. New Technology, Work and Employment, 30, 62-78. [ Links ]
43. Judge, T. A., Thoresen, C. J., Bono, J. E., & Patton, G. K. (2001). The job satisfaction-job performance relationship: A qualitative and quantitative review. Psychological Bulletin, 127, 376-407. [ Links ]
44. Kenyon, S., Lyons, G., & Rafferty, J. (2002). Transport and social exclusion: investigating the possibility of promoting inclusion through virtual mobility. Journal of Transport Geography, 10, 207-219. [ Links ]
45. Kirkman, B. L., Rosen, B., Gibson, C. B., Tesluk, P. E., & McPherson, S. O. (2002). Five challenges to virtual team success: lessons from Sabre, Inc. The Academy of Management Executive, 16(3), 67-79. [ Links ]
46. Kurland, N. B., & Egan, T. D. (1999). Telecommuting: Justice and control in the virtual organization. Organization Science, 10, 500-513. [ Links ]
47. Lambert, E. G., Hogan, N. L., & Barton, S. M. (2001). The impact of job satisfaction on turnover intent: a test of a structural measurement model using a national sample of workers. The Social Science Journal, 38, 233-250. [ Links ]
48. Leung, S. O. (2011). A comparison of psychometric properties and normality in 4-, 5-, 6-, and 11-point Likert scales. Journal of Social Service Research, 37, 412-421. [ Links ]
49. Levin, I., & Stokes, J. P. (1989). Disposition approach to job satisfaction: Role of negative affectivity. Journal of. Applied Psychology, 74, 752-758. [ Links ]
50. Lu, M., Watson-Manheim, M. B., Chudoba, K. M., & Wynn, E. (2006). Virtuality and team performance: Understanding the impact of variety of practices. Journal of Global Information Technology Management, 9, 4-23. [ Links ]
51. Malhotra, A., Majchrzak, A., & Rosen, B. (2007). Leading virtual teams. The Academy of Management Perspectives, 21, 60-70. [ Links ]
52. Marshall, G. W., Michaels, C. E., & Mulki, J. P. (2007). Workplace isolation: Exploring the construct and its measurement. Psychology & Marketing, 24, 195-223. [ Links ]
53. Martins, L. L., Gilson, L. L., & Maynard, M. T. (2004). Virtual teams: What do we know and where do we go from here? Journal of Management, 30, 805-835. [ Links ]
54. Maslach, C., & Jackson, S. E. (1981). The measurement of experienced burnout. Journal of Organizational Behavior, 2, 99-113. [ Links ]
55. Massey, A. P., Montoya-Weiss, M. M., & Hung, Y. T. (2003). Because time matters: Temporal coordination in global virtual project teams. Journal of Management Information Systems, 19(4), 129-155. [ Links ]
56. Maynard, M. T., Mathieu, J. E., Rapp, T. L., & Gilson, L. L. (2012). Something(s) old and something(s) new: Modeling drivers of global virtual team effectiveness. Journal of Organizational Behavior, 33, 342-365. [ Links ]
57. Maznevski, M. L., & Chudoba, K. M. (2000). Bridging space over time: Global virtual team dynamics and effectiveness. Organization Science, 11, 473-492. [ Links ]
58. McCloskey, D. W., & Igbaria, M. (2003). Does "out of sight" mean "out of mind"? An empirical investigation of the career advancements prospects of virtual workers. Information Resources Management Journal, 16(2), 19-34. [ Links ]
59. McEvoy, G. M., & Cascio, W. F. (1987). Do good or poor performers leave? A metaanalysis of the relationship between performance and turnover. Academy of Management Journal, 30, 744-762. [ Links ]
60. Morgan, S. J., & Symon, G. (2002). Computer-mediated communication and remote management. Social Science Computer Review, 20, 302-311. [ Links ]
61. Morrison, R. (2004). Informal relationships in the workplace: Associations with job satisfaction, organizational commitment and turnover intentions. New Zealand Journal of Psychology, 33(3), 114-128. [ Links ]
62. Mulki, J. P., & Jaramillo, F. (2011). Workplace isolation: salespeople and supervisors in USA. The International Journal of Human Resource Management, 22, 902-923. [ Links ]
63. Mulki, J. P., Locander, W. B., Marshall, G. W., Harris, E. G., & Hensel, J. (2008). Workplace isolation, salesperson commitment, and job performance. Journal of Personal Selling & Sales Management, 28, 67-78. [ Links ]
64. Orhan, M. A. (2014). Extending the individual level of virtuality: Implications of task virtuality in virtual and traditional settings. Administrative Sciences., 4, 400-412. [ Links ]
65. Raghuram, S., Garud, R., Wiesenfeld, B., & Gupta, V. (2001). Factors contributing to virtual work adjustment. Journal of Management, 27, 383-405. [ Links ]
66. Rapp, A., Ahearne, M., Mathieu, J., & Rapp, T. (2010). Managing sales teams in a virtual environment. International Journal of Research in Marketing, 27, 213-224. [ Links ]
67. Robbins, S., Judge, T. A., Millett, B., & Boyle, M. (2013). Organisational behavior (7th ed.). Pearson Higher Education AU. [ Links ]
68. Robinson, J. P., Shaver, P. R., & Wrightsman, L. S. (1991). Criteria for scale selection and evaluation. In J. P. Robinson, P. R. Shaver, & L. S. Wrightsman (Eds.), Measures of Personality and Social Psychological Attitudes. (pp. 1-16). New York: Academic Press. [ Links ]
69. Rook, K. S. (1984). Research on social support, loneliness, and social isolation: Toward an integration. Review of Personality and Social Psychology, 5, 239-264. [ Links ]
70. Rosen, B., Furst, S., & Blackburn, R. (2006). Training for virtual teams: An investigation of current practices and future needs. Human Resource Management, 45, 229-247. [ Links ]
71. Ryan, R. M., & Deci, E. L. (2000). Self-determination theory and the facilitation of intrinsic motivation, social development, and well-being. American Psychologist, 55, 68-78. [ Links ]
72. Sacco, D. F., & Ismail, M. M. (2014). Social belongingness satisfaction as a function of interaction medium: Face-to-face interactions facilitate greater social belonging and interaction enjoyment compared to instant messaging. Computers in Human Behavior, 36, 359-364. [ Links ]
73. Sandelands, L. E., Brockner, J., & Glynn, M. A. (1988). If at first you don't succeed, try, try again: Effects of persistence-performance contingencies, ego involvement, and self-esteem on task persistence, Journal of Applied Psychology, 73, 208-216. [ Links ]
74. Schweitzer, L., & Duxbury, L. (2010). Conceptualizing and measuring the virtuality of teams. Information Systems Journal, 20, 267-295. [ Links ]
75. Shachaf, P. (2008). Cultural diversity and information and communication technology impacts on global virtual teams: An exploratory study. Information & Management, 45, 131-142. [ Links ]
76. Shekhar, S. (2006). Understanding the virtuality of virtual organizations. Leadership & Organization Development Journal, 27, 465-483. [ Links ]
77. Sims, H. R., Szilagyi, A. D., & Keller, R. T. (1976). The measurement of job characteristics. Academy of Management Journal, 19, 195-212. [ Links ]
78. Song, H., Zmyslinski-Seelig, A., Kim, J., Drent, A., Victor, A., Omori, K., & Allen, M. (2014). Does Facebook make you lonely?: A meta analysis. Computers in Human Behavior, 36, 446-452. [ Links ]
79. Spector, P. E. (1985). Development of job satisfaction survey. American Journal of Community Psychology, 13, 693-713. [ Links ]
80. Spector, P. E. (2006). Method variance in organizational research truth or urban legend? Organizational Research Methods, 9, 221-232. [ Links ]
81. Spector, P. E., Dwyer, D. J., & Jex, S. M. (1988). Relation of job stressors to affective, health, and performance outcomes: A comparison of multiple data sources. Journal of Applied Psychology, 73, 11-19. [ Links ]
82. Suh, A., Shin, K., Ahuja, M., & Kim, M. S. (2011). The influence of virtuality on social networks within and across work groups: A multilevel approach. Journal of Management Information Systems, 28, 351-386. [ Links ]
83. Swider, B. W., Boswell, W. R., & Zimmerman, R. D. (2011). Examining the job search-turnover relationship: The role of embeddedness, job satisfaction, and available alternatives. Journal of Applied Psychology, 96, 432-441. [ Links ]
84. Templer, K. J. (2012). Five-factor model of personality and job satisfaction: The importance of agreeableness in a tight and collectivistic Asian society. Applied Psychology, 61, 114-129. [ Links ]
85. Tong, E. M. (2010). The sufficiency and necessity of appraisals for negative emotions. Cognition and Emotion, 24, 692-701. [ Links ]
86. Toothaker, L. E. (1993). Multiple Comparison Procedures. Sage University Paper Series on Quantitative Applications in the Social Sciences (07-089). Newbury Park, CA: Sage Publications. [ Links ]
87. Tschopp, C., Grote, G., & Gerber, M. (2014). How career orientation shapes the job satisfaction-turnover intention link. Journal of Organizational Behavior, 35, 151-171. [ Links ]
88. Van der Vegt, G. S., Van de Vliert, E., & Oosterhof, A. (2003). Informational dissimilarity and organizational citizenship behavior: The role of intrateam interdependence and team identification. Academy of Management Journal, 46, 715-727. [ Links ]
89. Waber, B., Magnolfi, J., & Lindsay, G. (2014). Workspaces that move people. Harvard Business Review, 92(10), 68-77. [ Links ]
90. Wakita, T., Ueshima, N., & Noguchi, H. (2012). Psychological distance between categories in the Likert scale comparing different numbers of options. Educational and Psychological Measurement, 72, 533-546. [ Links ]
91. Walther, J. B. (1996). Computer-mediated communication impersonal, interpersonal, and hyperpersonal interaction. Communication Research, 23, 3-43. [ Links ]
92. Wang, Y., & Haggerty, N. (2009). Knowledge transfer in virtual settings: The role of individual virtual competency. Information Systems Journal, 19, 571-593. [ Links ]
93. Ward, C., Fischer, R., Lam, F. S. Z., & Hall, L. (2008). The convergent, discriminant, and incremental validity of scores on a self-report measure of cultural intelligence. Educational and Psychological Measurement, 69, 85-105. [ Links ]
94. Warkentin, M., & Beranek, P. M. (1999). Training to improve virtual team communication. Information Systems Journal, 9, 271-289. [ Links ]
95. White, K., & Lehman, D. R. (2005). Culture and social comparison seeking: The role of self-motives. Personality and Social Psychology Bulletin, 31, 232-242. [ Links ]
96. Wiesenfeld, B. M., Raghuram, S., & Garud, R. (1999). Communication patterns as determinants of organizational identification in a virtual organization. Organization Science, 10, 777-790. [ Links ]
97. Wiesenfeld, B. M., Raghuram, S., & Garud, R. (2001). Organizational identification among virtual workers: The role of need for affiliation and perceived work-based social support. Journal of Management, 27, 213-229. [ Links ]
98. Wohlwill, J. (1974). Human adaptation to levels of environmental stimulation. Human Ecology, 2, 127-147. [ Links ]
99. Zou, X., Ingram, P., & Higgins, E. T. (2015). Social networks and life satisfaction: The interplay of network density and regulatory focus. Motivation and Emotion, 39, 693-713. http://dx.doi.org/10.1007/s11031-015-9490-1. [ Links ]
![]() Correspondence:
Correspondence:
Mehmet A. Orhan
Tilburg University.
School of Humanities.
Warandelaan 2. Tilburg,
5037. The Netherlands.
m.a.orhan@uvt.nl
Received 27 August 2015
Accepted 19 February 2016

