Servicios personalizados
 Inglés (pdf)
 Articulo en XML
 Referencias del artículo
 Enviar articulo por email
 Citado por SciELO
  Citado por Google
  Similares en
SciELO
Similares en
SciELO  Similares en Google
 Permalink
Need for affect (NA) is a psychological construct that refers to individual differences in the motivation to approach or avoid emotion-inducing situations and activities. That is, NA includes “the desire to experience and understand the emotions of oneself and others”, as well as “the belief that emotions are useful for shaping judgments and behavior” (Maio & Esses, 2001, p. 585). Prior research has demonstrated that NA is a relevant construct for understanding psychological processes related to affect (broadly defined as including emotions, moods, preferences, and evaluations; Fiske & Taylor, 1990). As noted by Maio and Esses (2001, p. 583), “NA is related to some individual differences in cognitive processes (e.g., need for cognition, need for closure), emotional processes (e.g., affect intensity), behavioral inhibition and activation (e.g., sensation seeking ... ), and aspects of personality (e.g., Big Five dimensions) ... , while not being redundant with them” (see Maio & Esses, 2001, for a full description of the nomonological net for the NA). Furthermore, individuals high in NA prefer and look for emotional events (e.g., Bartsch et al., 2010), and tend to have polarized (i.e., extreme) attitudes across a variety of issues (e.g., Britt et al., 2009). Moreover, prior studies have found that individuals high in NA are more persuaded by an affect-based message (compared to a cognition-based message) under some specific conditions (e.g., Haddock et al., 2008), and show more correspondence between their evaluations of a behavior and their intentions to perform that behavior (e.g., Trafimow et al., 2004).
To assess NA, Maio and Esses (2001) proposed the Need for Affect Questionnaire (NAQ). The NAQ includes 26 items that assess two different factors: Emotion Approach and Emotion Avoidance. The NAQ scores showed good psychometric properties. Subsequently, the NAQ was successfully adapted to Italian (Leone & Presaghi, 2007) and German (Appel, 2008). In addition, Appel and colleagues (2012) developed a short measure of NA (in English and German), consisting of only 10 items (NAQ-S). The NAQ-S scores have also showed adequate validity and reliability.
Given the powerful influence of emotions on cognition and behavior (e.g., emotions guide judgments and motivate behavior, e.g., see Schwarz, 1990), it is very important to examine the psychometric properties and the factor structure of scores from the Spanish adaptations of the NAQ and the NAQ-S, because properly assessing individual differences in NA can help us examine very different psychological phenomena in very different situations. Thus, the present research aimed to adapt and validate the NAQ, as well as the short version (i.e., the NAQ-S), to Spanish. In Study 1, following administration of the NAQ to Spanish-speaking respondents, we tested the psychometric properties of the NAQ scores, as well as its concurrent validity, through examining the relationships between those scores and measures of other relevant psychological constructs. In Study 2, we examined the reliability, factor structure, and concurrent validity of the scores in the Spanish adaptation of the NAQ-S.
Study 1
Method
Participants
Four hundred and sixteen individuals were recruited from the Spanish population (55.77% females, 43.27% males, and 0.96% indicated “other”) and voluntarily participated in Study 1. Our sample was recruited via non-probabilistic sampling methods. Of this sample, 409 were born in Spain. All participants were proficient in Spanish. Age ranged from 18 to 87 years old (M = 42.25, SD = 15.61). Educational level was as follows: 64.67% university degree, 12.74% vocational training, 11.54% high school, 5.77% secondary education, 2.16% primary school, and 3.12% indicated “other”. Three participants were eliminated from the database because they showed no variability in their responses. Each participant completed the Spanish adaptation of the NAQ as part of a battery of questionnaires that were included in line with prior research on the NAQ (e.g., Maio & Esses, 2001).
Instruments
Need for Affect Questionnaire (NAQ). The Need for Affect Questionnaire (Maio & Esses, 2001) is a 26-item measure that assesses one's motivation to approach or avoid emotion-inducing situations and activities through two different factors (13 items measuring each factor): Emotion Approach and Emotion Avoidance. Participants responded on a 7-point scale ranging from 1 (strongly disagree) to 7 (strongly agree).
Need for Cognition Scale (NCS). The NCS assesses the tendency of individuals to engage in and enjoy effortful cognitive endeavors (Cacioppo & Petty, 1982). The NCS consists of 18 items rated on a 5-point scale, ranging from 1 (strongly disagree) to 5 (strongly agree). We used the Spanish adaptation of the NCS (Falces et al., 2001), on which scores showed good internal consistency (α = .89).
Need to Evaluate Scale (NES). The NES assesses the tendency to form and develop attitudes (Jarvis & Petty, 1996). We included the Spanish adaptation of the NES (Horcajo et al., 2008) which consists of 16 items rated on a 5-point scale, ranging from strongly disagree (1) to strongly agree (5). Internal consistency of the NES scores was acceptable (α = .76).
Need for Cognitive Closure Scale (NCCS). The NCC refers to the motivation to seek and maintain a definitive answer to a given problem. This cognitive closure allows some individuals to avoid confusion, ambiguity, and uncertainty (Kruglanski, 1989, 2004). We used the Spanish adaptation of the revised NCC scale (Horcajo et al., 2011). This scale consists of 14 items rated on a 6-point scale, ranging from 1 (strongly disagree) to 6 (strongly agree). Internal consistency was adequate for scores in the two dimensions of the NCCS: Urgency (α = .79) and Permanence (α = .69).
Brief Sensation Seeking Scale (BSSS-8). The BSSS-8 is an 8-item instrument that assesses individuals' tendency to have a need for novelty, complexity, and intensity (Hoyle et al., 2002). The Spanish version of the BSSS-8 was proposed and assessed by Stephenson et al. (2007). The response format follows a 5-point scale, ranging from 1 (strongly disagree) to 5 (strongly agree). Internal consistency of scores was good (α = .82).
Ten-Item Personality Inventory (TIPI-10). The TIPI-10 is a 10-item measure that assesses the dimensions of the Five Factor Model using two items per factor: Neuroticism, Extraversion, Openness, Agreeableness, and Conscientiousness (Gosling et al., 2003). The TIPI-10 was adapted to Spanish by Renau et al. (2013). The response format follows a 7-point scale, ranging from 1 (strongly disagree) to 7 (strongly agree). Correlations among the item pairs measuring each factor ranged from r = .10 to r = .49.
Larsen's Affect Intensity Measure (AIM). The AIM is a 40-item measure that assesses the intensity of affective responses elicited by events and situations (Larsen, 1987). The AIM was adapted to Spanish by Martínez and Ortiz (2000). The response format follows a 7-point scale, ranging from 1 (never) to 6 (always). In this Spanish adaptation of the AIM, four factors were found: a) Positive Affectivity, which describes intense feelings of happiness, joy, and euphoria; b) Negative Intensity, which refers to individuals' tendency to experience unpleasant emotional states; c) Serenity, which includes positive affect in terms of calm, relaxation, and peace; and d) Negative Reactivity, which refers to negative affective reactions to environmental stimuli or events. Cronbach's alpha coefficients for scores in each factor ranged from α = .74 to α = .90.
The Positive and Negative Affect Schedule (PANAS) Scales. The PANAS is a 20-item measure in which 10 items refer to Positive Affect (e.g., proud, enthusiastic, strong) and 10 items refer to Negative Affect (e.g., upset, guilty, scared; see Watson et al., 1988). We used the Spanish version of the PANAS proposed by López-Gómez et al. (2015). Participants were asked to reflect on how they felt during the last month, including in that moment, and respond using a 5-point scale, ranging from 1 (not at all or very little) to 5 (extremely) for each item. Internal consistency of scores was good (i.e., Positive Affect: α = .90, and Negative Affect: α = .88).
Toronto Alexithymia Scale (TAS-20). The TAS-20 is a 20-item measure assessing alexithymia (Bagby et al., 1994). The Spanish version of TAS-20 was adapted by Martínez-Sánchez (1996). Each item is rated on a 5-point scale, ranging from 1 (strongly disagree) to 5 (strongly agree). The TAS-20 consists of three subscales: a) the 7-item Difficulty Identifying Feelings subscale, b) the 5-item Difficulty Describing Feelings subscale, and c) the 8-item Externally Oriented Thinking subscale. Cronbach's alpha coefficients for scores were α = .88 for Difficulty Identifying Feelings, α = .78 for Difficulty Describing Feelings, and α = .58 for Externally Oriented Thinking.
Attitude Extremity.Maio and Esses (2001) assessed attitude extremity towards different topics as a criterion variable of predictive validity of the NAQ scores. Similarly, we asked participants to indicate their attitudes towards 20 current controversial issues (e.g., abortion, feminism, transgenic foods, etc.). Participants rated their attitudes using one question per topic on an 11-point scale ranging from 0 (extremely unfavorable) to 10 (extremely favorable). Attitude extremity for each item was determined by calculating the absolute value of the difference between participants' responses and 5, the neutral point on the scale. Finally, those values were averaged to create an attitude extremity index.
Meta-Bases of Attitudes. As a new criterion variable to test the predictive validity of the scores, we included a measure of meta-bases of attitudes. Meta-bases refer to the subjective assessment that an individual makes about whether their attitudes are based on either affect or beliefs (See et al., 2008). Participants were asked to what extent they believed that their opinions towards all topics included in the measure of attitude extremity were based on emotions. The response format followed a 7-point scale, ranging from 1 (little emotionally based) to 7 (very emotionally based). Moreover, participants were also asked to what extent they believed that their opinions towards the same topics were based on beliefs. The response format followed a 7-point scale, ranging from 1 (little belief-based) to 7 (very belief-based).
Willingness to View Emotional Movies. Following Maio and Esses (2001), we tested whether the tendency to view movies that could produce happiness or sadness was a function of the individuals' the NAQ scores. First, each participant read a description of two different movies. One movie was described as likely to induce happiness, whereas the other movie was described as likely to induce sadness. Next, participants reported their willingness to watch each movie using a 7-point scale, ranging from 0 (little willing to view this movie) to 6 (very willing to view this movie, see Bartsch et al., 2010).
Sociodemographic Measures. Participants reported sociodemographic information such as age, sex, and educational level.
Procedure
Permission to conduct the current studies was granted by the institutional ethics committee of the Universidad Autónoma de Madrid. Participants were required to read and sign an informed consent form before the study began. Next, they completed an online survey. The data collection procedure was completely anonymous. Participants were informed that they were required to answer all questions (i.e., no omissions were allowed).
Following recommendations by Muñiz et al. (2013), the Spanish adaptation was created using the translation and back-translation process. Specifically, a bilingual translator translated all items from the NAQ to Spanish. Next, a different bilingual translator back-translated the Spanish version of items. Moreover, the authors of the present research and some collaborators discussed the translation to ensure a balanced treatment of item format, grammatical, linguistic, conceptual, and cultural considerations. Finally, the authors agreed on the final version.
In Study 1, to assess the test-retest reliability of the NAQ scores, during data collection in the first part of this study, participants were asked to provide a numeric code so that we could carry out a retest. After 16 weeks, one hundred participants were contacted and agreed to participate in the retest. This convenience sampling included university students (81% females, 17% males, and 2% indicated “other”), thus, participants' age ranged from 18 to 29 years old (M = 20.62, SD = 1.87).
Data Analysis
Current recommendations on test adaptation and exploration of their internal structure were considered (Ferrando et al., 2022; Hernández et al., 2020). Thus, item descriptive statistics were first examined, as well as measures of adequacy for factor analysis (KMO) and redundancy between items using the unique variable analysis procedure (Christensen et al., 2021). A parallel analysis based on minimum rank factor analysis (MRFA; Timmerman & Lorenzo-Seva, 2011), the hull method based on the unweighted least squares estimator (Lorenzo-Seva et al., 2011), and the exploratory graph analysis procedure (EGA; Golino & Epskamp, 2017) were used to assess the number of factors to retain. Furthermore, the factorial solutions were examined using exploratory factor analysis (EFA) with the minres estimator (Revelle, 2016). Factor congruence coefficients were estimated to assess whether the two-factor structure resembled the exploratory solutions reported in Maio and Esses (2001) and Appel (2008). A factor congruence coefficient higher than .90 can be interpreted as high similarity. We explored whether the estimated exploratory factor solution was invariant across sex. For this purpose, we estimated models of configural invariance (i.e., equal structure), metric invariance (i.e., equal loadings) and scalar invariance (i.e., equal intercepts), and we assessed whether the imposition of these restrictions was associated with a relevant loss of fit looking at the comparative fit index (CFI), root mean square error of approximation (RMSEA), and standardized root mean square residual (SRMR) fit indices (|i.e., ΔCFI| ≥ .010 and |ΔRMSEA| and |ΔSRMR| ≥ .015; Chen, 2007). Only by reaching the level of scalar invariance could we proceed to perform comparisons of means according to sex. In addition, we assessed the concurrent validity of the NAQ scores by examining the relationships with other relevant constructs measured in the present study. The reliability (α and ω) of the scores obtained with these measures was also examined, and the unidimensional model reflecting the sum scores was tested for good fit by assessing the model using a confirmatory factor analysis. In all cases, the fit was acceptable or excellent according to CFI (with values within the 0.937 - 1.000 interval), and acceptable or close to the limit of acceptance for RMSEA (with values within the 0.022 - 0.102 interval, with just a few exceptions). Moreover, the sum of the NAQ scores was correlated with the scores in the criterion variables (e.g., attitude extremity). To summarize the information from this analysis, a two-dimensional multidimensional scaling was applied to the resulting correlation matrix, with the aim of describing the groups of correlations. Test-retest reliability was examined by calculating the intraclass correlation coefficient (ICC; see Koo & Li, 2016). Specifically, the IC() function of the psych package was used and the results were analyzed for the single raters model.
Statistical analyses were conducted using R software. The following packages were used: CTT (Willse et al., 2018), psych (Revelle, 2021), EFA.MRFA (Navarro-Gonzalez & Lorenzo-Seva, 2021), EGAnet ( Golino & Christensen, 2021), lavaan (Rosseel, 2012), and semTools (Jorgensen et al., 2021). Plots were created using ggplot2 (Wickham, 2016).
Results
Internal Structure Validity Evidence
Descriptive statistics of NAQ's items are shown in Table 1. Skewness was below 1, except for items 4, 6, and 19, which were negatively skewed. Kurtosis was generally above 2, with some values being considerably high, such as items 19 and 6. For these reasons, we used the minres estimation method for EFA. The KMO statistic yielded a value of .85, which was adequate. Moreover, all items with a Measure of Sampling Adequacy were greater than .50. Classic indicators of discrimination and internal consistency were analyzed for scores in each of the two subscales. The internal consistency was adequate in both factors: Emotion Approach (α = .81) and Emotion Avoidance (α = .81). All items contributed to internal consistency, with the lowest discrimination index corresponding to item 2 with IH = .25, and the average .45. Next, possible reductions between items were assessed using the unique variable analysis procedure. This procedure indicated that items 3 and 7 could be redundant. In fact, both items refer to seeking strong emotions with similar wording (see Table 1).
Table 1. Descriptive Statistics of the NAQ Items.
| Dimension | Items | M (SD) | Skewness | Kurtosis | IH |
|---|---|---|---|---|---|
| Emotion Approach | 3*. Siento la necesidad de experimentar emociones fuertes con frecuencia [I feel that I need to experience strong emotions regularly] | 3.6 (1.7) | 0.09 | 1.88 | 0.45 |
| 4*. Las emociones ayudan a las personas a desenvolverse en la vida [Emotions help people get along in life] | 5.5 (1.7) | -1.11 | 4.06 | 0.39 | |
| 5. Soy una persona muy emocional [I am a very emotional person] | 5.1 (1.5) | -0.74 | 2.79 | 0.55 | |
| 6*. Creo que es importante analizar mis sentimientos [I think that it is important to explore my feelings] | 5.5 (1.4) | -1.30 | 4.49 | 0.52 | |
| 7. Busco situaciones en las que espero sentir emociones fuertes [I approach situations in which I expect to experience strong emotions] | 3.6 (1.6) | 0.07 | 1.99 | 0.51 | |
| 13. Deberíamos dar rienda suelta a nuestras emociones [We should indulge our emotions] | 4.4 (1.5) | -0.38 | 2.34 | 0.29 | |
| 15. Las emociones fuertes son, generalmente, beneficiosas [Strong emotions are generally beneficial] | 3.9 (1.9) | -0.05 | 2.86 | 0.29 | |
| 17. La capacidad de sentir emociones favorece la supervivencia humana [The experience of emotions promotes human survival] | 5.6 (1.1) | -0.88 | 3.65 | 0.37 | |
| 18*. Para mí es importante estar en contacto con mis emociones [It is important for me to be in touch with my feelings] | 5.5 (1.1) | -0.98 | 4.02 | 0.60 | |
| 19*. Me parece importante saber cómo se sienten los demás [It is important for me to know how others are feeling] | 6.0 (1.0) | -1.89 | 8.29 | 0.45 | |
| 20. Me gusta reflexionar sobre mis emociones [I like to dwell on my emotions] | 5.3 (1.5) | -0.97 | 3.28 | 0.52 | |
| 24. Siento que necesito desahogarme llorando de vez en cuando [I feel like I need a good cry every now and then] | 4.7 (1.9) | -0.59 | 2.22 | 0.46 | |
| 26. Me gusta decorar mi dormitorio con cosas que tienen un valor sentimental para mí [I like decorating my bedroom with a lot of pictures and posters of things emotionally significant to me] | 4.9 (1.7) | -0.65 | 2.57 | 0.39 | |
| Emotion Avoidance | 1*. Si reflexiono sobre mi pasado, me doy cuenta de que me suele asustar sentir emociones [If I reflect on my past, I see that I tend to be afraid of feeling emotions] | 3.3 (1.7) | 0.35 | 1.77 | 0.43 |
| 2. Me cuesta decir “te quiero” a las personas que aprecio [I have trouble telling the people close to me that I love them] | 3.4 (2.0) | 0.24 | 1.58 | 0.25 | |
| 8*. Intento evitar las emociones fuertes porque me abruman [I find strong emotions overwhelming and therefore try to avoid them] | 3.6 (1.6) | 0.21 | 2.00 | 0.48 | |
| 9*. Preferiría no sentir altibajos emocionales [I would prefer not to experience either the lows or highs of emotion] | 5.0 (1.6) | -0.70 | 2.74 | 0.39 | |
| 10*. Evito mis emociones porque no sé cómo manejarlas [I do not know how to handle my emotions, so I avoid them] | 3.0 (1.5) | 0.67 | 2.57 | 0.58 | |
| 11*. Las emociones son peligrosas porque suelen llevarme a situaciones que preferiría evitar [Emotions are dangerous-they tend to get me into situations that I would rather avoid] | 3.1 (1.6) | 0.66 | 2.55 | 0.57 | |
| 12. Actuar de acuerdo con las emociones es un error [Acting on one's emotions is always a mistake] | 3.4 (1.5) | 0.48 | 2.57 | 0.31 | |
| 14. Mostrar las emociones es embarazoso [Displays of emotions are embarrassing] | 3.0 (1.5) | 0.41 | 2.20 | 0.37 | |
| 16. Las personas son más ineficaces cuando están sintiendo emociones fuertes [People can function most effectively when they are not experiencing strong emotions] | 4.0 (1.5) | -0.07 | 2.20 | 0.37 | |
| 21. Ojalá pudiera sentir menos las emociones [I wish I could feel less emotion] | 3.9 (1.6) | 0.60 | 2.49 | 0.66 | |
| 22. Evitar situaciones emocionales me ayuda a dormir mejor por la noche [Avoiding emotional events helps me sleep better at night] | 4.2 (1.7) | -0.17 | 2.04 | 0.47 | |
| 23. A veces tengo miedo de cómo podría actuar si me emociono demasiado [I am sometimes afraid of how I might act if I become too emotional] | 3.7 (1.7) | 0.08 | 1.89 | 0.44 | |
| 25. Me encantaría ser una persona racional y poco emotiva [I would love to be like “Mr. Spock,” who is totally logical and experiences little emotion] | 3.3 (1.6) | 0.45 | 2.47 | 0.57 |
Note. *Item included in the NAQ-S. IH (Item-Homogenity): Corrected item-test correlation.
Regarding the dimensionality results, the number of dimensions recommended according to parallel analysis, hull method, and EGA was 3, 2, and 4, respectively. In this reduced set of items where items 3 and 7 formed a unique score, the parallel analysis MRFA recommended the retention of two factors, and EGA recommended three. We then explored the EGA and EFA solutions. As can be seen in Figure 1, the two additional dimensions correspond to minor dimensions, and the two larger groups that were theoretically expected (Emotion Approach: items 3, 4, 5, 6, 7, 13, 15, 17, 18, 19, 20, 24, and 26; and Emotion Avoidance: items 1, 2, 8, 9, 10, 11, 12, 14, 16, 21, 22, 23, and 25) are maintained. This was also reflected in the factor loadings with the two-factor EFA model. The convergence of this exploratory solution with the exploratory solution reported in Appel (2008) and the confirmatory solution in Maio and Esses (2001) was high, with congruence coefficients equal to .92, .93, and .91, .96 for Emotion Approach and Emotion Avoidance, respectively. The correlation between the two factors was r = -.22. The reliability of scores was acceptable for both factors: Emotion Approach (ω = .83) and Emotion Avoidance (ω = .82).
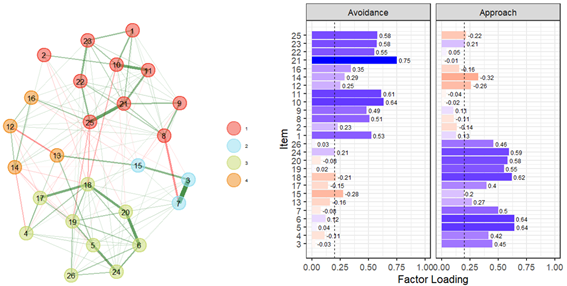
Figure 1. NAQ Exploratory Graph Analysis Solution (left) and Exploratory Factor Model Solution (right).
Finally, the results provided evidence in favor of the presence of scalar invariance across sex (Table 2). An exploratory two-factor model was used as a baseline model in which we correlated the error terms of items 3 and 7, in a manner consistent with the results discussed previously. Setting the means in the latent factors to be equal worsened the fit significantly. Specifically, the CFI dropped to 0.889 (|ΔCFI| = 0.041). At the latent level, in the scalar invariance model, the means were very similar for Emotion Avoidance (the mean was 0.144 points higher in males), while for Emotion Approach, the mean was quite higher in the female group (0.903 points). At the observed level, congruently there was only a small difference in Emotion Avoidance in favor of males, t(387.78) = -2.40, p = .02, Cohen's d = 0.24, and a moderate difference in Emotion Approach in favor of females, t(334.77) = 7.89, p <.001, Cohen's d = 0.80.
Table 2. Fit Statistics at Each Sex Measurement Invariance Level.
| Baseline model | Constraints | X2 | Degrees of freedom | p-value | CFI | RMSEA | SRMR | |ΔCFI| | |ΔRMSEA| | |ΔSRMR| |
|---|---|---|---|---|---|---|---|---|---|---|
| ESEM 2 factors | Configural | 1359.08 | 548 | <.001 | 0.940 | 0.090 | 0.080 | |||
| ESEM 2 factors with x3~~x7 | Configural | 1081.82 | 546 | <.001 | 0.957 | 0.069 | 0.073 | |||
| Metric | 1340.25 | 594 | <.001 | 0.940 | 0.080 | 0.081 | 0.017 | 0.011 | 0.008 | |
| Scalar | 1558.12 | 720 | <.001 | 0.930 | 0.080 | 0.079 | 0.010 | 0.000 | 0.002 | |
| Means | 2122.04 | 722 | <.001 | 0.889 | 0.097 | 0.078 | 0.041 | 0.017 | 0.001 |
Note.ESEM: Exploratory structural equation model (DWLS estimator). x3~~x7: Correlated error terms. Those cells that imply a relevant loss of fit according to Chen (2007) have been shaded in gray. The sample size used in this analysis was 410.
Evidence Based on the Relationships With Measures of Other Variables
Based on the multidimensional scaling analysis shown in Figure 2, the scales can be grouped around two large dimensions. Attending to the spatial map, dimension 1 appears to be formed by a continuum between approach versus avoid emotion. Each NAQ's subscale is located on one side of the vector, corresponding to their theoretical meaning. Dimension 2 appears to be formed by a continuum between the tendency to feel intense and negative emotions and the tendency to feel serenity and positive emotions. In dimension 2, the Emotion Approach subscale is located close to the pole of feeling intense and negative emotions, while Emotion Avoidance is located close to a neutral value. This spatial map depicts the relationships between the different measures provided in Table 3. Emotion Approach is positively and significantly correlated with the Need for Cognition Scale, Need to Evaluate Scale, BSSS-8, PANAS' Negative Affect subscale, Extraversion, Neuroticism, Openness, AIM's Positive Affectivity subscale, the Negative Intensity and the Negative Reactivity subscale. In contrast, Emotion Approach is negatively and significantly correlated with both Need for Cognitive Closure subscales, TAS-20's Difficulty Describing Feelings subscale, TAS-20's Externally Oriented Thinking subscale, and AIM's Serenity subscale. Predictive validity measures were consistent with our expectations based on the results from the original research with the NAQ (Maio & Esses, 2001): Emotion Approach was positively and significantly correlated with attitudes extremity, the willingness to watch emotional movies (inducing happiness and inducing sadness), and affective meta-bases of attitudes.
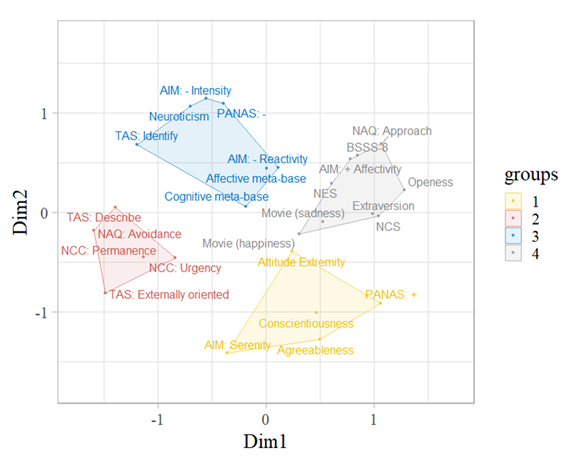
Table 3. Descriptive Statistics and Relationships With Measures of Other Variables.
| Measure | M (SD) | α/ω | rNAQapp | rNAQavo | rNAQtot |
|---|---|---|---|---|---|
| NAQ: Total | 108.4 (17.9) | .84/.86 | .78** | -.83** | -- |
| NAQ: Approach | 63.4 (10.3) | .81/.83 | -- | -.32** | -- |
| NAQ: Avoidance | 46.0 (11.7) | .81/.82 | -- | -- | -- |
| NCS | 60.0(12.5) | .89/.90 | .25** | -.24** | .30** |
| NES | 51.6(9.4) | .76/.78 | .29** | -.06 | .21** |
| NCCS: Urgency | 19.0 (5.7) | .79/.81 | -.16** | .20** | -.22** |
| NCCS: Permanence | 26.5 (5.3) | .69/.71 | -.15** | .43** | -.37** |
| BSSS-8 | 23.7 (6.7) | .82/.83 | .49** | -.22** | .42** |
| Extraversion | 9.2 (2.9) | .49a/NA | .23** | -.33** | .35** |
| Agreeableness | 10.0 (2.1) | .10a/NA | .05 | -.15** | .13** |
| Conscientiousness | 10.7 (2.5) | .33a/NA | -.03 | -.14** | .08 |
| Neuroticism | 6.8 (2.9) | .44a/NA | .13* | .31** | -.13** |
| Openess | 9.8 (2.6) | .35a/NA | .44** | -.34** | .48** |
| AIM: Positive Affectivity | 74.3 (11.5) | .87/.90 | .52** | -.19** | .43** |
| AIM: Negative Intensity | 24.2 (6.0) | .78/.79 | .20** | .25** | -.04 |
| AIM: Serenity | 28.9 (6.4) | .90/.90 | -.18** | .17** | -.21** |
| AIM: Negative Reactivity | 33.0 (6.7) | .74/.76 | .39** | .05 | .19** |
| PANAS: Positive | 33.2 (7.7) | .90/.91 | .08 | -.34** | .27** |
| PANAS: Negative | 22.1 (8.1) | .88/.90 | .30** | .22** | .03 |
| TAS: Identify | 15.3 (6.2) | .88/.89 | .04 | .42** | -.25** |
| TAS: Describe | 12.6 (4.4) | .78/.80 | -.16** | .49** | -.41** |
| TAS: Externally oriented | 19.8 (4.5) | .58/.61 | -.47** | .42** | -.54** |
| Attitude extremity | 63.4 (14.9) | .13** | -.02 | .09 | |
| Affective meta-bases | 4.8 (1.6) | .32** | -.02 | .20** | |
| Cognitive meta-bases | 4.9 (1.7) | .10* | .10 | .00 | |
| Movie (happiness) | 5.1 (1.8) | .15** | -.12* | .17** | |
| Movie (sadness) | 4.3 (2.0) | .23** | -.15** | .23** |
Note.a:Correlation between the two items that form the scale.
NAQ = Need for Affect Questionnaire; NCS = Need for Cognition Scale; NES = Need to Evaluate Scale; NCCS = Need for Cognitive Closure Scale; BSSS = 8 = Brief Sensation Seeking Scale; AIM= Larsen's Affect Intensity Measure; PANAS = The Positive and Negative Affect Schedule; TAS-20 = Toronto Alexithymia Scale.
*p < .05,
**p < .01.
As can be seen in Figure 2, Emotion Avoidance is positively and significantly correlated with each dimension of alexithymia and both Need for Cognitive Closure subscales, as well as it was also close to Neuroticism. In contrast, Emotion Avoidance is negatively and significantly correlated with Need for Cognition Scale, BSSS-8, Extraversion, Agreeableness, Conscientiousness, Openness, AIM's Positive Affectivity subscale, and PANAS' Positive Affect subscale. Predictive validity measures were partially consistent with our expectations. Specifically, Emotion Avoidance was only negatively and significantly associated with willingness to watch emotional movies (inducing happiness and inducing sadness).
According to Maio and Esses (2001, p. 609), our results also suggest “the importance of assessing Emotion Approach and Emotion Avoidance, in addition to the total need for affect (...) because there is a strong conceptual relationship between the total need for affect and both Emotion Approach and Emotion Avoidance. Empirically, Emotion Approach and Emotion Avoidance are correlated and share many relationships with other variables, whereas several correlates are distinct. Thus, it seems productive to examine the total need for affect and its two components to most fully understand emotion-related processes.” In line with these authors, we analyzed correlations with total scores in the NAQ. This exploration was performed to examine what relationships might be expected to be found when a single score is reported, although in strictly psychometric terms, based on the results obtained in our study, the most appropriate practice would be to report and interpret each subscale separately. The total score was generated by inverting the Emotion Avoidance items.
Evidence for Test-Retest Reliability
The retest data were used to assess the temporal stability of the NAQ scores. Specifically, the intraclass correlation coefficient was r = .74 for Emotion Approach (95%CI [.66, .81]), and r = .81 for both Emotion Avoidance and the total score (95%CI [.75, .86]), showing moderate and good temporal stability, respectively.
Study 2
Method
Participants
Data from Study 1 were also used to explore the internal structure validity evidence of the Spanish adaptation of the NAQ-S. Moreover, we recruited a second independent sample consisting of 118 participants (79.66% females, and 20.34% males), aged between 18 and 25 years (M = 19.80, SD = 1.55), who were recruited via non-probabilistic sampling methods from Universidad Autónoma de Madrid.
Instruments
The 10 items from the Need for Affect Questionnaire Short (NAQ-S) were selected based on Appel et al. (2012). There are five items per factor (see Table 1). To test concurrent validity, we selected the BSSS-8 scale (α = .75) as a relevant measure.
Procedure
Participants completed the Spanish version of the NAQ-S and the BSSS-8 that were administered online.
Data Analysis
The 10 items of the NAQ-S were analyzed in both samples. In the first sample (i.e., Study 1), the adequacy of the NAQ-S was determined by assessing the correlation with the respective scores of the complete 26-item scale. The second sample was obtained to assess how the NAQ-S items would perform when administered independently. We explored the parallel analysis based on MRFA, and the EGA results were used to assess the number of factors to retain. The factorial solutions in the two samples were estimated using EFA with the minres estimator. The solutions from the two samples were compared using factor congruency coefficients.
Results
Internal Structure Validity Evidence
The items of the NAQ-S proposed in Appel et al. (2012) were relatively pure indicators of their respective factors (see Table 4). Using data from Study 1, both parallel analysis and EGA recognized these two dimensions. Moreover, we determined that the correlation with the respective sum scores on the 26-item scale was high (r > .87). Internal consistency and reliability decreased compared to scores from the 26-item of the NAQ, dropping to ωHs = .71 and α = .63, and ωHs = .68 and α = .70, for the Emotion Approach and Emotion Avoidance scores, respectively.
Table 4. NAQ-S: EFA Solutions for the Two Samples.
| Sample 1 N = 413 | Sample 2 N = 118 | |||
|---|---|---|---|---|
| Items | Approach | Avoidance | Approach | Avoidance |
| 1 | .12 | .55 | .09 | .73 |
| 8 | -.07 | .52 | -.03 | .71 |
| 9 | .13 | .51 | .14 | .55 |
| 10 | -.06 | .68 | -.28 | .59 |
| 11 | -.06 | .62 | -.21 | .46 |
| 3 | .31 | -.03 | .31 | -.09 |
| 4 | .41 | -.08 | .48 | -.01 |
| 6 | .67 | .13 | .77 | .12 |
| 18 | .67 | -.19 | .69 | -.25 |
| 19 | .59 | .06 | .44 | .07 |
| Correlation F1-F2 | -.24 | -.47 | ||
Note.Estimated factor loadings greater than 0.30 are shown in bold.
In the second sample (Study 2), both EGA and parallel analysis recommended two factors. The correlation between factors was slightly higher when only the NAQ-S was administered (-.24 vs -.47), and the internal consistency and reliability was also higher, with ωt = .78 and α = .77, and ωt = .70 and α = .66, for Emotion Approach and Emotion Avoidance scores, respectively. When comparing the EFA solutions from both samples, we found that the factors congruence coefficients indicated almost perfect congruence (.97 in both cases).
Evidence Based on the Relationships With Measures of Other Variables and Test-Retest Reliability
As expected, the correlation between Emotion Approach and BSSS-8 scores was positive and significant (r = .33, p < .001). However, differently from Study 1, Emotion Avoidance and BSSS-8 scores were not significantly correlated (r = .05, p = .62), and the correlation between the total scores in the NAQ-S and BSSS-8 did not reach statistical significance (r = .11, p = .23).
Using the test-retest data of Study 1, it was observed that the temporal stability of the NAQ-S scores was moderate in the case of both factors. Specifically, r = .57 for Emotion Approach (95%CI [.45, .67]), r = .75 for Emotion Avoidance (95% CI [.66, .81]), and r = .75 for total NAQ score (95% CI [.67, .81]).
Discussion
The Spanish adaptation of the NAQ was successful regarding scores' validity and reliability. Two main factors with good internal consistency were found (i.e., Emotion Approach and Emotion Avoidance), although its test-retest reliability was slightly lower (specifically for Emotion Approach) than the original scale in English and the adaptations to Italian and German (Appel, 2008; Leone & Presaghi, 2007; Maio & Esses, 2001). Regarding the validity evidence, the relationships with measures of other variables were generally in line with prior research. Furthermore, predictive validity measures were generally consistent with our expectations. As a novel finding, Emotion Approach scores (and the total NAQ scores) predicted attitudes' affective meta-bases, and this is a relevant result because meta-bases predict the interest of individuals to think and elaborate on information congruent with their meta-bases (See et al., 2013). The structure was found to be invariant across sex at the scalar level, which made it possible to compare scores on the subscales. Consistent with previous studies (Leone & Presaghi, 2007; Maio & Esses, 2001), significantly higher scores were found in the female group, especially for the Emotion Approach. In conclusion, based on our findings, our adaptation of the NAQ seems to be an appropriate instrument to assess NA in Spanish.
Likewise, the scores of the Spanish adaptation of the NAQ-S also showed two main factors, as well as acceptable internal consistency and test-retest reliability. Nevertheless, concurrent validity and predictive validity measures should be further analyzed in future research. Although not reported in the Results section, when the scores of the NAQ-S' items in Spanish were analyzed in Study 1, the relationships between those scores and the measures of the other variables were very similar to results found with all 26 items of the NAQ. Thus, although more studies are necessary to examine those relationships with only the 10 items of the Spanish adaptation of the NAQ-S, as well as which items are better suited for an adaptation of the NAQ-S to Spanish, findings from the present research support our adaptation by showing scores that are valid and reliable.
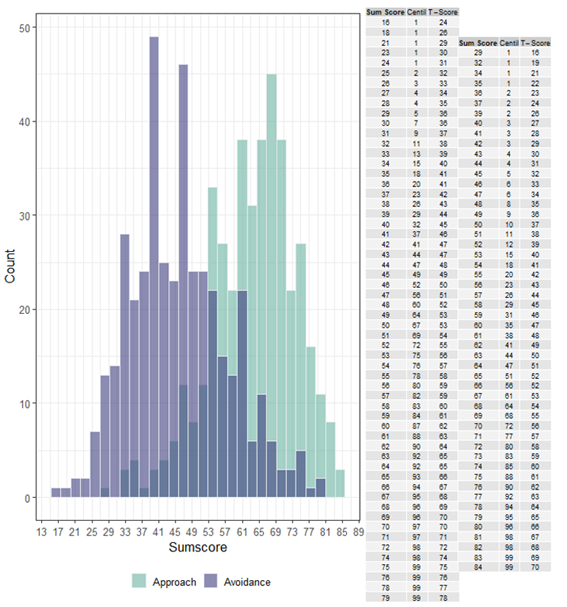
Nevertheless, the present research has a number of limitations that future studies should consider. First, it is worth noting that there are data that support the idea that the two-factor structure is invariant across sex, age, and education (Appel et al., 2012). In our research, the reported evidence of sex invariance also supported this idea. It should be noted that the sample per group was small (232 females, and 178 males). In addition, the congruence of the estimated structure in this research with that reported in other prior studies was high. To facilitate the use and interpretation of the scores obtained with the NAQ, Figure 3 shows the distribution of scores in each factor as well as normative data. These norms have been constructed considering the complete sample, although it is worth noting that we found that females had a moderately higher mean score in the case of the Emotion Approach subscale. Importantly, the absence of a floor and ceiling effect can also be appreciated. However, it is advisable that future studies further explore the issue of factorial invariance for these adaptations in representative samples. Until that happens, the norms provided should be considered tentative and only as an initial baseline. Although there are previous studies providing evidence in favor of measurement invariance at least at the metric level according to sex and age (Leone & Presaghi, 2007), no item-level analyses have been performed, so in that way this question remains unexplored with the exhaustiveness it requires. Our study provides these important results in the case of sex. Nonetheless, when approaching the study of measurement invariance or the distribution of scores across variables such as sex, age, or educational level, it is essential to ensure that sampling is representative of the population within each subsample. Relatedly, although our study has a large sample size and the sample is sex-balanced, most of the young participants were female, and therefore, the results we offer can be considered preliminary. In addition, although two independent samples of sufficient size were used for the analyses performed, it should be noted that the second sample consisted of university students. As indicated above, it may be interesting to gather additional evidence in other samples. Finally, consistent with the original study and subsequent adaptations that have been made to the NAQ and the NAQ-S (Appel et al., 2012; Leone & Presaghi, 2007; Maio & Esses, 2001), we maintained 7 categories in the response scale. While this number is consistent with classical recommendations around the optimal number of response categories, recent studies indicate that it may be more beneficial to employ 4 or 5 categories in a way that facilitates consistent use of the response scale (Wakita et al., 2012). Bearing this in mind, in future research, it would be useful to examine whether it is appropriate to reduce the number of categories for the NAQ and the NAQ-S. In sum, despite the limitations, the present findings suggest that adaptations proposed for both instruments are adequate, so should be considered in future research related to NA.