


 Servicios personalizados
 Inglés (pdf)
 Articulo en XML
 Referencias del artículo
 Enviar articulo por email
 Citado por SciELO
  Citado por Google
  Similares en
SciELO
Similares en
SciELO  Similares en Google
 Permalink
INTRODUCTION
Chronic kidney disease (CKD) is a worldwide health problem due to its high incidence 1. High morbidity and mortality in CKD is associated with its own progression to end-stage renal disease (ESRD) and the development of other metabolic disorders that increase the risk for cardiovascular diseases 2.
In turn, hemodialysis (HD), an essential treatment in ESRD, contributes to the increase of oxidative stress due to a diminished antioxidant system, and subsequently to the manifestation of inflammation and endothelial dysfunction, all risk factors for atherosclerosis in this population 3. Thus, oxidative stress markers have gained interest as non-traditional cardiometabolic risk factors in ESRD 4.
Among the markers of oxidative stress, nitric oxide (NO), a recognized vasodilator and cardioprotector, is prominent 5. Many cells are able to synthesize NO by the activity of the enzyme nitric oxide synthase (NOS), which converts the amino acid L-arginine to NO and L-citrulline 6. NO has important functions in renal physiology such as maintenance of homeostasis in blood flow, renal excretion and renin secretion; and tubule glomerular return 7. However, NO may be toxic under conditions of oxidative stress, from the generation of reactive oxygen species (ROS) and deficiency of the antioxidant system 8.
In this context, NO concentrations could be associated with other markers of oxidative stress and inflammation in the ESRD, although there were little studies regarding this topic 9.
Overall, the present cross-sectional study aimed to evaluate the potential association of NO variation with adiposity indicators, as well as metabolic, inflammatory and oxidative stress markers in individuals submitted to HD.
MATERIAL AND METHODS
STUDIED POPULATION
This is a cross-sectional study with 85 subjects on HD treatment (≥ 18 years old), the majority of participants were men (65.9%; n = 56) and the average age was 62 ± 13.7 years old attended in a single dialysis center. Patients underwent three weekly sessions of HD with an average duration of 4 hours, blood flow greater than 250 mL/min and dialysate flow of 500 mL/min. Individuals who did not show interest in participating in the study, with a treatment time of less than one month in HD and those with hearing impairment, newly implanted catheters, hemodynamic instability, evaluated by the doctor of the sector, and those unable to stand for anthropometric evaluation were not included in the study.
CLINICAL-NUTRITIONAL STATUS ASSESSMENT
The clinical-nutritional status was assessed using nutritional risk score subjective global assessment modified (SGAm), and anthropometric and body composition measurements. The SGAm used was based on the model proposed by Kalantar- Zadeh et al. 10 for renal patients on dialysis.
Anthropometry and tetrapolar electrical bioimpedance (BIA) were performed approximately 30 minutes after the end of HD. The anthropometric measures included dried weight (kg), height (cm), and waist circumference (WC), which were performed according to previously standardized procedures 11) (12) (13.
Body mass index (BMI) was calculated and individuals were classified according to the cut-off points of the World Health Organization 14 for adults and Lipschitz 15 for the elderly. The individuals were classified according to the cardiometabolic risk, according to the CP values, using the WHO cut-off points, 1995 14.
DIETARY INTAKE ASSESSMENT
A semi-quantitative food frequency questionnaire was constructed, based on an Australian questionnaire validated for renal patients 16) (17. Thus, the food portions of each group were analyzed according to the Food Guide for the Brazilian Population (2006) 18: cereals, tubers and roots, fruits, vegetables and legumes, and other vegetable foods rich in proteins, milk and dairy products, meat and eggs, fats, sugars and salt, water. The oilseeds group was also inserted, according to the Food Guide for Brazilian Population (2014) 19. The reference portion was based on the Family Budget Survey (POF) 2008 table 19. The fruit and vegetable group was divided into high, medium and low potassium.
Nutrient intake was calculated as frequency x nutrient composition of each portion size for each consumed food item, in spreadsheet in Microsoft Excel 2010, according to the nutritional composition of foods of Brazilian tables 20. Therefore, we evaluated the daily caloric intake (kcal), carbohydrates, protein, lipids and fatty acid profile (in percentage of caloric intake), fiber (g), calcium (g), phosphorus (mg), potassium (mg) and sodium (mg), magnesium (mg), manganese (mg), iron (mg) , selenium (μg), thiamine (mg), niacin (mg), cyanocobalamin (μg), vitamin E (IU), vitamin C (mg) and folate (mg).
METABOLIC MARKERS
The metabolic markers analyzed in the present study were those obtained from medical records: albumin, urea, urea removal rate (URR), creatinine, potassium, phosphorus, calcium, calcium-phosphorus (Ca-P) product, parathyroid hormone (PTH), hemoglobin (Hb), hematocrit (Ht), ferritin, iron (Fe), transferrin saturation (SatFe), C-reactive protein (CRP), triacylglycerol and total cholesterol. The Kt/V was calculated using the equation proposed by Daugirdas II 21. Values of urea Kt/V > 1.2 were considered indicative of efficiency in HD.
INFLAMMATORY AND OXIDATIVE STRESS MARKERS
Blood samples were collected before the beginning of HD. Blood was collected in (Vacutainer(r)) tubes containing EDTA as anticoagulant. Serum was separated in a refrigerated centrifuge (15 min, 3000 rpm, 4 °C) and both stored at -80 °C for posterior analysis. Serum IL-2, IL-4, IL-6, IL-10 concentrations were measured by flow cytometry technique with the BD FACverse Cytometer, using the Human Th1/Th2/Th17 CBA Kit (BD Biosciences, USA) at the Laboratory of General Biology, Department of General Biology, Universidade Federal de Viçosa. The results were obtained using the software Facsuite (BD(r)). Serum total antioxidant capacity (TAC), enzymes activity superoxide dismutase (SOD), and glutathione S-transferase (GST), the lipid peroxidation product malondialdehyde (MDA) and NO were considered as biomarkers of oxidative stress. TAC was measured by colorimetric assay using the Antioxidant Assay Kit (CS0790, Sigma Aldrich), according to the protocol provided by the manufacturer, and other markers were assessed standardized protocols of the Laboratory of Echophysiology of Chiroptera - Department of Animal Biology, Universidade Federal de Viçosa, as follows.
Activity of antioxidant enzymes
SOD activity was measured in serum in a microplate reader ( = 570 nm) 22, based on the ability of this enzyme to catalyze the reaction of superoxide radical (O2-) thus decrease the auto-oxidation ratio of pyrogallol. The results were expressed as U SOD/ mg protein.
GST was measured through the formation of GSH conjugate, 2.4- dinitrobenzene (CDNB), and estimated by the change in absorbance at 340 nm for 60s. The molar extinction coefficient of CDNB at 340 nm is 9.6 mM-1cm-1, which was used for the calculations 23. GST activity was expressed as µmol/min-/g.
Malondialdehyde
The concentration of MDA was estimated as described by Wallin et al. 24. 200 μl aliquots of each serum sample were separated and added to a 400 μl of heated, vortex homogenized solution TBARS whit trichloroacetic acid (15%) / thiobarbituric acid (0.375%) / hydrochloric acid (0.25 M) for 40 minutes in boiling water (90 °C) and then cooled in an ice bath for 5 minutes. 600 μL of butyl alcohol were added and again homogenized in vortex for ~ 2 minutes. The solutions were centrifuged at 3,000 rpm at room temperature (10 minutes at 900g). 200 uL of the supernatant were separated for quantifying the MDA concentration in microplate reader ( = 535 mm). The concentration of MDA was determined by standard curve from known concentrations of 1,1,3,3-tetramethoxypropane (TMPO). The results were expressed as μM/mg protein.
Nitric oxide
The serum for the NO tests was prepared as described above. The production of nitric oxide was indirectly quantified through nitrite content in the serum sample by the Griess reaction25, composed of 1% sulfanilamide and 0.1% naphthyl-ethylene-diamine in 2.5% in 2,5% H3PO4. Thus, 50 μL of the supernatant from the samples were added to microplates with equal volume of the Griess Reactant and incubated at room temperature for 15 minutes, then determined on a microplate reader ( = 570 nm). The nitrite concentration of the samples was determined using standard curve with known concentrations of sodium nitrite (NaNO2) and expressed in m/mg protein.
The protein concentration used in the calculations of the activity of antioxidant enzymes, MDA, and NO was measured by the method of Lowry et al. (1951), using bovine serum albumin as previously standardized 26.
STATISTICAL METHOD
Normal distribution of the data was determined using the Kolmogorov-Smirnov test. Data were expressed as mean ± standard deviation, median (interquartile range). The study population was divided by the median NO concentrations (4.32 μmol/L) in low and high NO concentration. The median cutoff criteria have been previously applied based 27 on a valid and reliable method to assign two groups of risk in epidemiological studies 28.
Comparisons between groups were performed using Student's t-test for parametric variables, or Mann-Whitney, for non-parametric variables. The correlation analysis between variables of interest was performed using Pearson or Spearman correlation coefficient, as appropriate. Multiple regression analysis was used to determine indicators of the variation of NO concentration of the sample studied. For the construction of multiple linear models, the value of p ≤ 0.20 obtained in the bivariate analysis was used as criterion for inclusion of the variables. In the final model, the backward method was used, for which the variables with less significance (greater p value) were removed one by one from the model.
Statistical analysis was performed using the SPSS 20.0 program (SPSS, Inc., Chicago, IL, USA) and a significance level of less than 5% was applied.
RESULTS
STUDY SAMPLE
The majority of the participants were men (65.9%; n = 56) and elderly (61.2%, n = 52). The main causes of CKD in the study population were hypertensive nephrosclerosis (41.2%; n = 35) and diabetes mellitus (32.9%; n = 28). The HD time ranged from 1 to 245 months, with a median of 41.5 months, presenting a statistical tendency when associated with NO (p = 0.062). In addition, the sample presented mean of Kt/V (1.52 ± 0.39) and serum albumin (4.08 ± 0.24 g/dL) as excepted to HD efficiency and nutritional adequacy. Regarding dietary intake, these individuals have an energy balance for macronutrients, with a high consumption of food sources of potassium 2,548.50 mg/d (935.4-8, 276, 0).
NO AND CLINICAL-NUTRITIONAL STATUS
In relation to weight status evaluated by BMI, 9.1% (n = 3) of adults were classified as underweight, 72.7% (n = 24) as normal weight, 15.2% (n = 5) pre-obese and 3% (n = 1) obesity class I. Among the elderly, 34.6% (n = 18) were classified as underweight, 44.2% (n = 23) normal weight and 21.2% (n = 11) were overweight. There was no statistical difference in relation to NO concentration (p = 0,395), according to weight status.
According to mSGA, nutritional status was adequate in 10.6% (n = 9) of the individuals, while 89.4% (n = 76) were at nutritional risk / mild malnutrition. Interestingly, the mSGA score was statistically lower in subjects with high NO (p = 0.012). By the WC, central adiposity indicator according to WHO (1997) (18), 22.4% of the patients had a high risk and a very high risk of obesity-related metabolic complications, with a very high risk being greater among women. By total body fat, 20.0% had fat shortage and 23.5%, excess fat. There was no statistical difference with these adiposity indicators in relation to NO concentration (Table I).
Table I Clinical and metabolic characteristics of the studied sample (n = 85), according to the median of nitric oxide concentrations (4.32 μmol/L)

BMI: body mass index; WC: waist circumference; SGAm: subjective global assessment modified; RRU: rate of reduction of urea; SatFe: transferrin saturation; Hb: Hemoglobin; PTH: parathyroid hormone. Values expressed as mean ± SD or median and confidence interval according to distribution; p-values by Student t-test or Mann-Whitney test, as appropriated.
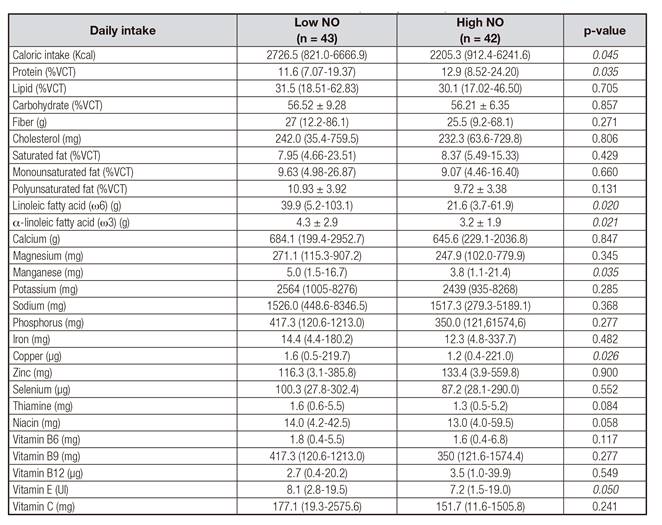
NO AND DIETARY INTAKE
Daily intake of total calories, alpha-linolenic fatty acid (ω3) and linoleic acid (ω6) were different according to median of NO concentration (Table II). In relation to micronutrients, a higher consumption of manganese, copper, zinc, selenium, vitamin B12 and Vitamin C was observed as well as a statistical tendency for lower consumption of vitamin E and niacin in those individuals with high NO.
NO AND METABOLIC MARKERS
Regarding metabolic markers, mean values of iron and satFe are in the normal range and are statistically higher in subjects with a high NO concentration (Table I). PTH presented lower values for median in subjects with high NO concentrations (p = 0.044), whereas an inverse behavior was observed with serum triglyceride levels (p = 0.003) at high NO concentrations. On the other hand, ferritin presented a significant trend (p = 0.084) with a mean higher than that recommended for high NO concentrations.
NO, INFLAMMATORY MARKERS AND OXIDATIVE STRESS
Interestingly, there was a positive correlation of NO with the SOD enzyme (r = 0.616 p < 0.001), and negative correlation with total protein (r = -0.214 p = 0.049), as shown in Fig 1. No significant correlations were found among others markers such as MDA and GST, or TAC when related to NO. Furthermore, NO concentrations were negatively correlated with IL-6 and IL-10 concentrations, pro- and anti-inflammatory markers, respectively (Fig. 2).


Figure 2 Spearman correlation between nitric oxide and SOD (superoxide dismutase) in subjects in HD (n = 85).
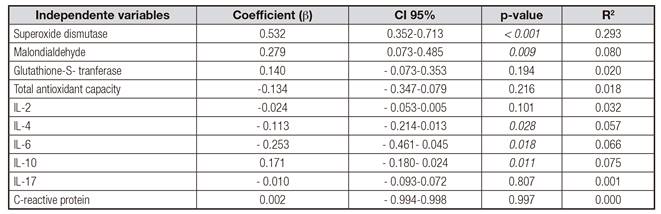
In addition, the possible contribution of clinical and anthropometric variables, as well as metabolic, inflammatory and oxidative stress markers, and dietary intake to the NO variation in HD individuals were evaluated through bivariate regression analysis. Thus, IL-6, SOD, triacylglycerols, iron, transferrin saturation, ferritin and ingestion of ω6 were significantly association with NO concentration (Table III). In relation to inflammatory and oxidative stress markers, MDA, SOD, GST and IL-10 were positively associated, whereas IL-2, IL-4 and IL-6 formed negative predictors of NO (Table IV).
Table III Bivariate linear regression to explain the variation of NO concentrations (dependent variable) in subjects in HD (n = 85) in relation to clinical-metabolic variables

BMI: body mass index; WC: waist circumference; SGAm: subjective global assessment modified; RRU: rate of reduction of urea; SatFe: saturation transferrin; PTH: parathyroid hormone.
Table IV Bivariate linear regression to explain the variation of NO concentrations (dependent variable) in subjects in HD (n = 85) in relation to inflammatory markers and oxidative stress
Finally, in the multiple regression model, the concentrations of ferritin, triacylglycerols, IL-6 and SOD contributed with a 54.8% of variation in NO concentrations, whereas triacylglycerols and SOD concentrations were independent predictors (Table V).

DISCUSSION
The present study evaluated the potential association of NO variation with metabolic, inflammatory and oxidative stress markers in individuals submitted to HD. Our most relevant result was the concentration of SOD, also recognized marker of oxidative stress, as an independent predictor of NO variation.
In this context, NO produced by eNOS under favorable conditions may induce the production of SOD in the muscular layer of the vessel and extracellularly reducing available superoxide radicals (O2-) and, consequently, peroxynitrite production (ONOO-) and oxygen reactive species (ROS) expression. In fact, increased production of ROS, such as superoxide, hydrogen peroxide and lipoperoxides, in addition to decreased NO synthesis and concentrations of antioxidants such as vitamin E and SOD, has been observed in hypertension patients when compared to normal individuals. These individuals with hypertension still have decreased concentrations of antioxidants such as vitamin E and SOD 29. It is worth mentioning that vitamin E could also have a pro-oxidant action under special conditions that can be found in HD patients 30. In fact, oral administration of α-tocopherol (500 mg/day) for 1 year for HD patients caused a reduction in SOD activity and total antioxidant status 31. This may be due to the low level of other antioxidants needed to restore the reduced form of vitamin E (e.g., vitamin C) 31. Although vitamin E therapy has been extensively studied in patients with CKD, there is no consensus on the benefit obtained from its administration 32. The same was found in study by Hambali et al. 33 also found reduced plasma NO in all subjects after HD when compared to controls and consequently reduced SOD, demonstrating a direct relationship between SOD and NO.
Moreover, the cytosolic SOD enzyme is copper and zinc dependent. The decrease of these ions in patients receiving HD may contribute to a decrease in SOD activity and a consequent increase in inflammatory expression 34. In this context, some studies have described interactions between zinc/ copper deficiency and nitrosamine stress with iNOS induction and inflammation, which may contribute to the pathogenesis of diarrheal and cardiovascular diseases 35. Zinc, in turn, has anti-inflammatory properties in vivo because of its ability to suppress the induction of cytokines by iNOS, since it is an antioxidant enzyme. Zn supplementation can improve taste and smell and gastrointestinal function, increase food intake, and reduce protein-energy waste 36. Thus, patients with Zn deficiency receiving Zn supplementation have improvements in their antioxidant-antioxidant balance and nutritional status 37, which probably contributes to the increase in plasma SE status. In this sense, consumption above recommendations was observed both in individuals with high and low NO concentrations of minerals (Mn, Cu and Zn), vitamin C and α-linolenic fatty acids (ω3), all nutrients with antioxidant properties. Thus, we hypothesized that our sample presents a favorable antioxidant system, since these nutrients act as enzymatic cofactors. Studies highlight them by inhibiting lipoprotein oxidation as an anti-peroxidation agent, and indirectly promote iNOS activation antagonistic action, improving NO vasodilator vascular action, decreasing the available (O2-) 38. Evidence also shows that polyunsaturated fatty acids, especially ω3, promote an increase in the regulation of the NO system by iNOS 39. Thus, the results of dietary intake in relation to NO concentrations reinforce our hypothesis that there is a suitable system for NO activity. However, these benefits were not confirmed by Kooshki et al. 40 who did not observe improvements in F2-isoprostane levels nor in carbonylic proteins after supplementation with 2.08 g/day EPA 1 DHA and 800 mg/day DHA 1 vitamin E, respectively. These findings corroborate the results of the study by Mattos et al. 2017 41 in which supplementation at physiological doses of n-3 PUFA was not able to alter oxidative stress profiles. However, linear regression analysis showed that n-3 PUFA is associated with improved rates of isoprostane and advanced oxidation protein products (AOPP) in HD patients.
The second relevant result of this study was a negative association between inflammatory markers and NO concentrations. In fact, the increase of NO, through the regulation of iNOS by inflammatory cytokines, such as IL-1, IL-6, and TNF in patients submitted to HD has been demonstrated in the literature 42. In addition, Amore et al. 43 demonstrated that abnormal stimulation of iNOS by cytokines was closely associated with the development of vasculopathy in long-term dialysis patients, consistent with the inverse assumption in our study.
Another interesting result of our study was the higher concentrations of triacylglycerols in those individuals with high NO concentration. The same was observed in the study by Volpe et al. 44. Free fatty acids are stored in the body in the form of triacylglycerols and are released into the tissues by lipolysis. This triacylglycerol increases NO production in the skeletal muscle, through the iNOS, contributing to the initiation of the inflammatory cascade, by activation of transcription factor NF-κB 45. Taken together, our and previous outcomes suggest that high triacylglycerol may contribute to increase NO production in situations of inadequate antioxidant defense.
In addition, our results showed a positive association between serum iron values and transferrin saturation and a significant trend for ferritin and NO concentration in the individuals studied. Iron supplementation is a common recommendation for patients with renal disease; however, excess iron can act as a pro-oxidant factor, thus contributing to the oxidation of molecules, such as NO. This, produced by eNOS, induces the synthesis of ferritin, which binds to free iron ions and prevents the generation of O2-. However, under conditions of vascular endothelium impairment, activated macrophages produce O2-, express iNOS and produce NO. In this way, ONOO- and hydroxyl radical (OH-) are produced, compromising tissue integrity, which favors the activation of coagulation and contributes to vascular lumen obstruction, increasing the response of vasoconstrictors such as Angiotensin II (AII) 46. Thus, it appears that iron being free can aggravate oxidative stress in individuals in HD and, consequently, contribute to atherosclerosis and oxidative stress.
Another important finding is that anemia is a common complication observed in renal patients and the administration of recombinant human erythropoietin (RHE) and intravenous iron are recommended by the Kidney Disease Outcomes Quality Initiative (KDOQI) Clinical Practice Guidelines 47. Previous studies have indicated that anemia acts as a contributing factor associated with CKD and oxidative stress, while adjuvant therapies, mainly intravenous (i.v.) iron, seem to further increase this process 48. However, in our study, mean values of ferritin higher than 500 ng/mL were observed in those individuals with high NO concentrations and adequate Fe and SatFe values in the majority of participants, remembering that Fe supplementation in this population is common. Since ferritin with higher values in the group of individuals with high NO concentration and eNOS stimulating the synthesis of ferritin to sequester the free Fe 49 we could suggest that there is an adequate production of NO with vasodilator function in this population.
Finally, in the present study, mGSA presented significantly higher scores, corresponding to malnutrition status, being statistically significant at low NO concentrations (p = 0.012). In this sense, the pro-inflammatory state, oxidative stress, endothelial dysfunction and malnutrition resulting from these pathological processes are common to CKD. mGSA is a reliable tool for assessing early malnutrition 50. The presence of malnutrition may contribute to the reduction of NO synthesis, release and activity by eNOS, activating several components of the atherogenic process, such as vasoconstriction 51. The study by Silva et al. corroborates with these findings, since they observed a blockade in the transport of L-arginine and synthesis of nitric oxide, being this one associated with the increase of the platelet aggregation in individuals with malnourished DRT 52. In our study, there was no association between the markers of body composition and NO. One explanation for this result is that the majority of study participants presented normal albumin values. In this sense, Danielski et al. 53 demonstrated that inflammatory and oxidative stress markers were increased in patients with hypoalbuminemia when compared to normoalbuminemic patients. In addition, our samples presented in majority normal weight and adequate body fat mass. Thus, the lack of association between oxidative stress and body fat composition markers may be influenced by the low prevalence of malnutrition or by the antioxidant effect of albumin.
In conclusion, the present cross-sectional study showed a significant association of NO with markers of lipid and iron metabolism, as well as with inflammatory markers (IL6 and IL10) and oxidative stress (SOD) in HD patients, indicating its important risk mediator of this population. In addition, the clinical-nutritional status and nutrient consumption with antioxidant properties (Cu, Zn, Mn, vitamin C and ω3) seem to modulate this relationship.

