


 Servicios personalizados
 Inglés (pdf)
 Articulo en XML
 Referencias del artículo
 Enviar articulo por email
 Citado por SciELO
  Citado por Google
  Similares en
SciELO
Similares en
SciELO  Similares en Google
 Permalink
INTRODUCTION
Snack foods are substantial contributors to daily energy intake. In a study, more than 80 % of participants reported snacking at least once per day, and more than 50 % of participants reported snacking multiple times per day (1). Investigators have demonstrated that subjects commonly choose chocolate, bakery goods, sweets, milk products, salad products and cookies during snacking episodes (2). Some researchers (3,4) reported that obese subjects consume snacks more frequently than healthy-weight subjects do. The composition of snack foods likely influences the overall effects that snacking has on metabolism and obesity.
Obesity represents a major pandemic with a multifactorial origin, showing an association with various cardiovascular risk factors, high mortality, and high healthcare costs (5). Metabolic syndrome accompanies obesity and worsens the prognosis of these patients, increasing their cardiovascular risk. Diet plays a major role in preventing and managing metabolic syndrome (6). One of the problems with dietary therapy is lack of patient adherence, as well as lack of perception of the benefits provided by the control of cardiovascular risk factors. One possibility is including in the diet snacks containing fiber or new ingredients to control satiety and dietary intake (7). Marine algae could be one of these new ingredients. Marine algae are divided into two groups, namely macroalgae (seaweed) and microalgae. Macroalgae are rich in minerals, vitamins, dietary fiber, proteins, polysaccharides, and polyphenols. These algae are divided into three classes — brown (phaeophytes), red (rhodophytes), and green (clorophytes). Brown seaweeds contain bioactive compounds such as polyphenols, omega-3 fatty acids, fucosterol, and fucoxanthin. These components have several properties, including anti-inflammatory, anti-diabetic, and antihypertensive activity (8). Undaria pinnatifida, commonly known as wakame, is a species of brown seaweed containing valuable bioactive organic compounds including fucoxanthin (8). Some observational studies reported that elderly people who consume more seaweed have lower blood pressure (9,10) as compared to individuals with lower seaweed intakes. Seaweed supplements of wakame have been used in clinical hypertension trials, obtaining a reduction of systolic and mean blood pressure (11,12). In another interventional study (13), consumption of wakame sporophylls reduced postprandial glucose concentrations.
Moreover, a high-fiber diet has been linked to decreased cardiovascular risk factors (14). But little is known about the effect of insoluble fiber on these cardiovascular risk factors, especially on blood lipids. The carob tree fruit has a high content of insoluble fiber and is supposed to have beneficial effects on human health (15). For example, in a one-arm study a carob pulp preparation reduced low-density lipoprotein (LDL) cholesterol in human beings (16).
The objective of the current study was to assess the responses to two different snacks, one of them enriched with wakame and carobs, on cardiovascular risk factors, satiety, and subsequent food intake in obese subjects with metabolic syndrome.
MATERIAL AND METHODS
Forty obese subjects were recruited from the community in a randomized, double blind, placebo-controlled, parallel arm study; recruitment started in January 2018 and follow-up was completed in July 2018. The recruited subjects fulfilled the following criteria: presence of metabolic syndrome according to ATP III criteria (17) and body mass index (BMI) ≥ 30 kg/m2; no history of coronary events, thyroid disease, renal or hepatic disorders, alcoholism, or malignant tumors; and no medications known to affect lipid levels received within 6 months before the study (hormonal therapy, glucocorticoids, anti-inflammatory drugs). Potential obese patients with metabolic syndrome were excluded if they were pregnant or taking any of the following medications: statins, fibrates, resins, sulfonylureas, biguanides, thiazolidinediones, insulin, glucocorticoids, alpha-blockers, converting enzyme inhibitors, and angiotensin II receptor antagonists. Subjects needed to fulfill at least 3 of the following 5 criteria to be diagnosed with metabolic syndrome: elevated fasting glucose or treatment for diabetes, elevated triglycerides (> 150 mg/dL) or treatment for dyslipemia, low HDL-cholesterol < 40 mg/dL [males] or < 50 mg/dL [females], elevated systolic or diastolic blood pressure (> 130/85 mmHg or antyhipertensive treatment), and increased waist circumference (WC) (> 94 cm [males] or > 80 cm [females]).
The Hospital Ethics Committee (HCUVA Committee) approved the study, which was in accordance with the guidelines laid down in the Declaration of Helsinki. All participants provided their written informed consent. The study was registered in www.clinicaltrial.gov with code number NCT03420989.
PROCEDURE AND SATIETY SCORES
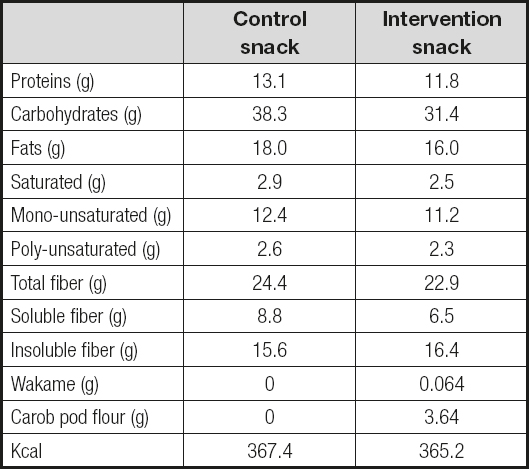
Patients were randomized (table of numbers) to one of the following two groups: snack I (enriched with wakame and carob pod flour, see table I) or snack II (control snack, see table I). Each patient received a total of 50 grams of either product per day (two packages of 25 g per day), and completed 8 weeks of treatment. Snack intake was controlled for 8 weeks, every week, and patients were instructed to eat their snacks along the day. The methodology was a double-blind, placebo-controlled, parallel arm study where neither the patient nor the investigator who followed the patient knew which type of snack had been asigned. Only the patients who took more than 80 % of the snacks dispensed were analyzed.
Patients reported to the laboratory at the same time each day following a 10-h fast. Before starting the dietary intervention and at the end of the protocol weight, fat mass, blood pressure, fasting blood glucose, C-reactive protein (CRP), insulin, insulin resistance (HOMA-R), total cholesterol, LDL-cholesterol, HDL-cholesterol, triglycerides, thyroid-stimulating hormone (TSH), and adipokine (leptin, resistin, adiponectin) levels were measured.
After their arrival at the laboratory patients were interviewed to ensure that they followed the dietary protocol prior to the visit. Subjects rated their feelings of satiety/hunger using a scoring system graded from minus 10, to represent extreme hunger, to plus 10, to represent extreme satiety (18). Subjects were shown a scale with 20 graduations, and asked to indicate how they felt regarding hunger or satiety by pointing to the appropriate place along the scale. The scale was punctuated with phrases describing various degrees of hunger and satiety, but subjects were free to choose any point along it. A 100-mm, 5-point visual satiety scale (19) was used, too. Patients were instructed to place a single vertical line on the scale, representing their feeling in response to 5 questions (grade of hunger, grade of satiety, grade of fullness, desire to eat some food, desire to eat something fatty, salty, sweet, or savory). The scale was anchored at 0 with “nothing at all” and at 100 with “a large amount” .
Both hunger and satiety scores were recorded before a test meal of 25 grams of snacks, immediately after it, and at 20 and 40 minutes after starting the meal. Patients were instructed to eat the test meal (25 grams of snacks) in less than 10 minutes with 150 mL of water.
BIOCHEMICAL DETERMINATIONS
Fasting venous blood samples were taken for measurements of fasting glucose, total cholesterol, triglycerides, low-density lipoprotein-cholesterol (LDL-c) and high-density lipoprotein-cholesterol (HDL-c) using a biochemical auto-analyzer (Hitachi 7060, Tokyo, Japan). LDL-cholesterol was determined using Friedewald’s formula (20). Fasting glucose was determined by the enzymatic colorimetric method using glucose oxidase. Fasting insulin was measured using the radio-immunoassay method (RIA) (RIA Diagnostic Corporation, Los Angeles, CA, USA) with a sensitivity of 0.5 mIU/L (normal range, 0.5-30 mIU/L) (21). We calculated the homeostasis model assessment of insulin resistance (HOMA-IR) as follows: HOMA-IR = (insulin x glucose)/22.5 (22). C-reactive protein (CRP) was determined by immunoturbimetry (Roche Diagnostics GmbH, Mannheim, Germany), with a normal range of (0-7 mg/dL) and analytical sensitivity of 0.5 mg/dL.
Leptin was determined by ELISA (Diagnostic Systems Laboratories, Inc., Texas, USA) (DSL1023100), with a sensitivity of 0.05 ng/mL, a normal range of 10-100 ng/mL, and a CV % of 3.5 % (23). Adiponectin was determined by ELISA (R& D systems, Inc., Minneapolis, USA) (DRP300) with a sensitivity of 0.246 ng/mL, a normal range of 8.65-21.43 ng/mL, and a CV % of 3.8 % (24). Resistin was determined by ELISA (Biovendor Laboratory, Inc., Brno, Czech Republic) (RD191016100) with a sensitivity of 0.2 ng/mL, a normal range of 4-12 ng/mL (25), and a CV % of 3.2 %. TSH was determined by ELISA (Biovendor Laboratory, Inc., Brno, Czech Republic) (ab100660) with a sensitivity of 0.1 IU/L, a normal range of 0.4-4.5 IU/L, and a CV % of 3.8 %.
BLOOD PRESSURE AND ANTHROPOMETRIC PARAMETERS
Mean systolic and diastolic blood pressures were calculated by averaging three measurements (Omrom, LA, CA, USA) after the subjects had sat for 10 minutes. Body weight was determined in the morning with the subjects minimally unclothed and wearing no shoes. They were measured using digital scales (Omrom, LA, CA, USA), and recorded to the nearest 50 g. Height was measured with a tape measure (Omrom, LA, CA, USA) while the patients were standing with their shoulders in normal alignment and wearing no shoes. Body mass index (BMI) was calculated as body weight (in kg) divided by height (in m2). Waist circumference (WC) was measured at the umbilical level with the use of an upstretched tape measure. Bio impedance was used to determine body composition with an accuracy of 5 g (26) (EFG BIA 101 Anniversary, Akern, Italy). This equation was used: 0.756 Height2/Resistance) + (0.110 Body mass) + (0.107 Reactance) - 5.463.
DIETARY INTERVENTION
Before and after the intervention with snacks (two packages of 25 g per day), patients received prospective serial assessments of nutritional intake with written food records for 3 days. All enrolled subjects received instructions to record their daily dietary intake for three days including a weekend day. The handling of dietary data was by means of a personal computer equipped with personal software, incorporating the use of food scales and models to enhance portion size accuracy. The records of intake and consumption of snacks were reviewed by a dietician and analyzed with a computer-based data evaluation system. National food composition tables were used as reference (27). The exercise allowed was aerobic, which was previously done by patients before entering the study, mainly walking.
GASTROINTESTINAL EFFECTS
At dietary intervention patients were asked whether they considered their bowel habits had changed either quantitatively or qualitatively. For a qualitative evaluation, they were asked in the last visit whether they considered that the introduction of the snack in their diet could have induced diarrhea (yes/no), meteorism (yes/no), or vomiting (yes/no). For a quantitative evaluation, they were asked about their number of stools per day.
STATISTICAL ANALYSIS
Sample size was calculated to detect a difference in LDL-cholesterol of 5 % after treatment with a 90 % power and an alpha error of 5 % (n = 15 in each group). The results were expressed as mean (standard deviation). The normality of variables was analyzed by the Kolmogorov-Smirnov test. Quantitative variables with normal distribution were analyzed with Student’s t-test for both paired and unpaired variables. Variables without normal distribution were analyzed with Wilcoxon’s W-test. The ANOVA test was used as needed, with Bonferroni’s test as post-hoc test. Qualitative variables were analyzed using the chi-squared test with Yates’ correction when appropriate, and Fisher’s test. The area under the response curve (AUC) for both hunger/satiety scores with the test food (25 g of snacks) was calculated using the trapezoidal method. The strategy of analysis was by intention to treat. A p-value lower than 0.05 was considered statistically significant. All statistical analyses were performed using the SPSS (version 19.0) software.
RESULTS
Forty patients were included in the protocol (Fig. 1, Consort diagram), 32 patients finished the study. The 8 patients excluded from the analysis had taken less than 80 % of the prescribed snacks. Distribution included group I (enriched snack, 8 males and 8 females with a mean age of 50.7 ± 10.2 years) and group II (control snack, 7 males and 9 females with a mean age of 51.4 ± 10.3 years). No differences in gender or age distribution was observed.

BIOCHEMICAL AND ANTHROPOMETRICAL PARAMETERS
The values of anthropometric and biochemical parameters are shown in table II and table III, respectively. No differences were detected in anthropometric parameters with the dietary intervention. Anthropometric parameters after the introduction of snacks in the patients’ usual diet did not change any parameter (Table II). This finding is logical because the inclusion of patients in the protocol did not alter total energy intake from their diet. With respect to biochemical values after the introduction of snacks on the patients’ usual diet (Table III), changes were identified in patients with enriched snacks, with a significant decrease in LDL-cholesterol by 7.4 % (intervention snack, -8.9 ± 2.3 mg/dL vs control snack, -0.9 ± 3.3 mg/dL; p = 0.03), in total cholesterol by 5.8 % (intervention snack, -10.4 ± 2.9 mg/dL vs control snack, -1.4 ± 3.2 mg/dL; p = 0.02), and in resistin by 15.9 % (intervention snack, -1.0 ± 0.2 mg/dL vs control snack, -0.1 ± 0.3 mg/dL; p = 0.03).
Table II. Anthropometric parameters and blood pressure

BMI: body mass index; WC: waist circumference; SBP: systolic blood pressure; DBP: diastolic blood pressure. No statistical differences within the intervention group or between groups.
Table III. Biochemical cardiovascular risk factors, TSH, and adipokine levels

Ch: cholesterol; LDL: low-density lipoprotein; HDL: high-density lipoprotein; TG: triglycerides; CRP: C-reactive protein; HOMA-R: homeostasis model of assesment; TSH: thyroid-stimulating hormone.
*Statistical differences in the same snack group after intervention. No statistical differences between both groups.
DIETARY INTAKE EFFECTS
In the evaluation of dietary intake variables no statistically significant differences in baseline values were detected between the two groups of snacks (Table III). With respect to the values after the introduction of snacks on the patients’ usual diet, in patients with both snacks a significantly increase in total fiber and soluble fiber dietary intakes was identified, as expected (Table III).
The percentage of consumed snack packages after 8 weeks of intervention was 97.8 % in the intervention snack group, and 96.6 % in the control snack group.
SATIATING EFFECTS
Immediately before the test meal, the baseline hunger/satiety score (18) (Table IV) was similar with both the intervention and control snacks; the data after 8 weeks of treatment were similar in both groups, too. After the test meal, the baseline AUC of this hunger/satiety score was similar both the with intervention and control snacks, and the data after 8 weeks of treatment were also similar. In both groups the scores (20 min and 40 min) were higher than the fasting level.
Table IV. Dietary intakes and exercise

CH: carbohydrates; Fat-S: fat, saturated; Fat-M: fat, mono-unsaturated; Fat-P: fat, poly-unsaturated.
*Statistical differences in the same snack group after intervention. No statistical differences between both groups.
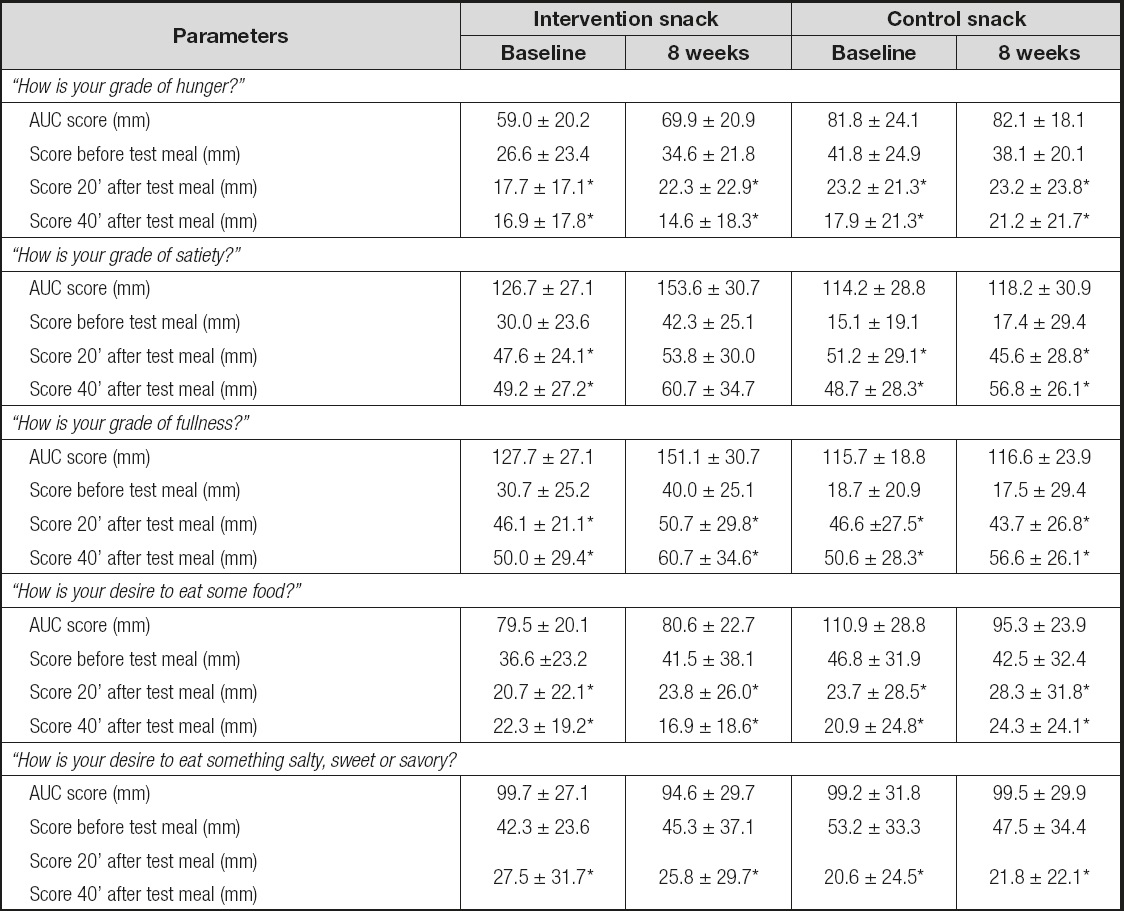
The results obtained were similar with the 100-mm, 5-point visual satiety scale (19) (Table V). When asked “How is your grade of hunger? ,” “How is your desire to eat some food? ,” and “How is your desire to eat something salty, sweet, or savory? ” after 20 min and 40 min, the subjects responded that they wanted to eat less with both snacks, without statistical differences between them. After the test meal, the baseline AUCs for these questions were similar for both snacks.
Table V. Satiety/hunger using a scoring system graded from minus 10, to represent extreme hunger, to plus 10, to represent extreme satiety
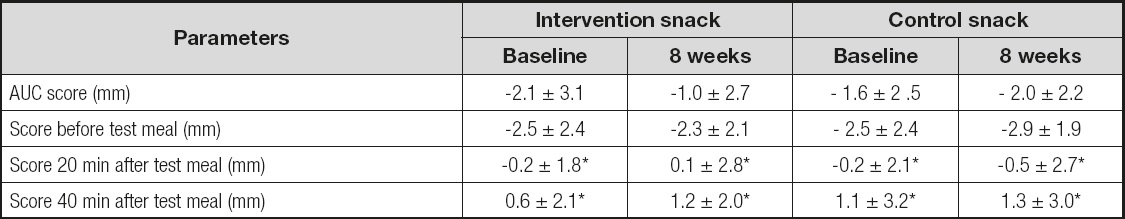
AUC: area under the curve. No statistical differences between snack groups.
*Statistical differences in the same snack group (baseline or 8 weeks).
When asked “How is your grade of satiety? ,” and “How is your grade of fullness? ” (Table V) after 20 min and 40 min, the subjects gave higher scores with both snacks, without statistical differences between snacks. After the test meal, the baseline AUCs for these questions were similar for both snacks.
GASTROINTESTINAL EFFECTS
As regards the effects induced on the digestive tract, no episodes of diarrhea, meteorism, or related vomiting were reported (Table VI). The number of stools per day was similar with both snacks, without changes after the intervention.

DISCUSSION
The results of our study indicate that a wakame- and carob-enriched snack promoted a greater decrease in total cholesterol, LDL-cholesterol, and resistin levels than the control snack, but daily food consumption, other cardiovascular parameters, and anthropometric parameters were not significantly affected.
The difference between both snacks is the presence of a small amount of wakame and the use of carob flour in the preparation of the intervention snack. Therefore, the biochemical differences seen in our study may be due to any of the two added nutrients. Previously, some studies were conducted in humans with wakame. For example, Tanemura et al. (13) demonstrated that the consumption of a high amount of mekaku, another brown seaweed (40 g per day), with a white rice-based breakfast reduced postprandial glucose concentrations in a group of twelve healthy subjects. In this study (13), wakame (70 g per day) did not show this antidiabetic effect. These findings indicate the potential role of some brown algae as anti-diabetic food. The lack of effect of wakame on glucidic metabolism is consistent with the findings of our study.
Teas et al. (28), in 27 subjects with at least one symptom of metabolic syndrome, reported a decrease in systolic blood pressure and waist circumference after treatment with 6 g per day of seaweed powder (77 μg of wakame) for 4 weeks. In our study, we did not find any differences in blood pressure or anthropometric variables, probably due to the lower dose of wakame used in the intervention snack. Teas et al. (28) proposed two potential mechanism to explain their interesting results: upregulation of the uncoupling protein (UCP-1), and a direct effect of fucoids (the sulphated polysaccharides found almost exclusively in brown seaweeds) on adipose cell differentiation (29).
To date in the literature, a direct effect of wakame on the lipid profile has not been described in human beings. Only one study in rats with a high dose of wakame sporophylls (30) showed a modest improvement in total cholesterol and very low-density lipoprotein-cholesterol. Therefore, we surmise a direct effect of carob flour on the metabolic changes included in our design. Previously, Papakonstatinou et al. (31) demonstrated in a randomized, cross-over study (50 healthy subjects) that consumption of a carob snack as preload decreased the glycemic response to a following meal as well as hunger sensation. The preload carob snack was 65 g (a higher amount than our snack), and the composition of this snack had 65 g of carob powder per 100 g, whereas our snack had only 3.6 g per 100 g. These differences in grams between test meals and snack composition could explain the lack of results on satiety and glucose metabolism in our protocol. Bañuls et al. (32) showed that supplementation for 12 weeks with a carob-enriched beverage also induced a significant improvement in glucose metabolism parameters in healthy subjects. In the two previous studies (31,32) lipid metabolism was not explored. Later, Zurift et al. (33), in a randomized, double blind clinical trial of a carob preparation in 58 hypercholesterolemic subjects with a 6 week intervention phase, reported a significant decrease in LDL-cholesterol (10.5 %). The intervention was shorter than ours but the total daily amount of carob was higher than in our design (15 g per day of carob pulp preparation).
In another randomized clinical trial Ruiz-Roso et al. (34) reported that consumption for 4 weeks of 8 g of insoluble fiber from carob (enriched milk) produced beneficial effects on the human lipid profile with a reduction in LDL-cholesterol (22.5 %). This study was performed in volunteers with hypercholesterolemia. The mechanism involved in the reduction of LDL-cholesterol by dietary fiber from carob is a sum of several effects: a reduction in the absorption of fats, an increase in the synthesis and excretion of bile acids, an inhibition of the endogenous synthesis of cholesterol from short fatty acids generated in the large intestine, and modifications in the amount of hepatic LDL receptors (34,35). The effect on LDL-cholesterol levels in these previous studies (33,34) was higher than in our design, which may be explained by the fact that all these potential mechanisms were enhanced in subjects with higher levels of cholesterol (hypercholestoremic subjects) when compared to subjects with average basal values, as was the case with our obese subjects with metabolic syndrome. Another possible explanation is that our snack contained carob pod flour, unlike other studies that used carob pulp.
It is important to point out that the intervertion for 8 weeks with a functional snack caused a decrease in resistin levels. Possibly, as described in other studies, the effect of wakame on adipocytes (29) may be explained with a paracrine or autocrine action, without affecting total body fat. In the previously reviewed studies with wakame or carob no levels of adipokines were ever determined, therefore we cannot compare our results with theirs (28-36). Only one study in rats (37) reported, after high-dose supplementation with wakame, an increase in adiponectin serum concentration and expression, as well as a downregulation of IL-6 expression.
This heterogeneity of results in the literature after carob and wakame supplementation could be explained by different factors. For example, we could first mention the heterogeneity of the populations involved (obesity, diabetes, hyperlipidemia, healthy subjects, gender, and so on); secondly the daily amount of wakame or carob administered, and the type of food (functional food, rice, solid, beverage, and so on), were different; finally, there was variability in intervention regimen time. However, the results on LDL-cholesterol were significant when carob was used in the interventions. So, we could summarize this group of studies by noting that in the literature beneficial effects on LDL-cholesterol have been identified with the use of carob, without any side effects as demonstrated with our design. We also have to take into account that the effect of other snack ingredients may also be important in the observed results, such as the amount of fat or its quality. Despite all the biological effects of wakame and carob mentioned in this and other studies, it is necessary to take into account that the potential healthy effect of these foods is supervised by the EFSA (European Food Safety Authority), and to date they have issued no favorable opinion on wakame or carob.
Limitations in our study include a small sample size and, secondly, the type of subjects enrolled (obese subjects with metabolic syndrome), the latter rendering our results not extrapolable to the general population. Thirdly, the low dose of wakame makes it difficult to observe effects on glucose metabolism, as has been demonstrated in other studies. Another limitation is the lack of intervention branches to analyze the snack with the functional ingredient individually, that is, a snack containing only wakame and a snack containing only carob. Finally, the presence of a high amount of fiber in the control snack allowed no differences to be shown on satiety between snacks.
In conclusion, our study indicates that a wakame- and carob-enriched snack induced a significant decrease in total cholesterol, LDL-cholesterol, and resistin levels as compared to a control snack, without any effects on food consumption, other cardiovascular parameters, and anthropometric parameters. Further research must be designed to evaluate different enriched foods with wakame and carob, and their potential effects on metabolism. Additionally, the acceptance by the population of this type of food was evaluated, which in our case was good during the clinical trial and in a previous sensory evaluation that had been carried out with healthy volunteers.

