


 Servicios personalizados
 Inglés (pdf)
 Articulo en XML
 Referencias del artículo
 Enviar articulo por email
 Citado por SciELO
  Citado por Google
  Similares en
SciELO
Similares en
SciELO  Similares en Google
 Permalink
INTRODUCTION
Patients with cerebral palsy (CP) are surviving now longer than in the past thanks to improved living conditions and medical treatment. Mortality decreased by 3.4 % per year between 1983 and 2002 in a large cohort in California (1), and today most children with CP reach adulthood, with severity of motor disability being their main predictor of survival (2-4). Motor disability is closely related to malnutrition (5), and malnutrition influences prognosis, as the specific growth curves for children and adolescents with CP demonstrated (6). These curves indicated a higher morbidity and mortality among those with severe motor disability and weight/age index (W/A) below the 20th percentile, as well as among those with mild disability and W/A below the 5th percentile. Gastrostomy tube feeding is associated with higher morbidity and mortality (7), although it may be an indicator of greater medical fragility rather than an independent risk factor for poor prognosis (1,2,8). Limited access to health care and lower familial socioeconomic level also have an influence (2).
An emerging prognostic factor among individuals with CP is obesity and body fat excess. In children aged 6 to 15 years of age with CP and mild motor disability, obesity rates increased from 7.7 % in 1994-1997 to 16.5 % in 2003-2004 (9). It has also been reported that children with spastic quadriplegia CP have higher levels of fatty infiltration of skeletal muscle, attributable to physical inactivity (10). There is currently no standard definition of obesity and body fat excess for children with disabilities (11); while body mass index (BMI) and subcutaneous fat estimation using skinfold measurement may underestimate body fat, a combination of both may improve the accuracy of nutritional evaluation in CP patients (12,13).
Adults with CP and obesity develop metabolic complications and a higher cardiovascular risk, particularly those who are non-ambulatory and have abdominal obesity (14). In children with CP and mild motor disability, cardiorespiratory fitness is inversely correlated with BMI and central obesity (12,15). Overweight increases the risk of dyslipidemia and high blood pressure in adults with CP (16), but the evidence in the pediatric population is scarce. Physical inactivity and overconsumption of calories are the main factors leading to obesity among people with CP. It can be exacerbated as most of them need only 60-75 % of the daily energy requirements recommended for the general population except for patients with serious spasticity or dystonic movements (17-20). Another risk factor is the use of antiepileptics, that may favor obesity, dyslipidemia, and hyperinsulinism (21).
The objective of this study was to describe the frequency of overweight/obesity and associated metabolic complications in children and adolescents with CP.
SUBJECTS AND METHODS
This descriptive, cross-sectional study was performed between April 2014 and March 2015. A convenience sample of children and adolescents with CP was enrolled at two outpatient clinics for children and adolescents with special healthcare needs, in the Sótero del Río and Padre Hurtado Hospitals, Santiago, Chile. The primary caregiver was invited to participate, by telephone or verbally, after a routine checkup visit. Patients aged 2-20 years, diagnosed with CP by a pediatric neurologist, were included (22). Those without an anthropometric evaluation (weight and height) or with an acute illness or hospitalization within the previous month were excluded.
Data on demographic characteristics, primary caregiver, feeding route (oral, nasogastric tube, gastrostomy tube), use of antiepileptics or other drugs, and use of nutritional supplements were recorded. Mobility was evaluated using the Gross Motor Function Classification System, GMFCS (23). Levels I and II were classified as “mild motor impairment” and levels III to V as “moderate-to-severe impairment.”
For the anthropometric evaluation, patients were measured by two evaluators (CS, MF). Patients were weighted on a scale, or chair-scale (Seca®) if unable to stand. Standing height was measured if possible (GMFCS I-III); otherwise, length was measured in complete extension (GMFCS III-V) or estimated based on tibial length, if it was not possible with the above methods (6 patients in group V) (24). CP-specific reference curves were used (6), including the following indexes: weight for age (W/A), height for age (H/A), and BMI by age, sex and GMFCS. The nutritional status of each patient was classified according to the following ranges: W/A = p5-75th was classified as “normal” in children with GMFCS I to IIII, or W/A = p20-75th for GMFCS IV and V; W/A < p5th or p20th, respectively, was classified as “at nutritional risk”; W/A > p75th was arbitrarily classified as “overweight”; and for BMI, < p10th was considered “underweight,” BMI p10th to p74th as eutrophic, and BMI ≥ p75th as “overweight/obese.” Finally, H/A = p5-p95th was classified as normal height.
Fasting venous blood samples were used to measure glycemia (GLY) according to the enzymatic method (Roche/Hitachi system). Insulinemia was measured using an electro-chemiluminescent immunoassay (Roche Cobas 8000®), and triglycerides (TG) and total plasma cholesterol (TC) were measured using the enzymatic colorimetric method (Roche/Hitachi). Plasma 25-hydroxyvitamin D (25OHD) was measured using liquid chromatography tandem-mass spectrometry (LC-MS/MS). All samples were processed at the same certified laboratory. The following values were considered abnormal: TC ≥ 200 mg/dL was considered “high” and TC = 170-200 mg/dL “at risk”. TG: ≥ 110 mg/dL was considered “high” in children under 10 years of age, or ≥ 130 mg/dL in children 10 years or older; TG = 75-99 or 90-129 mg/dL were considered “at risk,” respectively (25). GLY ≥ 100 mg/dL, HOMA index ≥ 3 and insulin ≥ 17 μg/dL were considered “high” (26). Normal vitamin D (sufficiency) was defined as 25OHD ≥ 30, insufficiency as 21 to 29, and deficiency as ≤ 20 ng/mL (27).
STATISTICAL ANALYSIS
Descriptive statistics were calculated for all variables, including absolute and relative frequency for categorical variables. For continuous variables, a Ryan-Joiner normality test was performed; variables with a normal distribution were expressed as average ± standard deviation (SD), and variables without a normal distribution as median and interquartile range (IQR: p25th;75th). For comparisons between numerical variables, Student’s or nonparametric tests (Mann-Whitney) were used (for normal or non-normal distributions, respectively). For the association analysis, Pearson’s or Spearman’s correlation methods were used. Metabolic variables were treated as dependent variables, and age, gender, nutritional diagnostic, motor function, 25OHD, and antiepileptics use as independent variables. Chi2 and Fisher’s exact tests were used to compare the frequency of risk factors between groups. For comparisons, the metabolic category “at risk” was joined to “high”. Univariate and multiple regression test were applied. A p-value < 0.05 was considered significant. Statistical analyses were performed using the software package MINITAB 17®.
ETHICAL STATEMENT
This study complied with all norms in the Declaration of Helsinki (2013). Approval for this study was granted by two Ethics Committees, those of the Universidad Católica de Chile (N° 14-124) and the Public Health System (8-22-2013). Caregivers signed an informed consent document. Participants with cognitive impairment were not asked for an assent.
RESULTS
The sample included 65 patients. Average age was 10.8 ± 4.9 years, 63.1 % were male, 29.7 % had a premature birth, and median birthweight was 3125 g (IQR: 2,120; 3,715).
In terms of motor function, 6 patients (9.2 %) were in level I, 2 (3.1 %) in level II, 4 (6.1 %) in level III, 12 (18.5 %) in level IV, and 41 (63.1 %) in level V. Their feeding route was oral (49.2 %), via gastrostomy (37 %), through a nasogastric tube (6.1 %), or mixed (7.7 %). Most patients (75.4 %) were taking antiepileptics, 34.9 % were taking one, 28.8 % two, and 20.3 % three or more medications. In total, 28.1 % were taking valproic acid, and 43.8 % were taking enzyme-inducing antiepileptic drugs, including phenytoin, phenobarbital, or carbamazepine.
Only 23.1 % had normal 25OHD (sufficiency), 49.2 % had vitamin D insufficiency, and 27.7 % had vitamin D deficiency.
Regarding nutritional assessment: 17.2 % had W/A within the range of nutritional risk (6), 62.5 % were eutrophic, and 20.3 % had overweight. According to their BMI, 15.4 % were underweight, 73.8 % were eutrophic, and 10.8 % had overweight. In terms of height, 4.6 % were tall and 95.4 % were normal.
Table I shows the results obtained for the cardiovascular risk factors studied, and figure 1 illustrates the frequency of metabolic variables in the ranges of normal, at-risk, and abnormal.
Table I. Metabolic variables in 65 children and adolescents with cerebral palsy

HOMA IR: HOmeostasis Model Assessment index for Insulin Resistance; 25OHD: plasma 25-hydroxyvitamin D.

Figure 1. Frequency of metabolic factors in 65 children and adolescents with cerebral palsy.Total cholesterol (TC): acceptable (< 170 mg/dL), at risk (170-200 mg/dL) or high (≥ 200 mg/dL). Triglycerides (TG): acceptable (< 75 mg/dL in children under 10 years of age, or < 90 mg/dL in children 10 years or older), at risk (75-99 or 90-129 mg/dL) or high (≥ 100 or 130 mg/dL), respectively (). Glycemia (GLY): acceptable (< 100 mg/dL) or high (≥ 100 mg/dL). HOMA index: acceptable (< 3) or high (≥ 3). Vitamin D (25OHD): acceptable (≥ 30 ng/mL), at risk (21 to 29 ng/mL) or abnormal (≤ 20 ng/mL).
A univariate analysis was performed to study the association of each metabolic variable with different factors. Female patients had a higher frequency of IR than males: 9/24 (37.5 %) vs. 2/41 (4.9 %), chi2 p = 0.001; HOMA and insulinemia were higher in females than males: median 2.2 (1.2; 3.3) vs. 1.5 (1.0; 2.2), p = 0.035, and 9.85 (5.6; 15.9) vs. 7.5 mg/dL (4.6; 10.3), p = 0.03. Females had also higher triglyceride levels: 91.5 (74; 112.7) vs. 77 mg/dL (53.5; 101), p = 0.028. There was no difference according to gender for TC, GLY, and 25OHD, nor between age and all the metabolic variables.
In terms of motor function, TGs and insulinemia were higher among patients with moderate to severe impairment than among those with mild impairment; HOMA had a similar, but non-significant tendency (Table II).
Table II. Metabolic variables in 65 children and adolescents with cerebral palsy, according to their motor function disability score (GMFCS)

*p < 0.05 (a Student’s test, b Mann-Whitney test, c chi-squared test).
For nutritional status, there was no association between W/A and any of the metabolic variables; however, BMI had a direct correlation with TC (Pearson’s r: 0.29, p = 0.021), and as shown in table III, children with BMI ≥ p75th had higher HOMA, and IR frequencies than those with BMI < p75th. There was no difference between the group with BMI ≥ p90th and that with BMI < p90th regarding any of the metabolic variables.
Table III. Metabolic variables in 65 children and adolescents with cerebral palsy, according to their nutritional status (BMI, Brooks 2011)

*p < 0.05 (a Student’s test, b Mann-Whitney test, c chi-squared test); † Low 25OHD: ≤ 30 ng/mL (insufficiency + deficiency).
Patients who used antiepileptics had a tendency to higher insulinemia than those who did not use them: 9.1 (6.1; 11.8) vs. 5.7 (4.02; 9.6) ng/dL, p = 0.059, as well as a higher HOMA: 2.01 (1.22; 2.7) vs. 1.27 (0.80; 1.92), respectively, p = 0.06, and a higher frequency of IR: 11/49 (22 %) vs. 0/13 (0 %), chi2 p = 0.03, but there were no associations between use of antiepileptics and other metabolic variables, or any differences between specific drugs.
Patients with low vitamin D levels (deficiency + insufficiency) tended to have higher TGs than those with normal vitamin D (Fig. 2). The proportion was: 25/50 (52 %) versus 3/15 (20 %), respectively (chi2, p = 0.04). Vitamin D was not associated with the other metabolic variables.
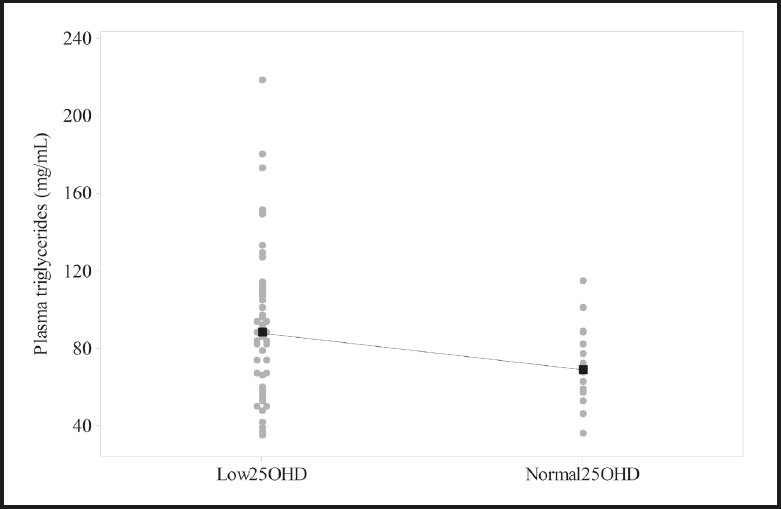
Figure 2. Plasma triglycerides according to vitamin D status in 65 children and adolescents with cerebral palsy.Medians (black squares) are connected by a dotted line. Vitamin D (25OHD): normal (≥ 30 ng/mL), Low (< 30 ng/mL). *p = 0.06, Mann Whitney test.
There was a direct correlation between TG and HOMA levels, but this association did not reach the level of significance (Spearman’s r: 0.15, p = 0.23); however, TGs were higher among patients with IR: 78.0 (IQR: 56.5; 102) vs. 111 (88; 151), Mann-Whitney test, p = 0.003.
Finally, a multiple regression analysis was performed to identify the factors underlying high TG concentrations—the following variables were included: sex, BMI, GMFCS and vitamin D status. Only motor function (p = 0.007) and vitamin D status (p = 0.025) contributed significantly, and the model had an R2 = 29.05 % and an adjusted R2 = 23.04 % (p = 0.001). Regarding HOMA, the variables were gender and BMI status: both contributed significantly (p = 0.004 and 0.029, respectively) to HOMA variation in the final model (p = 0.002), with an R2 = 17,6 % and an adjusted R2 = 14.97 (p = 0.002).
DISCUSSION
This study explored the metabolic morbidity associated with overweight in 65 children and adolescents with CP. There was a high frequency of dyslipidemia and insulin resistance in this sample, with rates comparable to those of the general population. Severity of motor disability and vitamin D deficiency were associated with elevated plasma triglycerides, while gender and BMI ≥ p75th (with CP-specific curves) were associated to insulin resistance.
The high frequencies of elevated TC (6.1 %) and TG levels (21.4 %) were comparable to those of the country’s general pediatric population, reaching 4.9 and 19.5 %, respectively (28,29). This finding is somewhat surprising given the low proportion of patients with overweight in this sample, which is the main risk factor for dyslipidemia.
Most studies in children with CP have reported low rates of obesity, from 3 % to 18 % (30), but there is no consensus on the reference curves, anthropometric measurements, or cutoff points to define obesity that should be used. Furthermore, it should be noted that BMI alone is insufficient to establish nutritional status in this population, given the variations in body composition found in patients with CP, such as high body fat mass, high body fat percentage, and low lean body mass (11,20), which may be exacerbated by severe gross motor impairment (31). In this study, we used the CP-specific growth charts published by Brooks in 2011 (6), and only 10.8 % had a BMI at or above the 75th percentile. We used these curves because nutritional problems are frequent in children with CP, and they also have different growth patterns when compared to the general population, determined by non-nutritional factors that are not modifiable by optimal feeding. Finally, we chose the 75th percentile as the cutoff, which is a stringent limit, in order to include all patients with excess body fat, as the sarcopenia associated with CP can favor a low BMI even in those with excess of fat.
The prevalence of dyslipidemia reported for individuals with CP varies between 0 % and 39 % (29), attributable primarily to low physical activity (32,33). This association was observed in our sample as well, as severe motor impairment was directly correlated with TG levels. Dyslipidemia was also associated with IR in our sample, and the frequency of IR was 27.7 %, which is comparable to that of the general population (29). IR increases lipolysis and the release of fatty acids into the bloodstream, pathophysiological mechanisms underlying the development of dyslipidemias and other cardiovascular risk factors, that potentially could mediate the link between immobility and high TG levels.
It has been reported that enzyme-inducing antiepileptic drugs raise blood lipids, and that valproic acid is a risk factor for hypertriglyceridemia, likely because it increases appetite and thereby favors weight gain (34). In this sample there was no association, possibly because most of the patients had very low autonomy for eating. While patients taking antiepileptics indeed had greater frequency of IR, there was no difference between drugs, possibly due to the small sample size. As in the general population, insulinemia and HOMA were higher among females, which is attributable to differences in body composition and sexual maturity (28).
Another nutritional factor to consider is vitamin D status, as deficiencies have been widely reported for the CP population, associated with reduced exposure to sunlight, low food content, insufficient pharmacological supplementation, and use of antiepileptics (35-37). Overweight also favors vitamin D deficiency, which in turn is associated with metabolic disorders; however, these disorders improve if weight loss and/or reduction of abdominal fat are achieved, but not with vitamin D supplementation. Vitamin D insufficiency or deficiency was very frequent in this sample, associated with higher TGs, in agreement with other reports, along with metabolic syndrome (38). In our sample this association with TG levels was independent of BMI, as the multiple regression model showed a significant effect of this variable on TGs, along with a lower gross motor function.
There is scarce evidence on the deleterious effects of overweight or obesity among children and adolescents with CP. Anthropometric measurements and cutoff points should be standardized in order to improve the interpretation of results, and equations to estimate body fat mass based on skinfold measurements should be refined using results from more precise body composition studies (11,13,31,39). In this sample there was no association between various W/A cutoff points and the metabolic variables studied, but we found a correlation for BMI at or above the 75th percentile with hyperinsulinemia and IR. It has been recommended to keep the tricipital skinfold under the 50th percentile (40) in patients with neurological disorders to avoid excess fat mass, but the measurement of skinfolds is not always available. Also, they represent only the subcutaneous fat, with abdominal fat being the compartment associated with metabolic outcomes. A measurement of the abdominal perimeter was not possible in our sample, because most of the patients were not capable to stand up. In regular clinical assessments patients are always weighted, and even though stature is frequently difficult to measure, BMI is usually calculated. As in the general population, BMI is the simplest method to define excess weight in this group of patients, and we have demonstrated that a more exigent cutoff point has an acceptable relationship with some metabolic outcomes.
This is the first study in our country to explore cardiovascular risk factors in pediatric patients with CP. A major strength is the identification of a possible cutoff-point for BMI as a risk factor for IR. Sample size was large enough to demonstrate the presence of metabolic complications, the patients were evaluated by only two coauthors, according to common criteria, and the tests were performed in a certified laboratory. Limitations of this study include the use of a convenience sample and a predominance of patients with severe gross motor disability, which is not representative of the general population with CP. However, it is necessary to highlight that it is precisely in this group of patients that our knowledge is more limited regarding cardiometabolic outcomes. Height was estimated by tibial length in six patients in the GMFCS-V group, so their BMI could be slightly biased. The estimation of height with Stevenson´s equations is an accepted method to cope with this limitation of anthropometric evaluation in PC patients. It would have been helpful to measure or estimate body fat mass, but the use of a stringent BMI cutoff was fairly adequate to demonstrate an association between excess fat and hyperinsulinemia or IR, as the study included children with severe disability and lower bodyweight, but likely greater adiposity.
Worldwide, improvements in the care of patients with CP have increased their lifespan. One of such advances has been the use of gastrostomy tube feeding, as well as a greater availability of enteral formulas and supplements to optimize nutrition. However, this should not be at the expense of excess body fat due to overfeeding (20). The findings of this study underline the importance of an adequate nutritional evaluation and treatment, by trained professionals within the multidisciplinary team, to optimize nutritional status, avoiding both deficiencies and excesses, and favoring better long-term health in patients with CP.
In conclusion, among this sample of children and adolescents with CP, the frequencies of hypercholesterolemia, hypertriglyceridemia and IR were high and comparable with those of the general pediatric population. Considering these high frequencies, the low proportion of overweight or obesity according to CP-specific growth curves suggests a high body fat percentage among our patients. In terms of risk factors, motor disability and 25OHD were directly correlated with TG; also, gender and BMI were correlated with HOMA. BMI ≥ p75th was associated with higher insulinemia and IR levels, so this cutoff point could be considered a metabolic risk factor in this group, although this finding should be confirmed by further studies with a long-term follow-up.

