


 Servicios personalizados
 Inglés (pdf)
 Articulo en XML
 Referencias del artículo
 Enviar articulo por email
 Citado por SciELO
  Citado por Google
  Similares en
SciELO
Similares en
SciELO  Similares en Google
 Permalink
INTRODUCTION
Stand-up paddle boarding (SUP) originated in Hawaii in the 1950s and is a mixture of both surfing and paddling (1). In this new sport, the popularity of which has risen exponentially over the past decade (2), boarding involves a participant getting to their feet on a large board, similar to a surfboard, before using a long paddle for propulsion with strokes on either side of the body (3). However, SUP boards are longer in length (~8-15 ft, 2.4-4.6 m), thicker (4-8 in, 10-20 cm) and wider (26-31 in, 66-78 cm) than traditional surfboards (4). Propulsion of the board is through a long single-bladed paddle in which the athlete alternates sides randomly. The general disciplines of competitive SUP include technical racing, surfing, and marathon racing. Technical SUP racing consists of a 4-8 km sprint in which participants are limited to a maximum board length of 12'6” (3.81 m). Surfing events are held in heats of 20 minutes and 30-minute finals in which the top two scoring waves are counted toward the competitors total (5). Scoring is based upon performing maneuvers, creating power and speed, and getting through closing out sections in a similar manner to traditional surfing. SUP marathon races, normally over a distance of 10 km (6.21miles), allow boards up to 14' in length with a fixed fin, and can be conducted in both open ocean and flat water. The subjects analyzed in our study are participants of an international SUP marathon race.
Taking into account the physical exigency of the tests, a high level of aerobic fitness appears to be required from elite participants (6). Anaerobic fitness is essential for short speed bursts and to catch waves. A high level of dynamic balance and trunk muscle endurance is required by participants, and are both considered important attributes of any SUP participant (4). Isometric contractions of the entire trunk, gluteals, and lower leg musculature are required to counter the rotational forces from the pull phase of each paddling stroke (7).
As SUP increases in popularity and competitiveness, the importance of testing SUP athletes to provide information for both coaches and athletes increases in parallel. Despite this global popularity, there is currently not much scientific literature available on the performance aspect of SUP.
Specific physiological and morphological parameters are important components of performance in many sports. It has been confirmed that certain physical characteristics such as body composition, weight, and height can significantly influence sports outcomes (8). Also, these parameters allow nutritionists and trainers to guide both diet and training so as to achieve the body composition athletes need to attain maximum performance. These parameters have been correlated with performance in elite sport, and have been associated in rowing and surfing with performance outcomes (9-11).
Body composition (BC) and athlete morphological characteristics have been associated with performance in different sports (8), i.e., surfing (12, 13) and different paddling sports like Olympic rowing (14-16), traditional rowing (17) or kayaking (18). Excessive fat mass in a rower, in particular, would act as deadweight, and would have adverse effects on speed, resulting in a diminished ability to accelerate (13). Moreover, it is well established that greater fat-free mass and muscle mass in a high-intensity athlete leads to increased strength and endurance, hence to performance improvement (19). Likewise, in surfers moderate to large significant correlations were obtained between surfer ranking position and some skinfolds, the sum of skinfolds, and vertical jump (9). Finally, in kayaking, important values of body mass and muscle mass have been recorded, even comparable to values obtained in canoeists (20,21). It is not clear whether these high values of lean body mass may benefit or harm kayakers (18).
However, there is no study examining the anthropometrical profile of SUP boarders, which should allow coaches and sport scientists to better understand the physical profile of paddlers, and formulate appropriate training strategies (22,23). Therefore, the aims of this study are to describe the anthropometric characteristics (BC, FM, MM, and somatotype) of participants in an international SUP competition, in order to establish reference values within this population of SUP practitioners.
MATERIAL AND METHODS
SAMPLE
“The Europe Tour 2019” is recognized as the World SUP Cup. The Iberdrola Bilbao World SUP Challenge 2019 was part of this circuit and took place on June 7-9 of the same year. In this respect, for the cross-sectional design of this study, data were collected from 31 males (age, 34.2 ± 12.4 years) participating in the race. All participants were international level athletes.
Every participant received both oral and written information regarding the research objectives and methodology, and they signed an informed consent. This study was approved by the University of Deusto Ethics Committee (ETK-13/18-19).
EXPERIMENTAL DESIGN
In order to undergo the anthropometrics and bioimpedance analyses the participants reported to our conditioned area, situated close to the race registration area, on the day before the competition. All anthropometric measurements were performed in compliance with the International Society of Advancement of Kinantrhopometry (ISAK) Level 1 protocol (before last update) (24) by the same two international level-2-certified anthropometrists, respecting the corresponding intrapersonal technical error of measurement (EMT): 5 % for skinfolds and 1 % for other measurements.
Height (cm) was measured using a SECA 220® measuring rod (Hamburg, Germany) with a precision to within 1 mm, and body mass (BM) (kg) was measured using an Inbody 770® (USA) device, with a precision to within 0.1 kg.
Body mass index (BMI) was calculated using both the Inbody and the BM/height (kg/m) equation. For bioimpedance measurements, Inbody instructions and previously validated techniques (25) were followed. Skinfolds (mm) (tricipital, bicipital, abdominal, suprailiac, subscapular, iliac crest, front thigh, and calf) were analyzed using a Holtain® skinfold caliper with a precision to within 0.5 mm. In order to obtain more information about body fat, the sums of 4 (∑4 SF), 6 (∑6 SF) and 8 (∑8 SF) skinfolds (mm) were examined following validated procedures (24). Muscle perimeters (cm) (arm, contracted arm, waist, hip, and calf muscles) were measured using a metal, non-extensible tape (Cercorf®, Brazil) with a precision to within 1 mm. Contracted arm and calf perimeters were corrected via skinfolds by using the following formula: corrected perimeter = perimeter – (∏ x skinfold area) (26). Bone diameters (femoral and humeral) were measured with a Cerscorf® (Brail) pachymeter, accurate to within 1 mm.
FM and body fat percentage (BF%) were calculated using the Carter, Faulkner, Yuhasz, and Withers equations following the recommendations of the International Society for the Advancement of Kinanthropometry (ISAK) and the Spanish Kinanthropometry Group (GREC) for athletes (27,28). Similarly, MM and MM% were calculated using the Lee (2000) equation (29). The Carter and Heath equation (30) was used to obtain somatotype values.
STATISTICAL ANALYSIS
All anthropometric data are presented as mean (standard deviation), and with the minimum and maximum value for each parameter. Body composition and somatotype values were calculated similarly. The statistical data analysis was carried out using the SPSS software package for Windows, version 24.0 (SPSS, Inc., Chicago, IL, USA).
RESULTS
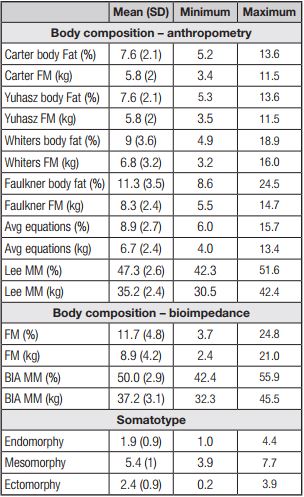
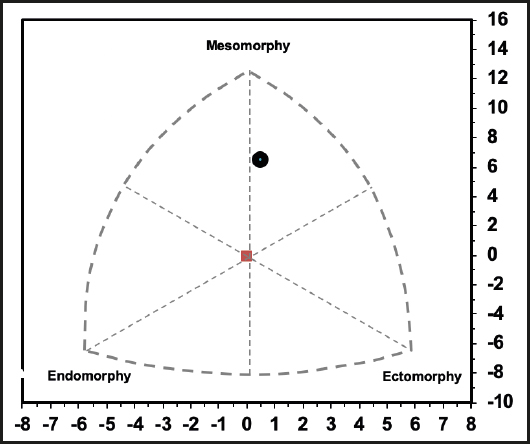
The descriptive data for all studied parameters are displayed in table I and table II. Firstly, table I lists the basic anthropometric values, such as BM (74.6 (6.6) kg; range, 63.7-89.4 kg), height (175.0 (4.2) cm; range, 172.0-178.0 cm), and BMI (23.6 (2.0) kg/m2; range, 20.5-29.7 kg/m2). Secondly, all perimeters (cm) and the corrected values of two of them (arm and calf) are displayed. Thirdly, all skinfolds (mm) and the their sum are also included. Thus, ∑4 SF was 34.2 (14.4) mm (range: 18.5-73.0 mm), ∑6 SF was 48.2 (20.6) mm (range: 25.5-105.0 mm), and ∑8 SF was 57.8 (22.2) mm (range: 33.0-125.0 mm). Lastly, bone diameters (cm) are shown, where the humerus was 7.1 (0.4) (range: 6.7-8) and the femur was 9.7 (0.5) (range: 8.8-10.5). BF %, FM, MM%, and MM (kg) as calculated using different specific equations, and somatotypes are expressed in table II. BF% was between 7.6 (2.1) % using the Carter equation, 11.3 (3.5) % using the Faulkner equation, 7.6 (2.1) % using the Yuhasz equation, and 9.0 (3.6) % according to the Withers equation. Table II also shows MM% using the Lee equation (47.3 (2.6) %; range: 42.3-51.6 %), and somatotype values such as endomorphy (1.9 (0.9); range: 1.0-4.0), mesomorphy (5.4 (1.0); range: 3.9-7.7), and ectomorphy 2.4 (0.9); range: 0.2-3.9). These data, represented in figure 1, show that SUP athletes are balanced mesomorphic in somatotype.
Table I. Basic anthropometry parameters, perimeters, skinfolds, and bone diameters
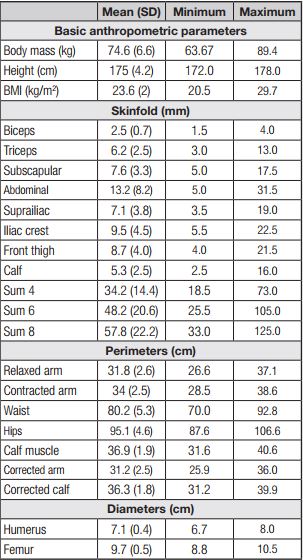
BMI: body mass index; Sum: skinfold sum.
DISCUSSION
To our knowledge, this is the first study to describe SUP athletes anthropometric and somatotype characteristics. Because of that, we compared our results with data observed in similar sport disciplines such as rowing, surfing, and kayaking, in order to gain a better understanding of this sport (Table III).
Table III. Comparison of anthropometric measurements in SUP, rowing, kayaking, and surfing according to the literature
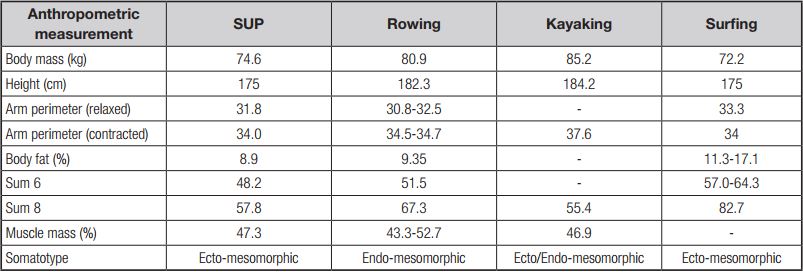
Expressed as mean and/or range. Sum: skinfold sum.
Firstly, a mean height of 175.0 cm and BM of 74.6 kg were obtained. These results are similar to those observed in surfers by Sheppard et al. (9,29), who reported a mean height of 177.0 cm and a BM of 72.2 kg, and in accordance with the height data observed, also in surfers, by Fernández Gamboa et al. (10) (mean, 172.2 cm) and Férnandez-López et al. (13) (mean, 174.3 cm). However, the observed BM is not related to the results obtained in surfers by the same authors: 66.0 kg and 66.7 kg, respectively (30,31). Compared to data observed in rowers by Gutiérrez-Leyton et al. (16) and León-Guereño et al. (17), who reported a mean height of 182.2 cm and 182.5 cm, and a mean BM of 81.5 kg and 80.4 kg, respectively, SUP athletes are less high and heavy than rowers. Similarly, Michael et al. (18) reported a mean height of 184.0 cm and a mean BM of 85.2 kg in male kayakers, almost the same results obtained by Ackland et al. (20) in sprint canoe and kayak paddlers: 184.3 cm and 85.2 kg. These results suggest that SUP athletes have similar anthropometric characteristic with surfers, but different height and BM with rowers and kayakers. Probably, these characteristics are related with the standing position that athletes of both disciplines must maintain in their boards, and with the ability to accelerate in the water.
Moreover, since arms represent a main determinant factor in surfing (12), rowing (17), and kayaking (18), assessing both relaxed (and corrected) and contracted arm perimeters could be essential. In this line, we observed a mean relaxed arm value of 31.8 cm and corrected perimeter of 31.2 cm, and a mean contracted arm perimeter of 34.0 cm. In rowing, data show that elite rowers have a mean relaxed arm perimeter within 30.8-32.5 cm, and a mean contracted arm of 34.5-34.7 cm (16,17). In addition, Ackland et al. (20) observed higher mean values of contracted arm (37.6 cm) in kayakers, with no data related to relaxed arm perimeter and corrected value. Similarly, Barlow et al. (12) reported a mean 33.3 cm for relaxed arm and 34.0 cm for contracted arm in 17 professional surfers. Understanding the difference between relaxed and contracted arm as a good indicator of muscle mass, and relating this parameter to power, SUP athletes have similar values than rowers and kayakers, but differences with surfers. This could be explained by the fact that stroke is not the main determinant movement in surfing, but it represents the primary factor in SUP, rowing, and kayaking performance.
Considering BF% as an important measurement to assess performance in any sport (8), previous researches in rowing demonstrated that elite traditional rowers have mean BF% values of 8.0 (Carter), 9.9 (Whiters), 8.6 (Yuhasz), and 10.9 (Faulkner), similar to those obtained by some equations in our study: 7.6 (Carter) and 9.0 (Whiters). In contrast, higher values of BF% (17.1 and 11.3) were reported in surfers by Furness et al. (31) and Barlow et al. (12), respectively. However, understanding the limitations of calculating BF% with body composition equations, primarily due to different arrays of results obtained, and in accordance with other authors (17), the sums of skinfolds are being used in this study to analyze and compare data with other references. Similarly to our observed data, a mean sum of 4 and 6 skinfolds of 33.7 and 51.5 mm, respectively, was observed in traditional elite rowers (17). However, the mean sum of 8 skinfolds (57.8 mm) observed in this study represents a lower value when compared to the 67.3 mm observed by León-Guereño, but a similar value when compared to what Gutiérrez-Leyton et al. (16) and both Michael et al. (18) and Ackland et al. (20) observed in male rowers (54.9 mm) and kayakers (55.4 mm), respectively. With regard to surfers, a range for the 6-skinfold sum within 57.0-64.29 (12,13) and a mean sum of 92.7 mm for 8 skinfolds were observed, which represent higher values as compared to the data observed in SUP athletes. These results could be explained by the fact that surf is not such a physiological demanding sport, but rather a more technical one (11). On the other hand, SUP data are more similar to those seen in sport disciplines like rowing and kayaking, where lower values of BF% and skinfold sum are desirable, primarily because of the negative impact of higher FM on acceleration and propulsion, especially in longer distances (17).
Muscle mass is an indicator of power in any sport, but as it also represents an important part of total BM, adequate values are necessary to optimize performance. There are only few references attending to MM% or MM (kg) in literature. Similar results to those of this study were observed in traditional rowers, representing a mean MM of 43.3 % (17), but higher values were reported also in Chilean rowers (52.7%) (16). Similarly, López-Plaza et al. (21) reported a 46.9 % of MM in young mature elite kayakers. Moreover, somatotype provides information regarding the general shape of subjects, according to their anthropometric characteristics. Rowers are represented by León-Guerrero et al. (17) as endo-mesomorphic athletes, according to their moderate musculoskeletal development and relative adiposity, but like ecto-mesomorphic athletes by Leyton-Gutiérrez et al. (16). These last results are similar to those for kayaker somatotypes as described by Michael et al. (18) and Ackland et al. (20). In surfers, the same somatotype values (ecto-mesomorphic) were observed in one study (13), but different results were also obtained in other reference (12), which described these athletes as endo-mesomorphic. Relatively high musculoskeletal mass seems to be necessary to perform in SUP, as observed in rowers, kayakers, and surfers. Regarding adiposity and its relation with MM and total BM (somatotype), SUP athletes present several similarities with kayakers and professional surfers, but differences with some rowers and amateur surfers, presenting lower values of BF than rowers and surfers, and a little higher values of MM when compared with kayakers and professional surfers. These miscellaneous results could be explained by differences in the recruited sample in each study. Anyway, this information reveals that SUP athletes have a moderate-high musculoskeletal development and low subcutaneous adiposity.
This study has some limitations that are mainly related to the measurements that were not obtained. Firstly, we did not measure the thigh perimeter and corresponding corrected perimeter, which may represent an adequate indicator of leg muscle mass. Secondly, we missed wingspan in our measurement protocol and, considering it is one of the most directly involved anthropometric performance parameters in rowing and kayaking, it could have been interesting to measure. Finally, although our sample is representative of an international-level SUP race, we assume the current lack of professionalization in this sport and, therefore, the heterogeneity of some key measurements like BF% or skinfolds sums.
The values reported in this study could be used as normative anthropometry and somatotype values for SUP athletes, representing the first model parameters in this sport discipline. This information is useful to acquire a better understanding of training and nutrition strategies in SUP athletes, and therefore for any trainer or nutritionist aiming to improve anthropometric composition, and to provide nutrition recommendations and training protocols.
CONCLUSION
Low body fat percentage (7-11 %) and high total (47 %) and upper muscle mass are representative anthropometric characteristics of international SUP athletes. As these results constitute reference values obtained from international level paddlers, a low skinfold sum and high arm muscle mass may represent key factors for performance in this sport, suggesting that less opposition to acceleration and high stroke force are two of the most important factors in SUP boarding. Moreover, the somatotype of international SUP athletes is a balanced mesomorphic one, which represents the importance of an adequate relation between fat and muscle mass, and suggests that training and nutrition programs should be designed according to these characteristics. However, the present results should be interpreted with caution, as further research is needed to determine the relationships between anthropometric outcomes and performance in SUP athletes.

