Introducción
In the mid-1920s, research began in the United States on the evaluation of the teaching quality at the university by applying questionnaires to students in order to determine their level of satisfaction with the teaching. Since then, this methodology has been widely used both nationally and internationally (Apodaka, & Grad, 2002; Cohen, 1980; Feldman, 1996; Marsh, 1987; Tejedor, Jato, & Mínguez, 1988; Villa, & Morales, 1993).
Expressions such as professor satisfaction are being used to measure professor quality. However, the teaching quality may not be used by all institutions and studies. Young and Shaw (2014) argue that the work of the teaching staff at the university is complex and therefore makes it difficult to reach a consensus on what teaching quality is. For Bain (2004), quality teaching is capable of generating optimal learning in students, i.e. permanent cognitive and personal development over time. Thus, some authors have identified the objective of evaluation as a determinant for the type of evaluation (Tejedor, 2003). There is consensus on two major goals, professor improvement and accountability. In recent years, however, universities have assumed that their teaching assessment must cover both objectives.
Several studies show a close relationship between the teaching quality, learning quality, and teaching effectiveness (Devlin, & Samarawickrema, 2010; Glenn et al., 2012). A substantial amount of research indicates that most universities worldwide use student responses to assess teaching as part of their assessment of teaching effectiveness (Abrami, Marilyn, & Raiszadeh, 2001; Hobson, & Talbot, 2001; Sarwar, Dildar, Shah, & Hussain, 2017; Wagenaar, 1995).
Teaching assessment remains controversial. Some authors point out that the student's opinion is a partial view of the construct “teaching competence”. Students are not a valid or reliable source of information on aspects of teaching where conflict of interest or motivation clearly bias their perceptions and assessments. Therefore, many authors hold that student surveys should be complemented with other indicators in order to ensure a more precise evaluation of professors (Apodaka, & Grad, 2002; De Miguel, 1998). Some research concludes that student opinions are not consistent and may vary according to different variables. For example, they argue that questions about students' general perception of the professor tend to produce more positive scores than specific ones regardless of the actual level of effectiveness of teaching (Mittal, & Gera, 2013). Some studies show that using dichotomous attributes such as good-bad (Kelly, 1950) has a major effect on students' judgement of their professors. Other factors influencing student judgements are "Halo and Horns effects" (Vernon, 1964).
In addition, research shows that external factors can also influence students' opinions concerning the effectiveness of teaching and, therefore, the validity of the approach in specific contexts assumes importance for proper professor evaluation. In this regard, Fernández Rico, Fernández Fernández, Álvarez Suárez and Martínez Camblor (2007) pointed to a weak relationship between class size and student satisfaction in the sense that smaller classes give the most positive grades. Marsh and Roche (1993) indicated the positive relationships between the subject's satisfaction and previous interest in the subject and the reason for the subject's choice. Greenwald and Gillmore (1997), Marsh (1987), and Feldman (1996) noted the relationship between professor indulgence in their assessment and student satisfaction with the professor. Moreover, the relationship between student grades and professor satisfaction is evident in the study of Sarwar et al. (2017). However, according to Marsh (1987) and Marsh and Bailey (1993), the scores students give are reliable, in the sense that there is consistency among students. It was also found that students rarely change their perceptions of the professor, even after several years.
Increasing attention is now being paid to measuring the perceived quality of service from the perspective of university students (O'Neill, & Palmer, 2004; Stodnick, & Rogers, 2008). However, this creates other problems such as how to determine the dimensions that are part of this concept of quality. It is therefore essential to determine the types of attributes that students take into account when assessing the quality of teaching received and its relative importance (Nath, & Zheng, 2004). In addition, according to De Miguel (1998, p. 73), they offer information that is "of little relevance so that the professor can clearly perceive the aspects in which he or she is failing and what needs to be improved".
Ever since the establishment of the European Higher Education Area, European universities have seen teaching as a key element of quality assurance: "Professors are the most important learning resource available to the majority of students" (ENQA, 2005, p. 18). In the United States, this indicator has become one of the most prominent indicators in its universities (Fry, Ketteridge, & Marshall, 2008; Marzano, 2010). In Australia, the main concerns in recent years have been the improvement of teaching and the professional development of professors; thus, teaching has become the most important factor in the quality of universities (Lee, Manathunga, & Kandlbinder, 2010).
Jeréz, Orsini and Hasbún (2016) in a systematic review classified the attributes of quality teaching into three main types of competencies. The first corresponds to pedagogical competencies that are composed of teaching and learning strategies and planning and management. The second group according to the relative weight in the quality of teaching is the generic competences, subdivided into personal, attitudinal, and communicative characteristics. The last group corresponds to disciplinary competences. Vergara-Morales, Del Valle, Díaz, Matos, & Pérez (2019) pointed out that students grouped into profiles with higher levels of autonomy for learning, presented the highest levels of academic satisfaction.
The present study aims to contribute to the existing literature on teaching effectiveness by validating a measure of student assessment of teaching effectiveness, assessing the relationship of the dimensions to the overview measurement of general professor satisfaction. In this sense, this work attempts to identify the variables that, in the opinion of the students, have the greatest influence on student satisfaction with the professor. Furthermore, opinion questionnaires are one of the main tools of valuation of a public service such as higher education and, therefore, the results of this study will make available to public and private university managers useful tools to implement mechanisms of improvement. Parametric (logistic regression) and non-parametric (decision tree) techniques are used for this purpose.
Method
Participants
A study was made on the students' perception of the performance of the teaching staff at the University of Castilla-La Mancha (Spain). The questionnaire was applied to undergraduate students of Business Administration and Management of all the courses and of all the centres and campuses where this degree was offered. The resulting sample (after the cases with missing information had been resolved) included 476 students, mostly between the ages of 18 and 24, with 64.28% being females.
Instrument
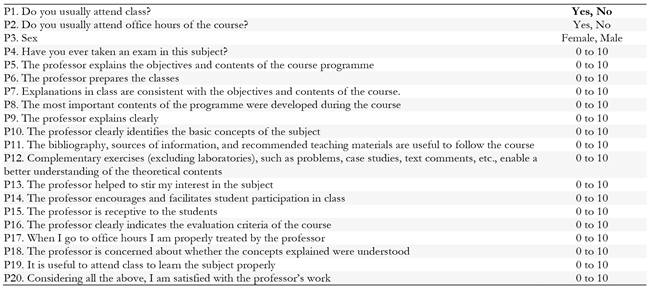
A 20-item questionnaire developed ad hoc by the Quality Assessment Office of the University of Castilla-La Mancha was used. The questionnaire concerned the degree of student satisfaction with their professors. Among the explanatory variables used, some were related to the planning of the teaching, others to the attitude of the professor towards the student, some to the evaluation criteria, the bibliography and recommended material, the academic office hours, etc. Thus, the 5 initial items investigated were related to socio-demographic variables. The next 14 items focused on professor's approach to teaching, such as: the information provided by the professor on the objectives and content of the course, whether the course was being prepared, whether the course had been adapted to the skills and content set, the explanation of the course, the recommended bibliography, the ability to arouse interest in the subject, the professor's attitude towards the students, the teaching methods, the evaluation criteria, the concern for the understanding and learning of the students, and the interest generated by the course. Finally, an item was included for a general assessment of the student's satisfaction with the professor (item P20). Students were required to evaluate their professors, scoring statements on an 11-point Likert scale ranging from 'strongly disagree' (0) to 'strongly agree' (10).
The target variable for this work was the so-called P20: “Considering all the above, I am satisfied with the professor’s work”. This in turn was split into satisfied (≥ 7) and not satisfied (< 7).
Procedure
The questionnaire was filled out anonymously at the end of the term in the usual classroom and without the presence of the professor. The application was collective and administered by qualified personnel.
In this study, a logistic regression (LR) was used to relate a dichotomous variable (P20) to a set of continuous variables, which enabled the identification of the significant aspects of student satisfaction with the teaching staff. To analyse the effect of each variable separately, we performed a simple LR (gross odds ratio). In addition, to identify the variables related to satisfaction, we calculated a LR and a stepwise LR in order to reduce the Akaike coefficient (AIC). Ratio probabilities (OR) and 95% confidence interval were calculated for each case. In these multiple models, the fit to the model (McFadden test R2, 1979), the estimation of the coefficients associated with each explanatory variable, as well as an estimation of the Cox-Snell and Nagelkerke determination coefficients were weighted. Non-parametric tests were also used to estimate the same model but with a classification methodology based on decision trees. In this way, both models were compared and conclusions were drawn in addition to those already based on the logistic regression. For both techniques, the total sample was divided into two subsamples, which we called the learning sample, which was used to estimate both models and a validation or test sample that enabled the estimated models to be validated. All analyses were performed with the software R.
Results
The LR model finally proposed drew a relation between the general satisfaction of students with the work of the professor and certain explanatory variables (P6, P9, P13, P16, P18 and P19) described in Table 1. These variables were selected using the criterion of reduction of the Akaike coefficient (AIC).
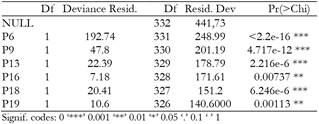
Table 1 shows the explanatory importance of each of the variables in the model. The explanatory capacity that the variable P6 (“The professor prepares the classes”) presented in our LR model was especially relevant. Secondly, with much less importance appeared the P9 (“The professor explains clearly”). The rest of the variables, although significant, were considerably less important. This means that the professor's assessment by the students depends fundamentally on the quality of the professor's teaching activity in the classroom. The clarity of the explanations and the preparation of the presentations or master classes is a basic element for students to understand the subject, and these are the key aspects to evaluate the satisfaction towards the professor. The variables referring to the professor's attitude towards encouraging students to participate in class (P14) or the professor's receptive attitude towards students (P15) and the quality of attention during office hours (P17) were not significant in explaining general satisfaction with the professor. Neither were aspects that have to do with the information on the objectives and contents of the course (P5 and P7) or whether these were developed and identified during the course (P8 and P10). The usefulness of the recommended teaching materials, bibliography, and other sources of information (P11) was also not significant. On the other hand, the gender variable (P3) was not significant, which means that the assessments on the level of satisfaction are not affected by the gender of the student. Finally, other aspects that proved significant within the model but with less explanatory capacity had to do with attitudes that can be called “teaching excellence”. This involves the ability to stimulate student interest in the subject matter (P13), as well as the attitude of the professor who shows concern and interest in the process of student assimilation of the concepts explained (P18).
As for the estimation of the model itself (see Table 2), we should firstly point out that, according to the Global significance test, it is considered significant as a whole. In other words, the variables included in the model significantly influence student satisfaction with the professor’s work. Each of the explanatory variables was evaluated one by one, and all but two (P9 and P16) proved to be significant for an alpha=5% level of significance. However, for alpha=10%, so were P9 and P16.
For the variable P6 (“The professor prepares the classes”), a unit increase in the assessment resulted in an increase of 118.61% in the relative advantage of 1 vs. 0, which is to say that the odds ratio more than doubled, showing the relevant effect that this aspect has on the satisfaction with the professor's teaching activity. The effect of the assessment of the clarity of explanations (P9) was less intense, so that a rise by one point signified an increase of approximately 34.4% in the relative advantage of 1 vs. 0. One point higher in the P18 score (“The professor is concerned to find out whether the concepts explained were understood”) indicated that the probability of being satisfied with the professor augmented by 93.16%. The odds ratio increased by 58.7% when the score was raised by one point of P19 (“It is helpful to attend class to learn the subject properly”). The effect of the other variables of the model was significant but with less influence on the odds ratio or relative advantage of being satisfied as opposed to not being satisfied (P13 and P16) than the first three. All had growing relationships, i.e. better scores tended to boost the likelihood of being satisfied with the professor. The effect of a higher score of each of them, all things being equal, led to an increase of about 30% to 120% in the relative advantage of 1 over 0.
The degree of fit of the model was measured through several coefficients, between which R2 McFadden (68.17%) and R2 Nagelkerke (81.02%) stand out, implying a high degree of goodness of fit and therefore a model with great explanatory capacity.
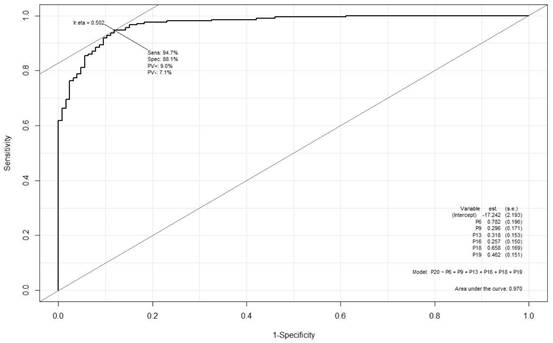
Regarding the discriminant and predictive capacity of the model, the confusion matrix and the ROC curve were calculated from a random validation sample. The distribution of students in both groups was considered balanced (180 students were unsatisfied, compared to 296 satisfied). Randomizing the sample into two subsamples, we also found that in both the learning and validation subsamples the groups derived from the target variable can be considered balanced.
The confusion matrix showed an accuracy of approximately 90%, which reflected a high degree of predictive capacity of the predictive model.
The ROC (Receiver operating characteristic) is a curve generated by plotting the true positive rate (TPR) against the false positive rate (FPR) at various threshold settings while the AUC (Area under the curve) is the area under the ROC curve. As a rule of thumb, a model with good predictive ability should have an AUC closer to 1 (1 is ideal) than to 0.5. As reflected in the ROC curve, the optimum classification probability value is 0.502 (almost the same as the one considered in our case: 0.5). In addition, the optimal values for sensitivity and specificity have been 94.7% and 88.1%, respectively (Hanley & McNeil, 1982). The predictive capacity of our model was excellent with an AUC coefficient equal to 0.970.
Finally, following the name Norusis (2008), the calibration of the model was evaluated through the Hosmer and Lemeshow test (1980) in which it was established as a null hypothesis that the observed values coincide with the expected ones. The p value of this test was 0.9949, meaning that our LR model was excellent in terms of predictive capability.
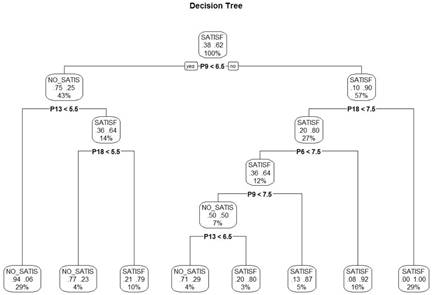
In addition, the same model was estimated but with a classification methodology based on decision trees. In this way, the two models could be compared and additional conclusions to those already arrived at with logistic regression could be drawn. Classification trees are a non-parametric procedure for classifying a dependent variable from a set of predictive or explanatory variables.
Table 5 shows the explanatory importance of each of the variables of the model on the general satisfaction of the student with the teaching activity of the professors.
In the case of the decision tree, the most relevant variable was P9 (“The professor explains clearly”). The rest of the variables had a lower weight but of a similar order of magnitude. For the two nodes with the highest weight (both with 29% of the total sample) the error rate was zero or negligible. For the terminal node with SATISFIED prediction, the classification was based on two variables: P9 > 6.5 and P18 > 7.5 (“The professor is concerned to find out whether the concepts explained were understood”). For the terminal node NOT SATISFIED, its classification was also based on two variables: P9 < 6.5 and P13 < 5.5 (“The professor helped stir my interest in the subject). The next node in sample importance (16%) has a SATISFIED character and the classification rule was P9 > 6.5, P18 < 7.5 and P6 > 7.5 (”The professor prepares the classes”). The fourth node in sample importance (10%) had a SATISFIED character and the classification rule was as follows: P9 < 6.5, P13 > 5.5 and P18 > 5.5. The remaining four nodes constituted less than 5% of the validation sample and their predictive capacity was significantly high. From the foregoing, it can be concluded that if the professor clearly explains (with a score of more than 6.5), this is practically a necessary condition for the student to consider the professor's teaching activity satisfactory. To this should be added the professor's concern to find out whether the concepts explained were understood and the student's perception that the professor prepared the classes (with ratings higher than 7.5) to explain a satisfactory assessment of the professor. On the other hand, if the professor did not explain with sufficient clarity (score below 6.5) and either did not stir interest in the subject (score below 5.5) or did not take the trouble to find out whether the concepts explained were understood (score below 5.5), this would lead to dissatisfaction with the professor's performance.
The following table shows the confusion matrix, in which the accuracy measurement is close to 90%, signifying a high predictive capacity of the classification tree.
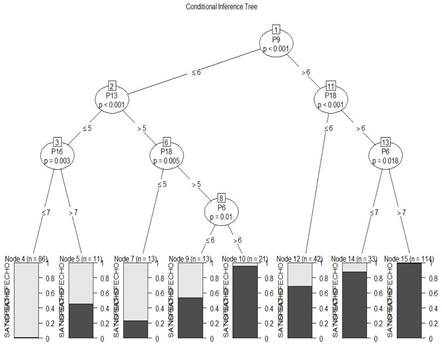
The conditional inference tree is an important variant of traditional decision trees. Trees based on inference are similar to traditional trees but the variables and divisions are based on the significance of some contrasts rather than on measures of purity or homogeneity. The results are similar to those found using the traditional tree.
Its matrix of confusion with the validation sample is the following and is similar to that of the traditional classification tree.
Discussion
Ensuring the quality of teaching in European universities has become a requirement in management processes (Pozo, Bretones, Martos, & Alonso, 2011) that constitutes a key element of their quality-assurance systems. Teaching quality assessments from Spanish universities lay emphasis on student perceptions, but this aspect should go beyond mere description in order to truly improve university teaching by identifying its weaknesses and strengths (Llorent-Bedmar, & Palma, 2019).
In line with the findings of Monereo and Domínguez (2014), our data indicate that students consider variables related to pedagogical planning and management skills the most important. This means that students' assessments of teaching depend fundamentally on their perception of the class preparation by the professor, whereas the variables related to the information concerning the objectives and contents of the subject as well as with the usefulness of the material did not prove significant.
Bartram and Bailey (2009) noted that 268 students rated as “effective teaching” the performance of a professor who explains and conveys information clearly. In this sense, our study indicates that the type of didactic explanation is the second variable with the greatest weight in the student satisfaction with teaching quality. The communicative characteristics are intended to facilitate understanding through discursive strategies, adjusted to the audience (Monereo, & Domínguez, 2014).
On the other hand, the variables referring to the professor's attitude such as promoting student participation in class, the professor's receptiveness to students and the quality of attention during office hours, which in other research has been deemed important (Cabalín, & Navarro, 2010; Gargallo, 2008; Glenn et al., 2012; Jahangiri, McAndrew, Muzaffar, & Mucciolo, 2013; Monereo, & Domínguez, 2014), did not prove significant in the present study. This may be because with the creation of the EHEA these types of variables have become so common that students no longer consider them exceptional. While other variables, such as the ability to stir interest in the subject or the concern in the process of assimilation of students explain student satisfaction in the present work, in agreement with the findings of other authors (Basow, Phelan, & Capotosto, 2006; Bhattacharya, 2004; Cox, & Swanson, 2002; Jahangiri, et al., 2013; Martínez, García, & Quintanal, 2006; Singh et al., 2013). In line with Tomás & Gutierrez (2019) most important aspect for students’ satisfaction is the subjective perception of well-being. The incorporation of activities that imply support for autonomy can lead to a better perception of classroom instruction and motivation, learning and subjective well-being.
In the study by Cabalín and Navarro (2010) the results found that the most decisive characteristics for teachers were being empathic, first, and expert on their subject in second. However, for students the traits should focus on being respectful and empathic with the students. Previously in Casero (2010) the expertise of their subject was verified as an essential factor of teaching quality, but based on an attitude free of arrogance, evoking interest in student learning from respect and consideration. Another particularity of the good university professors is focused on ambition to achieve changes that involve personal growth among students. Furthermore, all teacher quality surveys should be aimed at achieving personal teacher reflection, which helps teacher to identify strengths and weaknesses and to develop individualized improvement plans.
Delving into the results using non-parametric techniques, for the case of the decision tree, we found that the most relevant variable was a communicative pedagogical competence related to the explanatory capacity of the teaching staff. Secondly, the attitudinal competences related to the empathy of the professor (their concern for the student comprehension). Other authors point out that the students consider it fundamental for the professor to promote student-centred learning through a variety of active learning strategies adapted to student interests and characteristics (Cox and Swanson, 2002; Duvivier, Van Dalen, Van der Vleuten, & Scherpbier, 2009; Friz, Sanhuenza, & Figueroa, 2011; Gargallo, 2008) in line with our results. Our data indicate that if the professor explains clearly, is concerned to find out whether the concepts explained were understood, and ensures that the student perceives that classes were well prepared, and then the teaching-quality assessment will be very satisfactory. On the other hand, if the professor does not explain clearly enough, does not stir student interest in the subject and does not care to find out whether the concepts explained were understood, then the teaching-quality assessment will be negative.
Numerous works (García Ramos, 1997; Villa, & Morales, 1993; Tejedor, 2003) investigate the quality of teaching using both parametric and non-parametric techniques, although the former are clearly dominant. However, few studies have been undertaken in Spanish universities and almost all use exploratory and confirmatory factorial analysis (García Ramos, 1997; Tourón, 1989; Villa, & Morales, 1993), so that this work can help improve teaching activity and measure the quality of service perceived by the perspective of university student.
This study has certain limitations, such as a sample restricted to a single university and a single major. Furthermore, our conclusions are based on correlational relationships, although the combined use of non-parametric evidence allows us to draw conclusions that would be more limited if the logistic regression analysis were used exclusively. Further research on these variables is needed with a representative sample or other research of a similar nature at other universities to corroborate our results.
The results of this study may be of particular relevance to professors, managers, and university faculty trainers. ENQA (2005) noted the responsibility of universities to ensure that their professors are competent and prepared to deliver quality teaching. The type competencies identified are feasible to be learned and trained so that the quality of teaching can be improved. It would be helpful to continue research in the future on the quality components of teaching in higher education, especially with regard to the characteristics of the professor and their impact on student learning. Identifying the attributes of quality teaching will enable universities to plan initial and ongoing training for their teaching staff, taking into account the crucial role played by generic, pedagogical, and disciplinary variables in the professor-student interaction.


