


 Servicios personalizados
 Inglés (pdf)
 Articulo en XML
 Referencias del artículo
 Enviar articulo por email
 Citado por SciELO
  Citado por Google
  Similares en
SciELO
Similares en
SciELO  Similares en Google
 Permalink
Repeated measures designs are widely used in health and social sciences research (Fernández et al., 2010), not only in psychology but also in fields such as general medicine (Singh et al., 2013), psychiatry (Gueorguieva & Krystal, 2004), epidemiology (Gunasekara et al., 2014), pharmacology (Maurissen & Vidmar, 2017), neurotoxicology (Tamura & Buelke-Sam, 1992), anesthesiology (Schober & Vetter, 2018), ophthalmology (Armstrong, 2017), pulmonology (De Livera et al., 2014), and veterinary science (Zhao et al., 2019). In the methodological literature, the analysis of repeated measures data continues to generate debate, as illustrated by the considerable number of books (e.g., Davis, 2002; Islam & Chowdhury, 2017; Moskowitz & Hershberger, 2013; Raghavarao & Padgett, 2014; Verma, 2016), tutorials, and review articles that have been published since 2000 (e.g., Armstrong, 2017; Bathke et al., 2009; Blanca, 2004; De Livera et al., 2014; Fernández et al., 2007; Gueorguieva & Krystal, 2004; Keselman et al., 2001, 2002; Maurissen & Vidmar, 2017; Schober & Vetter, 2018; Singh et al., 2013; Tippey et al., 2015; Vallejo & Lozano, 2006). The conventional univariate test of significance within the general linear model for the analysis of repeated measures is repeated measures analysis of variance (RM-ANOVA), which uses the F-statistic to determine statistical significance. The model is defined by:
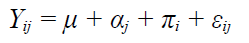
where Y𝑖𝑗 represents the observation for subject i at time j; 𝜇 is the grand mean of the population means; 𝛼𝑗 is the fixed effect of time j; 𝜋𝑖 represents the random effect for subject i; and 𝜀𝑖𝑗 is the error effect associated with subject i at time j. This error effect is a random variable, defined as NID(0, 𝜎𝜀2), and it is independent of 𝜋𝑖. The RM-ANOVA procedure requires fulfillment of the assumptions of normality and sphericity, among others. Although other approaches (e.g., mixed model, multivariate analysis, adjusted F test, etc.) have been proposed for the analysis of repeated measures data when these assumptions are not met, RM-ANOVA remains one of the most widely used statistical procedures in various areas of knowledge (Armstrong, 2017; Blanca et al., 2018; Goedert et al., 2013).
Monte Carlo simulation studies aim to analyze how the violation of assumptions affects the robustness of statistical procedures. Type I error is defined as the probability of rejecting the null hypothesis when it is true. This probability is called the significance level or α, with a conventionally preset value of .05. In the context of ANOVA, obtaining inflated Type I error rates leads to the conclusion that there is a treatment effect, or differences in means, when this is not the case. The probability of erroneously accepting the null hypothesis is referred to as Type II error, labeled β. Power is defined as the probability of correctly rejecting the null hypothesis (1 - β), i.e., the probability of detecting an effect when it actually exists. Conventionally, a power value of .80 is considered adequate (Cooper & Garson, 2016; Kirk, 2013). Power depends on factors such as significance level, sample size, and effect size (Cohen, 1988).
A robust statistical procedure is one that is resistant to deviations from its underlying assumptions (Box, 1953). In terms of Type I error, a procedure is robust when the actual probability of Type I error is close to the nominal significance level of .05. The violation of an assumption does not automatically imply that a test is invalidated, but it is essential to be aware of the consequences of a violation so as to understand the potential mistakes that could occur in the statistical decision-making process. Although the impact of the violation of normality has been extensively studied for between-subjects ANOVA (e.g., Blanca et al., 2017; Schmider et al., 2010), this is not the case for RM-ANOVA; most studies of the latter are focused on analyzing the impact of the violation of sphericity or of both sphericity and normality simultaneously (e.g., Berkovits et al., 2000; Haverkamp & Beauducel, 2017, 2019).
Some methodological books suggest that non-normality may increase the Type I error and decrease the power of RM-ANOVA (Verma, 2016), with some authors proposing the transformation of the dependent variable or the use of a non-parametric procedure as analytic alternatives (Tabachnick & Fidell, 2007). In this context, Sheskin (2003) states that if one or more of the assumptions of a parametric test are violated, data may be transformed into a format that makes it compatible for analysis with the appropriate non-parametric test. Similarly, Wilcox (2022) has argued that the F-statistic has undesirable properties under non-normality, especially in situations with outliers and heavy-tailed distributions, and he proposes robust statistical procedures to address this problem. By contrast, a meta-analysis by Keselman et al. (1996) suggests that RM-ANOVA is generally insensitive to non-normality, although Type I error may increase slightly when the shape of the distribution is asymmetric. More recent studies also show that RM-ANOVA tends to be robust to the violation of normality (Berkovits et al., 2000; Kherad-Pajouh & Renaud, 2015), although these studies were aimed at comparing the performance of other statistical procedures with that of the F-statistic, especially in small samples.
Regarding power, most studies likewise focus mainly on comparing different statistical procedures and do not analyze whether there is a loss of power when RM-ANOVA is used with non-normal as opposed to normal distributions. For example, Bosley (2019) compared the performance of RM-ANOVA with that of three non-parametric and two robust procedures, testing three and five repeated measures and different distributions (normal, uniform, chi-square with 2 degrees of freedom, and Student's t with 3 degrees of freedom). Overall, the results showed higher power for RM-ANOVA. Conversely, Meltzer (2001) compared six statistical procedures and concluded that in terms of Type I error and power there were more effective analyses than RM-ANOVA, one of which was the linear mixed model.
Although the Type I error and power of RM-ANOVA have been previously addressed, there are, to the best of our knowledge, no studies that extensively and independently analyze the effect of non-normality. Consequently, there are no clear guidelines that can inform applied researchers in the statistical analysis of repeated measures data when normality is violated. Our aim in this paper was therefore to analyze the Type I error and statistical power of RM-ANOVA in a wide variety of conditions that may be found in real research situations. To this end, two studies were carried out. In the first, we focus on designs involving 3, 4, 6, and 8 repeated measures and consider different sample sizes representing small, medium, and large samples, with several distributions of the data, including both known and unknown distributions implying slight, moderate, and severe deviation from normality. The second study considers the case of designs involving 3 and 4 repeated measures with unequal distributions in each repeated measure, a condition that has not been studied previously for RM-ANOVA, although it has been addressed in relation to between-subjects ANOVA (e.g., Blanca et al., 2017). In both studies, data were generated with an unstructured (UN) covariance matrix with sphericity approximately equal to 1 (ε ≈ .95) in order to analyze independently the effect of non-normality. The UN matrix is the most general structure (Kowalchuk et al., 2004) and the one most typically found in longitudinal behavioral data (Arnau et al., 2014; Bono et al., 2010).
Empirical Type I error rate and statistical power are analyzed in both studies. The former was interpreted according to Bradley's (1978) criterion, a widely accepted standard that facilitates the comparison of results across similar studies (Arnau et al., 2012; Livacic et al., 2010; Vallejo et al., 2010). According to this criterion, a procedure is considered robust if the Type I error rate is between .025 and .075 for a significance level of .05. This simplifies the interpretation of results and allows us to identify those procedures that are liberal, conservative, and robust to violations. For power, the values of means were set so as to yield a power of approximately .80 for the normal distribution for each sample size, with this value being used as a reference to compare the power obtained with each non-normal distribution.
Study 1. Equal Distributions in the Repeated Measures
The aim here was to analyze empirical Type I error rates and power of the F-statistic in one-way RM-ANOVA with non-normal distributions and equal distributions in the repeated measures.
Method
Instruments
A Monte Carlo simulation study was performed using the SAS/IML (interactive matrix language) software and the PROC GLM module (SAS 9.4, SAS Institute Inc., 2013). A series of macros was created that allowed generation of the data and estimation of the general linear model. These macros are available upon request from the corresponding author. First, we generated an UN covariance matrix with sphericity approximately equal to 1 (ε ≈ .95). We used this matrix because, as already noted, it is the most general structure (Kowalchuk et al., 2004) and the one most typically found in longitudinal behavioral data (Arnau et al., 2014; Bono et al., 2010). Next, non-normal data were generated using the procedure proposed by Fleishman (1978), which uses a polynomial transformation to simulate data with specific values of skewness and kurtosis. Normal data were generated using the Cholesky transformation of the covariance matrix. Finally, simulated data were analyzed with the PROC GLM of SAS to obtain probability values associated with the F-statistic of RM-ANOVA.
Procedure
In order to examine the Type I error rate, differences between repeated measures were set to zero. A one-way repeated measures design was considered (no between-subject factor was included), manipulating the following variables:
Within-subject levels (K). The repeated measures were K = 3, 4, 6, and 8.
Total sample size. Keselman et al. (1998) found that more than half (55.3%) of the studies with repeated measures reported a sample size of 60 or fewer, although the range varied from 6 to 1000. Accordingly, we considered a wide range of sample sizes so as to study small (lower than 30), medium (from 30 to 75), and large samples (above 75) (Bono et al., 2016): 10, 15, 20, 25, 30, 40, 50, 60, 70, 80, 90, 100, 120, 150, 180, 210, 240, 270, and 300.
-
Shape of the distribution with equal distributions in the repeated measures. The values of skewness (γ1 ) and kurtosis (γ2 ) for each distribution are shown in Table 1. A total of 20 distributions were investigated, including the normal distribution (distribution 0). Blanca et al. (2013) analyzed 693 real datasets from psychological variables and found that 80% of them presented values of skewness and kurtosis ranging between -1.25 and 1.25. In light of these findings, we considered the 12 distributions (distributions 1-12) used by Blanca et al. (2017), with values of skewness and kurtosis within this interval, representing slight and moderate departure from the normal distribution. Seven well-known distributions (distributions 13-19) were also added so as to consider extreme departures from normality, and they are also representative of real data (Bono et al., 2017; Micceri, 1989). The latter distributions were as follows: a distribution with values of γ1 and γ2 corresponding to the double exponential; chi-square with 8 degrees of freedom; exponential; lognormal (ζ = 1 and σ = 0.5); and three gamma distributions with different values of the shape parameter α (0.75, 2, and 4).
In order to analyze empirical power, the values of means were selected to give a priori a target power value of approximately .80. This power was then used as a reference to compare the empirical power of RM-ANOVA for each non-normal distribution. Empirical power was calculated with the syntax power = 1 - probf(fcrit, numdf, dendf, ncp), where probf is the probability function of SAS for the F distribution, fcrit represents the theoretical F-statistic, numdf and dendf are the degrees of freedom of the numerator and denominator, and ncp defines the non-centrality parameter. The following variables were manipulated:
Within-subject levels. The repeated measures were K = 3, 4, 6, and 8.
Sample size. The sample sizes were set to 10, 20, 50, 100, 200, and 300.
Shape of the distribution with equal distributions in the measures repeated. The same 20 distributions considered for empirical Type I error rates were investigated.
Mean pattern. Three mean patterns were included for each K. With K = 3, one of the means was different from the means of the other repeated measures (e.g., 1, 1, 2; 1, 2, 1). With K = 4, 6, and 8, the means were manipulated so that a) one was different from the rest (e.g., 1, 1, 1, 2), and b) half were different and equal to each other (e.g., 1, 1, 2, 2). For all K, the means were also manipulated so that the increase between them was linear and proportional (e.g., 1, 1.5, 2, 2.5).
Ten thousand replications of the 1520 and 1440 conditions for Type I error and power, respectively, resulting from the combination of the above variables were performed at a significance level of .05. This number of replications was chosen to ensure reliable results (Bendayan et al., 2014; Robey & Barcikowski, 1992).
Data Analysis
The proportion of rejection of the null hypothesis represented the empirical Type I error rates associated with the F-statistic of RM-ANOVA. As noted earlier, Bradley's (1978) criterion of robustness was used to interpret the results, according to which a procedure is considered robust if the Type I error rate is between .025 and .075 for a nominal alpha level of .05. When the empirical Type I error rate is above the upper limit, the test is considered liberal, and when it is below the lower limit it is considered conservative.
For the power analysis, empirical power for each experimental condition was recorded. Discrepancy was calculated, defined as the difference between the power obtained with the non-normal distribution and that obtained with the normal distribution in each experimental condition.
Results
Table 2 shows descriptive statistics for empirical Type I error rates for each distribution across all the conditions manipulated. The results indicate that Type I error rates were almost always within the interval [.025, .075], with means around .05 in all conditions (shape of distributions, sample size, and number of repeated measures). Only in one case, corresponding to distribution 17, K = 4 with N = 10, was the Type I error rate greater than .075, specifically .078. More detailed results are available upon request from the corresponding author.
Table 2. Minimum and maximum values, median, mean, and standard deviation of the empirical Type I error rate for each distribution across all conditions (K = 3, 4, 6, and 8; N ranged from 10 to 300).
| Distributions | Min | Max | Md | M | SD |
|---|---|---|---|---|---|
| 0 (Normal) | .045 | .059 | .053 | .053 | .003 |
| 1 | .046 | .060 | .053 | .053 | .003 |
| 2 | .045 | .064 | .053 | .053 | .004 |
| 3 | .047 | .060 | .054 | .053 | .003 |
| 4 | .045 | .061 | .053 | .053 | .003 |
| 5 | .045 | .062 | .053 | .053 | .003 |
| 6 | .046 | .061 | .053 | .053 | .003 |
| 7 | .044 | .061 | .053 | .053 | .004 |
| 8 | .047 | .059 | .053 | .053 | .003 |
| 9 | .046 | .059 | .052 | .053 | .003 |
| 10 | .046 | .060 | .053 | .053 | .003 |
| 11 | .047 | .066 | .053 | .053 | .003 |
| 12 | .047 | .064 | .054 | .054 | .003 |
| 13 | .045 | .060 | .051 | .052 | .003 |
| 14 | .045 | .060 | .052 | .052 | .003 |
| 15 | .047 | .069 | .054 | .055 | .005 |
| 16 | .046 | .064 | .054 | .054 | .004 |
| 17 | .045 | .078 | .054 | .056 | .007 |
| 18 | .048 | .067 | .054 | .054 | .004 |
| 19 | .044 | .059 | .053 | .057 | .003 |
Table 3 shows descriptive statistics for the empirical power and discrepancy. Overall, all minimum values of empirical power were around .80, and means of discrepancy were near 0 in all conditions studied.
Table 3. Minimum and maximum values, mean, and standard deviation of empirical power and discrepancy for each distribution across all conditions (K = 3, 4, 6, and 8; N = 10, 20, 50, 100, 200, and 300; and different mean patterns) (Discrepancy = power of the respective non-normal distribution - power of the normal distribution).
| Distributions | Empirical power | Discrepancy | ||||||
|---|---|---|---|---|---|---|---|---|
| Min | Max | M | SD | Min | Max | M | SD | |
| 0 (Normal) | .801 | .842 | .811 | .009 | - | - | - | - |
| 1 | .799 | .847 | .811 | .010 | -.009 | .011 | .000 | .004 |
| 2 | .796 | .844 | .811 | .010 | -.012 | .013 | .000 | .004 |
| 3 | .796 | .846 | .810 | .010 | -.010 | .008 | -.001 | .004 |
| 4 | .798 | .845 | .812 | .010 | -.008 | .010 | .001 | .004 |
| 5 | .796 | .845 | .814 | .011 | -.008 | .020 | .003 | .006 |
| 6 | .790 | .848 | .809 | .011 | -.021 | .006 | -.002 | .005 |
| 7 | .797 | .848 | .812 | .010 | -.011 | .013 | .001 | .004 |
| 8 | .795 | .845 | .813 | .010 | -.007 | .013 | .002 | .004 |
| 9 | .796 | .850 | .814 | .011 | -.010 | .020 | .002 | .006 |
| 10 | .799 | .844 | .814 | .011 | -.009 | .024 | .003 | .006 |
| 11 | .797 | .844 | .815 | .011 | -.006 | .030 | .004 | .007 |
| 12 | .798 | .849 | .816 | .012 | -.009 | .026 | .004 | .007 |
| 13 | .799 | .845 | .813 | .010 | -.007 | .013 | .002 | .004 |
| 14 | .799 | .850 | .817 | .011 | -.006 | .027 | .006 | .007 |
| 15 | .799 | .867 | .822 | .015 | -.006 | .055 | .011 | .014 |
| 16 | .798 | .861 | .821 | .014 | -.008 | .047 | .010 | .012 |
| 17 | .795 | .872 | .824 | .018 | -.006 | .064 | .013 | .016 |
| 18 | .798 | .854 | .818 | .013 | -.007 | .039 | .007 | .010 |
| 19 | .801 | .849 | .816 | .012 | -.009 | .027 | .005 | .007 |
Note.Discrepancy = power obtained in the respective non-normal distribution - power obtained with the normal distribution.
Study 2. Unequal Distributions in each Repeated Measure
The aim here was to analyze empirical Type I error rates and power of the F-statistic in RM-ANOVA with non-normal distributions and unequal distributions in each repeated measure.
Method
Instruments
A Monte Carlo simulation study was performed using the same program and data generation procedure as in Study 1.
Procedure
A one-way repeated measures design was considered (no between-subject factor was included). The following variables were manipulated for empirical Type I error rates:
Within-subject levels. The repeated measures were K = 3 and 4.
Sample size. The sample sizes were the same as in Study 1: 10, 15, 20, 25, 30, 40, 50, 60, 70, 80, 90, 100, 120, 150, 180, 210, 240, 270, and 300.
Shape of the distribution with unequal distributions in the repeated measures. Seven distributions were considered for each K. The values of γ1 and γ2 for each repeated measure are shown in Table 4. Distributions 20-25 and 27-32 correspond to slight and moderate departures from normality, whereas distributions 26 and 33 reflect severe departure. For K = 3 and severe departure, we used the well-known distributions corresponding to the double exponential, chi-square with 8 degrees of freedom, and exponential. For K = 4 and severe departure, we added the gamma distribution (α = 0.75) at the last repeated measure.
Table 4. Values of skewness (γ1 ) and kurtosis (γ2 ) for distributions of each repeated measure.
| Distributions | Repeated measures | γ1 | γ2 |
|---|---|---|---|
| 20 | 1 | 0 | 0.2 |
| 2 | 0 | 0.4 | |
| 3 | 0 | 0.6 | |
| 21 | 1 | 0 | 0.2 |
| 2 | 0 | 0.4 | |
| 3 | 0 | -0.6 | |
| 22 | 1 | 0.2 | 0 |
| 2 | 0.4 | 0 | |
| 3 | 0.6 | 0 | |
| 23 | 1 | 0.2 | 0 |
| 2 | 0.4 | 0 | |
| 3 | -0.6 | 0 | |
| 24 | 1 | 0.2 | 0.4 |
| 2 | 0.4 | 0.6 | |
| 3 | 0.6 | 0.8 | |
| 25 | 1 | 0.2 | 0.4 |
| 2 | 0.6 | 0.8 | |
| 3 | 1 | 1.2 | |
| 26 | 1 | 0 | 3 |
| 2 | 1 | 3 | |
| 3 | 2 | 6 | |
| 27 | 1 | 0 | 0.2 |
| 2 | 0 | 0.4 | |
| 3 | 0 | 0.6 | |
| 4 | 0 | 0.8 | |
| 28 | 1 | 0 | 0.2 |
| 2 | 0 | 0.4 | |
| 3 | 0 | -0.6 | |
| 4 | 0 | -0.8 | |
| 29 | 1 | 0.2 | 0 |
| 2 | 0.4 | 0 | |
| 3 | 0.6 | 0 | |
| 4 | 0.8 | 0 | |
| 30 | 1 | 0.2 | 0 |
| 2 | 0.4 | 0 | |
| 3 | -0.6 | 0 | |
| 4 | -0.8 | 0 | |
| 31 | 1 | 0.2 | 0.4 |
| 2 | 0.4 | 0.6 | |
| 3 | 0.6 | 0.8 | |
| 4 | 0.8 | 1 | |
| 32 | 1 | 0.2 | 0.4 |
| 2 | 0.6 | 0.8 | |
| 3 | 1 | 1.2 | |
| 4 | 1.2 | 1.4 | |
| 33 | 1 | 0 | 3 |
| 2 | 1 | 3 | |
| 3 | 2 | 6 | |
| 4 | 2.31 | 8 |
With respect to empirical power, the manipulated variables were the same as in Study 1 in terms of sample size (6 conditions) and patterns of means (3 conditions) for K = 3 and 4. The shapes of the distribution were the same as for Type I error with unequal distributions in the repeated measures (7 conditions for each K).
Ten thousand replications of the 266 and 252 conditions for Type I error and power, respectively, resulting from the combination of the above variables were performed at a significance level of .05.
Results
Table 5 shows descriptive statistics for empirical Type I error rates for each distribution across all sample sizes. Overall, the results indicated that Type I error rates were within the interval [.025, .075], with means around .05 in all conditions. More detailed results are available upon request from the corresponding author.
Table 5. Minimum and maximum values, median, mean, and standard deviation of Type I error rates for 3 and 4 repeated measures as a function of distribution across all conditions of N (which ranged from 10 to 300).
| K | Distributions | Min | Max | Md | M | SD |
|---|---|---|---|---|---|---|
| 3 | 20 | .047 | .053 | .050 | .050 | .002 |
| 21 | .047 | .055 | .051 | .051 | .002 | |
| 22 | .045 | .053 | .052 | .051 | .002 | |
| 23 | .048 | .053 | .050 | .050 | .002 | |
| 24 | .046 | .053 | .050 | .049 | .002 | |
| 25 | .047 | .055 | .050 | .050 | .002 | |
| 26 | .046 | .053 | .049 | .049 | .002 | |
| 4 | 27 | .045 | .055 | .050 | .050 | .003 |
| 28 | .045 | .055 | .050 | .050 | .002 | |
| 29 | .046 | .053 | .051 | .051 | .002 | |
| 30 | .047 | .053 | .050 | .050 | .002 | |
| 31 | .046 | .055 | .051 | .051 | .002 | |
| 32 | .045 | .056 | .049 | .050 | .003 | |
| 33 | .045 | .057 | .050 | .050 | .003 |
Table 6 shows the empirical power and discrepancy with respect to the power of the normal distribution for 3 and 4 repeated measures across all sample sizes and mean patterns. Overall, as in Study 1, all minimum values of empirical power were around .80 and means of discrepancy were near 0.
Table 6. Minimum and maximum values, mean, and standard deviation of empirical power and discrepancy for each distribution across all conditions (K = 3 and 4; N = 10, 20, 50, 100, 200, and 300; and different mean patterns).
| K | Distributions | Empirical power | Discrepancy | ||||||
|---|---|---|---|---|---|---|---|---|---|
| Min | Max | M | SD | Min | Max | M | SD | ||
| 3 | 20 | .799 | .830 | .814 | .007 | -.005 | .008 | .001 | .004 |
| 21 | .797 | .826 | .813 | .008 | -.007 | .008 | .000 | .004 | |
| 22 | .805 | .826 | .815 | .006 | -.005 | .006 | .002 | .004 | |
| 23 | .796 | .830 | .813 | .008 | -.008 | .014 | .000 | .006 | |
| 24 | .803 | .828 | .814 | .007 | -.004 | .007 | .001 | .003 | |
| 25 | .805 | .828 | .816 | .006 | -.004 | .009 | .003 | .004 | |
| 26 | .808 | .831 | .821 | .007 | .001 | .020 | .008 | .007 | |
| 4 | 27 | .801 | .831 | .814 | .009 | -.005 | .006 | .002 | .003 |
| 28 | .801 | .829 | .813 | .009 | -.010 | .006 | .001 | .004 | |
| 29 | .799 | .830 | .815 | .009 | -.006 | .009 | .003 | .004 | |
| 30 | .795 | .827 | .812 | .009 | -.012 | .011 | .000 | .006 | |
| 31 | .799 | .832 | .815 | .009 | -.005 | .011 | .003 | .004 | |
| 32 | .804 | .834 | .816 | .009 | -.006 | .011 | .003 | .005 | |
| 33 | .804 | .835 | .820 | .008 | -.002 | .022 | .008 | .007 | |
Note.Discrepancy = power obtained in the respective non-normal distribution - power obtained with the normal distribution.
Discussion
The aim of this paper was to analyze the Type I error and statistical power of RM-ANOVA in a wide variety of conditions that may be encountered in real research situations. To this end, two studies were carried out. In the first, we focused on designs with 3, 4, 6, and 8 repeated measures and considered different sample sizes representing small, medium, and large samples with different distribution shapes, including both known and unknown distributions reflecting slight, moderate, and severe deviation from the normal distribution. The second study considered the case of designs involving 3 and 4 repeated measures with unequal distributions in each repeated measure. In both studies we analyzed empirical Type I error and power. The former was interpreted using Bradley's (1978) criterion, while for the latter we compared the power obtained with each non-normal distribution with that obtained with the normal distribution. The value of means was set so as to yield a power of approximately .80 for the normal distribution for each sample size.
Regarding Type I error, the results of Study 1 with equal distribution in the repeated measures indicated, overall, that Type I error rates are within the bounds for considering a statistical procedure as robust according to Bradley's (1978) criterion. Only one Type I error rate was greater than .075, specifically .078, and this corresponded to a design with four repeated measures, a gamma distribution with α = 0.75, and γ1 = 2.31, γ2 = 8 with N = 10, that is to say, with severe departure from normality and a very small sample size. The results of Study 2, with unequal distribution in the repeated measures, supported the robustness of RM-ANOVA under non-normality; all Type I error rates were within the interval [.025, .075] and means were around .05 in all conditions.
When interpreting these results it is important to consider the large number of conditions that have been simulated. The two studies included 33 types of distribution (with equal and unequal distributions in the repeated measures), sample sizes between 10 and 300, and designs involving 3, 4, 6, and 8 repeated measures. Across the two studies and a total of 1786 simulated conditions, the Type I error rate was only greater than .075 in one case. In other words, RM-ANOVA is liberal at a rate of 0.05%, whereas it is robust in 99.95% of the conditions studied here. More specifically, the procedure may be considered robust under non-normality with distributions with skewness and kurtosis as large as 2.31 and 8, respectively. These results extend knowledge about the robustness of this parametric procedure to a larger number of conditions than have been considered in previous studies (Berkovits et al., 2000; Kherad-Pajouh & Renaud, 2015).
Regarding the power of RM-ANOVA, the results show that this does not decrease with the violations of normality considered in the present study. Empirical power was around .80, and the discrepancy between the power obtained with each non-normal distribution and that obtained with normal distribution was near 0. This finding held for all conditions, with equal and unequal distributions in the repeated measures, different sample sizes, and different mean patterns, including a linear pattern.
Considering Type I error and power together, we can conclude that departure from normality, at least in the conditions studied here, does not affect the F-statistic when sphericity is fulfilled. This conclusion is in line with Keselman et al. (1996), who suggested, based on the results of a meta-analysis, that the procedure is generally insensitive to non-normality. In contrast to their study, however, we did not detect an increase in Type I error with asymmetric distributions.
The present findings are useful for applied research insofar as they show that RM-ANOVA is a valid statistical procedure under non-normality in a variety of conditions, provided that the sphericity assumption is met. Therefore, and in contrast to what is recommended in some texts (Tabachnick & Fidell, 2007), transformation of the dependent variable or the use of non-parametric procedures may not be necessary even in the absence of normality. As Blanca et al. (2017) pointed out, these procedures entail a loss of information and pose problems in the interpretation of the results obtained. Our results notwithstanding, researchers are still encouraged to analyze the distribution underlying their repeated measures data and to assess the assumption of sphericity, which is more relevant in the case of RM-ANOVA (Davis, 2002; Kirk, 2013).
This study has a number of limitations that need to be acknowledged. First, Bradley's criterion was used for the interpretation of results. Although this is the established criterion for the interpretation of robustness in the majority of simulation studies, it is not widely known among applied researchers. In this respect, it is important to clarify the implications of this criterion for research: given a nominal significance level of .05, the actual value of Type I error may be different from this value but with a maximum deviation that is considered acceptable (i.e., not exceeding .075 and not dropping below .025). Second, we used a covariance matrix with an approximate sphericity of 1 that may not represent some real research situations. However, we did aim to analyze the effect of non-normality extensively and independently of the effect of violation of sphericity. Future studies are warranted to address the impact of deviations from sphericity and normality by also considering different covariance matrix structures. Third, we have not considered the presence of missing values that may be frequent in data with repeated measures (Davis, 2002; Graham, 2009; Keselman et al., 2001; Vallejo et al., 2011). The general linear model eliminates non-complete cases from the analysis, so it would be interesting in future studies to analyze the behavior of different imputation procedures for these missing values. Finally, the results are limited to distributions with skewness and kurtosis as large as 2.31 and 8, respectively, and more extreme departures have not been analyzed. Researchers may also consult Wilcox (2022) for alternative procedures to RM-ANOVA based on robust methods for dealing with non-normal distributions, such as comparison of means based on trimmed means and bootstrap methods.

