


My SciELO
 Custom services
Services on Demand
Journal
Article
 English (pdf)
 Article in xml format
 Article references
 Send this article by e-mail
Indicators
-
 Cited by SciELO
 -
 Access statistics
Related links
-
 Cited by Google
 -
 Similars in
SciELO
Similars in
SciELO -
 Similars in Google
Share

 Permalink
Archivos de Zootecnia
On-line version ISSN 1885-4494Print version ISSN 0004-0592
Arch. zootec. vol.61 n.236 Córdoba Dec. 2012
https://dx.doi.org/10.4321/S0004-05922012000400002
Impacts of mixed farms on water quality of Pinhal river sub-basin, Santa Catarina, Brazil
Impacto de sistemas de produção pecuários/agrícolas na qualidade da água da sub bacia do rio Pinhal, Santa Catarina, Brasil
Palhares, J.C.P.1, Guidoni, A.L.2, Steinmetz, R.L.R.3A, Mulinari, M.R.3B and Sigua, G.C.4
1 Embrapa Cattle Southest. São Carlos, SP. Brazil. palhares@cppse.embrapa.br
2 Embrapa Temperate Agriculture. Pelotas, RS. Brazil. antlogi@gmail.com
3 Embrapa Swine and Poultry. Concordia, SC. Brazil. Aricardo@cnpsa.embrapa.br; Bmagda@cnpsa.embrapa.br
4 Coastal Plains Soil, Water, and Plant Research Center. USDA-ARS. Florence, SC. USA. Gilbert.Sigua@ARS.USDA.GOV
Funding for this project was provided by National Brazilian Council in Scientifical
SUMMARY
Brazil is one of the largest producers of food in the world. Agriculture and livestock production are concentrated in certain regions of the country. Livestock has been perceived as a constant threat to the quantity and quality of water resources. The objective of this study was to evaluate the impact of mixed farms on superficial water quality in Pinhal River sub-basin, which is located in Concordia, Santa Catarina State. Eight sampling sites representing different land-uses (LU1: dairy cattle; LU2: without animals; LU3: dairy + pigs + poultry + crops; LU4: pigs + poultry + crops; LU5: dairy + pigs + poultry + crops + human; LU6: dairy + pigs + crops; LU7 and LU8: dairy + pigs) were evaluated. These sampling sites were assessed longitudinally and sampled during the summer, spring, autumn, and winter of 2006 to 2009. LU1 presented the worst water quality with high concentrations of total suspended solids (TSS) and chemical oxygen demand. In this point, cows had access to the river. The highest concentration of nitrate (NO3-N) was found at the estuary of the river. There were higher concentrations of TSS, NO3-N and NO2-N in wet season. At this time, intensive fertilizer application to corn fields is common. Autumn and winter presented the worst water quality with respect to nitrogen concentration. Results showed a strong relationship between the sources of pollution (e.g., cows, pigs and poultries) and water quality. Managing the use of animal manure with optimum chemical fertilizer applications along with riparian fencing may provide important mitigation options for protecting water quality of Pinhal River.
Key words: Dairy. Pig. Poultry. Slurries.
RESUMO
O Brasil é um dos maiores produtores de alimentos do mundo. As produções agrícolas e animais estão concentradas em determinadas regiões do país. A pecuária tem sido percebida como uma ameaça constante para a quantidade e a qualidade dos recursos hídricos. O objetivo deste estudo foi avaliar o impacto de sistemas de produção pecuários/agrícolas na qualidade da água superficial na sub-bacia do Rio Pinhal que está localizado em Concórdia, Santa Catarina. Oito pontos de amostragem, representando diferentes usos da terra (LU1: gado leiteiro; LU2: sem animais; LU3: gado leiteiro + porcos + aves de corte + culturas; LU4: porcos + aves de corte + culturas; LU5: gado leiteiro + porcos + aves de corte + culturas + humanos; LU6: gado leiteiro + porcos + culturas; LU7 e LU8: gado leiteiro + porcos) foram avaliados. As águas foram amostradas durante o verão, outono, primavera e inverno de 2006 a 2009. LU1 apresentou a pior qualidade da água com altas concentrações de sólidos suspensos totais (SST) e demanda química de oxigênio. Neste ponto, os animais tinham acesso ao rio. A maior concentração de nitrato (NO3-N) foi encontrada na foz do rio. Houve maiores concentrações de SST, NO3-N e NO2-N na estação chuvosa. Nesta estação há intensiva aplicação de fertilizantes orgânicos para os campos de milho. Outono e inverno apresentaram a pior qualidade da água em relação à concentração de nitrogênio. Os resultados mostraram forte relação entre as fontes de poluição e qualidade da água. O gerenciando o uso de fertilizantes orgânicos com o de fertilizantes químicos e a recuperação das áreas ripárias são ações mitigatórias importantes para proteger a qualidade da água do rio Pinhal.
Palavras chave: Aves de corte. Dejetos. Gado de leite. Porcos.
Introduction
Pig and poultry productions are concentrated in the South of the country. Midwest and Western regions of Santa Catarina State have one of the greatest historical environmental conflicts related to livestock production. In these regions, the conflicts are discussed daily and society demands action from governments, agroindustries and farmers to improve environmental quality (Miranda and Palhares, 2007). This process has some economic and social benefits with increase of employment. However, it has environmental impacts, threatening the availability and quality of natural resources. Wilcock et al. (2006) reported that intensive agricultural practices, such as intensive dairy and pigs are generally regarded as high risk for P and N losses to rivers, because of wrong manure management.
Monitoring of water quality is critical and must be established in order to assess the environmental performance of livestock production. This assessment should occur in long term scale, thus avoiding significant negative environmental impacts and impairment of natural resources. Grimvall et al. (2000) who monitored large European rivers has revealed upward trends in N levels that coincided with the intensification of crop and animal production.
Water quality monitoring is also important because of the current environmental management in Brazilian livestock of using animal wastes as fertilizer. If animal waste application is not done correctly, it will impact waters, soils, and air. Several earlier studies have shown that livestock wastes are important sources of nutrients, but if use in an improper manner, it could negatively impact the environment as non-point source pollution (Schofield et al., 1990; Hantschel and Beese, 1997; Zebarth et al., 1999; Monaghan et al., 2007; Yang et al., 2007).
The aim of this study was to evaluate the impact of mixed farms on superficial water quality of Pinhal River sub-basin. To achieve our goal, we evaluated the social and productive profile of farmers and carried out an intensive water quality monitoring program within the watershed. This study may provide important information to understand the relation between farms and environmental quality and generate pro-active actions and programs that better manage production and their wastes disposal and utilization. Moreover, the results may be useful for guiding farmers in selecting the appropriate management practices for maintaining good water quality.
Materials and methods
PINHAL RIVER SUB-BASIN
The study area is consisted of a 1345.3 ha sub-basin at the upper Pinhal River catchment. Pinhal River is located in Concordia, Santa Catarina, Brazil. The highest points of nearby hills reach elevations of 724 m, while the lowest parts are at about 574 m above sea-level.
The Pinhal sub-basin is a typical agricultural watershed in Santa Catarina state. All area is predominantly agricultural, with high dairy cow, poultry and pig stocking densities and a large proportion of land area devoted to corn, pastures and forage crops. The history of fertilizer application is quite long in the study area that began in the 1960s. Recently, the fertilizers used are urea, ammonium bicarbonate, superphosphate and manure (pig, dairy, and poultry).
There is no gauging on the stream, but flow was estimated with float methodology (Palhareset al., 2007). Pinhal River is shallow, with average depth of <1.5 m. Flows in the river were mostly variable during seasons, as they are affected by rainfall.
SOCIAL AND PRODUCTIVE PROFILE
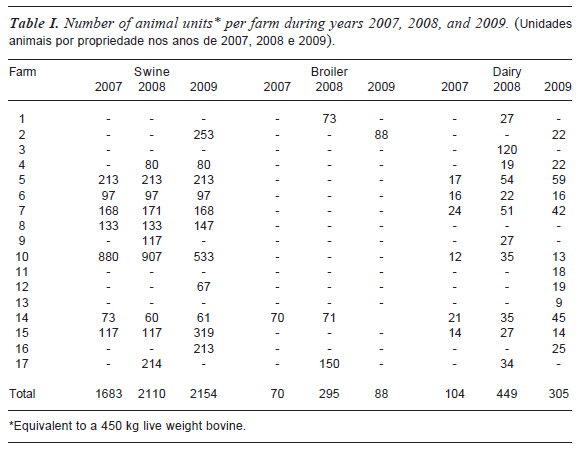
Detailed farm management data were collected during 2006, 2007, and 2008 by staff from Embrapa Swine and Poultry during annual structured interviews with each of the farms in the area. We recorded specific management practices including total farm area, fertilizer and manure application, crop yields for each of the fields, animal production expresed as animal units (AU) equivalent, environmental technologies to manage wastes, and level of farm education. Fields or parts of fields from 17 farms were in the sub-basin. Pinhal sub-basin has pigs, poultry, and dairy cows (table I). The use of livestock slurry as fertilizer is widespread. Slurries are typically stored in open or closed ditches sometimes of small size and poor construction quality, generally close to the stables and Pinhal River.
Pig and broilers farms produced through a contract with private agro-industries. Dairy farms had a contract with cooperatives. In Brazil, the environmental licensing is done by agriculture activity, so on the same farm we can licensed an activity while other have no license to produce. During the period from 2006 to 2009, all swine farms (15) had environmental licenses. The three broilers activities just acquired their licenses in 2008. None of the sixteen dairy farms obtained environmental license during the period, and it was also observed that many cows had access to springs, streams and river in these small holder properties.
MONITORING PROGRAM
Eight monitoring sites that represent different areas were selected. The different sampling sites were characterized by the occupation of mixed farms in their surroundings. In this way, we can infer about the influence of different productions on water quality at the sub-basin level.
Fortnightly, water quality monitoring was carried out at eight sites from August 2006 to August 2008 and thereafter, at monthly intervals until April 2009. The sites were located at places were conditions were most representative and homogeneous, away from areas with point sources, mixing zones, and non-point sources.
Water samples were analyzed in situ with a Multiprobe Hydrolab (Hanna, mod. HI929828) for temperature (oC), pH, electrical conductivity (μS cm-1), and dissolved oxygen (mg L-1). Water samples were collected and were analyzed for turbidity (NTU), total dissolved solids (TSS, mg L-1), chemical oxygen demand (COD, mg L-1), nitrate-nitrogen (NO3-N, mg L-1), and nitritenitrogen (NO2-N, mg L-1). Standard protocols for sampling, sample stabilization and analysis were adopted for all water quality variables following the Standard Procedures for Water Analysis published by the American Public Health Association (APHA, 1992). Nitrate-nitrogen was determined spectrophotometrically with flow injection (FIALab 2500) using the modified Griess reaction. For the determination of NO3-N, the nitrate is being reduced to nitrite by a cadmium-copper column.
DATA ANALYSES
Water quality parameters at different sampling locations represented by different land-uses in 2006, 2007 and 2008 were analyzed statistically following a two-way (land use and season) analysis of variance (ANOVA) using the SAS PROC GLM model (SAS, 2002). Where the F-test indicated a significant (p<0.05) effect, means were separated following the method of Duncan Multiple Range Test (DMRT) using appropriate error mean squares (SAS, 2002). Correlations were made following the 2 to 2 Pearson method between water quality parameters with significant (p<0.05). Separation of the data by year was done to determine if water quality parameters were increasing with time (SAS, 2002). We used the XP-PRO Window SAS Version 9.1 (SAS, 2002).
Results
SITE-PRODUCTIVITY CHARACTERISTICS
All farmers used the same formula (9-3312) of chemical fertilizer during those three years. Farmers consumed about 1494 kg N, 5478 kg P, and 1992 kg K in 2006, 3902 kg N, 14306 kg P, and 5202 kg K in 2007 and, 2286 kg N, 8382 kg P, and 3048 kg K in 2008. Urea (45-0-0) was also used by all farmers for topdressing their maize crops and consumed 3735, 7953 and, 16751 kg N in 2006, 2007 and 2008, respectively. All producers have also applied pig, broiler, and dairy manures as fertilizer on their maize areas and pastures, but the actual amount applied was not documented properly.
Sites located in the region from the middle to the end of the sub-basin had the highest animals' populations. Site 6 had the highest stocking density in all years (mean of 8.31 AU ha-1) while site 8 had the second highest stocking density of 2.71 AU ha-1 (table II). The higher stocking density on site 6 was due the presence of the largest pig farm in this region. Farm upward site 1 is a dairy farm and animals had full access to the springs and river. The point of water sampling was located in the lowest part of the farm that measures any impact of animals upstream to water quality. Site 2 has no animal units because it was a region of environment protected area. In this region, environmental legislations related to conservation of forests and waters were fully met. This site therefore should be considered as an area where there is low human intervention. Possible sources of pollution could be the wildlife and septic tanks.

The data show the high spatial animal concentration that existed in the sub-basin. This concentration can be explained by the characteristics of relief. Mainly, between sites 6 and 7, relief is smoother, showing areas with low slope, which facilitates the building of facilities for pigs and broilers and agricultural use of land. Therefore, this region is more susceptible to receive larger amounts of chemical and organic fertilizers.
ENVIRONMENTAL CHARACTERISTICS AND WATER QUALITY
The river flows were measured in sites 4 and 5 only because these places had the technical conditions to use the float methodology. Site 4 had a flow means of 5.1 m3s-1 and 3.3 m3s-1 during the wet and dry season, respectively. Site 5 had a flow means of 9.4 m3s-1 and 4.5 m3s-1 for wet and dry season, respectively. The higher flows that were observed during spring could be explained by the regional rainy season. The baseflow between rainfall events varied with the frequency of high-flow events and with seasonal changes in evapotranspiration (Yang et al., 2007).
Mean values of water quality parameters for 2006 to 2009 indicated that the River and tributaries was well oxygenated, had a neutral pH, and had low concentrations of COD and dissolved inorganic nitrogen (table III). Pinhal River is classified as a Class 2 river (CONAMA, 2005). Dissolved oxygen, pH, turbidity, TSS, nitrate, and nitrite were within the guideline values for Class 2 waters. Site 2 showed the best water quality. Site 1 had the worst water quality because of high concentrations of turbidity, TSS, EC, DO, COD, and nitrite. Maximum concentrations allowed for Class 2 water are: 10 mg L-1 of nitrate and 1.0 mg/L of nitrite. The maximum concentration of nitrate was observed at site 8 (2.4 mg L-1) and nitrite in site 1 (0.054 mg L-1).

Higher flow rates were observed in spring which is consistent with the historical average rainfall in the region (table IV). During the dry season water availability, mainly in sites 1 and 2, were significantly reduced making it difficult to collect samples. In the autumn EC, turbidity, and COD had the highest values while winter presented the highest values for TSS, nitrate, and nitrite. These results could be explained by the differences in monthly average rainfall and difference in river flow during these seasons. Low flow could increase the concentration of dissolved nutrients in the water column, but high flow could enhance the erosion and runoff. The highest concentrations of suspended solids and dissolved inorganic nitrogen during dry season could be explained by the intense use of pig waste application while preparing the land before planting corn that would normally occur between August and September. Despite the producers' adoption of no-till system for their corn production, the lack of riparian zone may still expose water resources to non-point or point-source pollutions.

Despite significant differences in pH between seasons, pH values remained in the optimal values for rivers Class 2 (6.0 to 9.0). During spring and summer, pH had the highest values of 7.6 in sites 2, 7 and 8. During winter, the lowest pH means that were observed at all sites were similar (pH 7.0).
Correlations between water quality parameters and seasons are presented in table V. Except for the winter, the highest correlation was found between COD and turbidity in all seasons. In spring, only the correlation between COD and turbidity showed high correlation value (r= 0.86). Correlation analyses for TSS and turbidity yielded a low r value of 0.11 while TSS and EC had an r value of -0.08. In summer, the highest correlations were observed between COD and turbidity (r = 0.89) and COD and EC (r= 0.78). During dry months (winter season), the highest correlations were observed between COD and turbidity (r= 0.80 in the autumn), COD and EC (r= 0.84), COD and TSS (r= 0.70), and EC and TSS (r= 0.70).

Discussion
Water sampling site 2 was a suitable reference for downstream sites impacted by dairy, pig, broiler, and agriculture. This site represents the best water quality, considering ecological and legislation references.
Site 1 and sites located at the end of the sub-basin had the highest turbidities. The lower portion of the sub-basin received sediments from upstream and was also the region with the highest animal stocking densities. Site 1 showed the highest values due to animals' traffic and the significant degree of erosion. This fact justifies the need to prevent animal access to waterways. Gumbertet al. (2009), cattle are often watered by streams. Although this practice solves water requirements for cattle, providing livestock free access to streams and riparian areas, it can lead to a contaminated water supply and damaged ecosystems. A better solution is to implement riparian buffers with limited access points to streams or provide alternative water sources. Stocking density however, did not affect significantly the concentration of TSS.
Between seasons, summer had the lowest means of turbidity (table IV). The flow of the river is lower and slow in dry seasons. From sites 5 to 7, the stream beds of the river are formed by silt and clay sediments, different from other sites where there are cobble and gravel stream beds and relief is more rugged. These differences between stream beds, relief, and raining intensity will influence turbidity. Site 2 with cobble and gravel stream bed and low direct influence of rain in the water column, because of natural forest, had the lowest turbidity. Correlations between turbidity and COD were above 0.80 to in seasons except winter. Sediments reach the river via runoff This process e increases turbidity and COD. Winter has one of the lowest average monthly rainfall for the period 1987 to 2005. Table IV shows that in the winter the river flow was minimal and the turbidity was low.
High dissolved oxygen concentrations are common in rivers of the region due to the type of relief which provides high turbulence and intensive gas exchange between surface and atmosphere. The highest averages of DO were observed in sites 8, 3, and 4, places of high turbulence (table III). Highest dissolved oxygen concentrations were observed during autumn and winter and lowest during spring and summer (table IV). It is a normal process in streams because during autumn and winter we have the lowest water temperature; means were between 15.8 and 17.7o C. Sites 1, 5, and 6 had the lowest dissolved oxygen. In these sites, we observed animal with access to the river, low flow, and the highest stocking density thus these means were reflecting those conditions. Although these sites had the lowest means, we cannot observe anoxia, operationally defined as dissolved oxygen concentration below 0.5 mg/L. Site 8 had the highest stocking density and DO because turbulence was strong. Line (2003) reported that DO, pH and temperature in relatively short reaches of flowing stream are rarely significantly affected by nonpoint source pollution. Characteristics of each site and non-point sources of pollution did not impact these water quality parameters.
Site 2 had the lowest EC means and site 1 had the highest. These results show how an area highly impacted by erosion and by animal traffic may deteriorate water quality. Its condition adduce soil particles and manure to the water which will increase conductivity. Livestock access to stream and riparian areas has been found to negatively affect water quality and seasonal quantity, stream channel morphology, hydrology, riparian zone soils, instream and bank vegetation, and aquatic and riparian wildlife (Trimble and Mendel, 1995; Belsky et al., 1999; Little, 2001). Significant differences in EC were observed between seasons (table IV), but the highest value did not occur in the rainy season. EC values are related with intensive use of animal waste as fertilizer.
Sites 1 and 3 had the highest TSS means. In indicates that environmental condition of site 1 could promote impacto in site 3. This situation justifies that the environmental management in a sub-basin must occurred in a holistic approach. Approximately 95% of deposited manure will settle to the bottom of the stream within the first 50 m (Biskie et al., 1988).
CONAMA (2005) does not have standard for chemical oxygen demand. Site 1 had the highest mean (19.2 mg/L) and was the only site with statistical difference. This result is important to show the impact of dairy in the water quality. Monaghan et al. (2009) runoff from pastoral land is known to be a significant contributor to declining water quality in many regions throughout the world, particularly those managed under intensive farming practices where inputs, nutrient recycling rates and stocking densities are high.
Despite we cannot observe significant differences between sites, COD had high concentrations in sites 5 to 7 where we had high stocking density. The highest COD concentrations in the autumn are related with soil management and fertilizer program. The rainiest season had the lowest mean, but correlation between COD and turbidity was high in the spring.
Higher concentrations of nitrate and nitrite are often associated with over-use of nitrogen fertilizers and manures, intensive livestock operations, and leakage from septic systems and municipal wastes, climatological and edaphic conditions, agriculture practices and management.
Wolia et al. (2004) showed that NO3-N concentrations were directly proportional to upland field percentages in the drainage basins. Our study did not show it, because highest concentrations was observed in lowlands, showing that nitrification process is an important ecological factor.
The main pathway of N output to surface waters is through runoff (Barisas et al., 1978), but sub-surface direct interflow also contributes to small streams by lateral seepage (Gachter et al., 1998). During intensive wet seasons, nitrogen concentration did not have increase. Due to the intensive management in the soil in Pinhal sub-basin, animal waste used as fertilizer should contribute with more nitrogen to waters. Castillo et al. (2000); Honisch et al. (2002), driving factors of non-point pollution vary regionally, reflecting a combination of land uses, climate, and edaphic conditions. In a certain region, land use has become the main factor that affects N transportation to the surface water.
Dry season presented the highest nitrate means, supporting that nonpoint pollution from animal and chemical fertilizers while farmers are preparing soil to plant corn can carry nitrate to the water. There was a relation among sites with higher animal stocking densities and high concentrations of nitrate. Shimura and Tabuchi (1997) found that the concentrations of NO3-N in river water were highly correlated with the stocking density of some livestock farming areas. But sites with highest stocking densities was in the downstream part of sub-basin characterized by high turbulence in the water column which can support nitrification. Nitrate can reach the river directly, but it is also a product of nitrification. Pekárová and Pekár (1996), remember that nitrate concentration depend on the type of land use, vegetation, mass of the accumulated nitrates in the catchment, and length of the dry period.
Means in sites 6 to 8 were 2.2 to 2.4 mg L-1 NO3-N, respectively. Palhares and Mattei (2006) measured maximum concentrations of 4.9 mg L-1 NO3-N in Ouro sub-basin in a site with the highest stocking density. Vidal et al. (2000), monitoring a sub-basin characterized by high animal stocking densities found average nitrate concentration of 0.3 mg L-1 NO3-N and a maximum of 14 mg L-1 NO3-N. Yang et al. (2007) highest average concentrations, 0.3 mg L-1 NO3-N, was found in the sub-watershed, a monitored stream that was just below a village and from which human and livestock waste contributed partially as an important non-point source of N.
Site 1 that represents a point pollution source because dairy have access to the river had concentrations between 1.4 and 2.0 mg L-1 NO3-N. Karr et al. (2003), a firstorder stream draining dairy sprayfields had NO3N from 0.22 to 1.36 mg L-1 NO3-N.
As for nitrate, winter had the highest nitrite means. In this season the highest correlations observed to nitrite was with COD (0.7) and EC (0.6). This condition justifies the impact of using pig waste as fertilizer during August and September and the necessity to preserve riparian zone and use agriculture conservation practices. It was not observed any relation between animal stocking density and concentration of nitrite, as observed to nitrate. Again the hydrological condition among sites 6 to 8 could explain this lack of relation. Highest concentrations were observed in site 1. The presence of nitrite is related to the contact of water with a recent source of pollution which justifies the higher concentrations of this element in site 1. Sources at the upper part of the sub-basin can contribute to chemical inputs through aquifers and stream channels. It could explain high concentrations in site 4.
Conclusions
Based on the results, we can conclude that:
- Despite the environmental legislation determines the nutrient balance for the use of animal waste as fertilizer, producers did not make this. The first action to improve the environmental quality in the sub-basin should be the internalization of this concept in daily activities. For this, should be delineated strong rural assistance and education programs.
- Areas with the highest animal stocking density presented high concentrations of nitrate. This demonstrates the need to make the correct management of waste as fertilizer and promote the use of treatment technologies that reduce nutrients loads and dependence on the soil.
- Monitoring site with worst water quality was those with direct access of dairies to the river. Actions must be done to recovery riparian zones, fencing river's margins, and put drinking outside the riparian buffer.
- Environmental program to improve the water quality in the sub-basin should include: use of organic and chemical fertilizers in accordance with agronomic recommendation and nutrient management plan, recovery buffer zones along river and springs, prevent dairies to reach the water sources, use treatment systems to animal wastes, export nutrients from animal wastes between farms or outside of sub-basin, implements programs to rural assistance and environmental education.
Acknowledgement
Funding for this project was provided by National Brazilian Council in Scientifical and Technological Development, MCT/CNPQ/CT-HIDRO/SEAP-PR no 35/2007-7 and by Brazilian Agricultural Research Corporation-EMBRAPA.
References
APHA. 1992. Standard methods for the examination of water and wastewater. 18th ed. APHA. Washington. [ Links ]
Barisas, S.G., Baker, J.L., Johnson, H.P. and Laflen, J.M. 1978. Effect of tillage systems on runoff losses of nutrients, a rainfall simulation study. Trans ASAE, 75: 893-897. [ Links ]
Belsky, A.J., Matzke, A. and Uselman, S. 1999. Survey of livestock influences on stream and riparian ecosystems in the western United States. Soil Water Conserv, 54: 419-431. [ Links ]
Biskie, H.A., Sherer, B.M., Moore, J.A., Miner, J.R. and Buckhouse, J.M. 1988. Fate of organisms from manure point loading into a rangeland stream. ASAE Paper: 2088-2081. [ Links ]
Castillo, M.M., Allan, J.D. and Brunzell, S. 2000. Nutrient concentrations and discharges in a midwestern agricultural catchment. J Environ Qual, 29: 1142-1151. [ Links ]
CONAMA. 2005. Resolução no 357 de 17 de março de 2005. http://www.mma.gov.br/port/conama/legiabre.cfm?codlegi=459 (08/02/2010). [ Links ]
Gachter, R., Ngatiah, J.M. and Stamm, C. 1998. Transport of phosphate from soil to surface waters by preferential flow. Environ Sci Technol, 32: 1865-1869. [ Links ]
Grimvall, A., Stålnacke, P. and Tonderski, A. 2000. Time scales of nutrient losses from land to sea: a European perspective. Ecol Eng, 14: 363-371. [ Links ]
Gumbert, A.A., Higgins, S. and Agouridis, C. 2009. A livestock best management practice for protecting water quality. http://www.ca.uky.edu/agc/pubs/id/id175/id175.pdf (14/01/2011). [ Links ]
Hantschel, R.E. and Beese, F. 1997. Site-oriented ecosystem management: precondition to reducing the contamination of waters and the atmosphere. In: Rosen, D., Tel-Or, E., Hadar, Y., Chen, Y. (Eds.). Modern agriculture and the environment. Kluwer Academic Publishers. Dordrecht. pp. 135-145. [ Links ]
Honisch, M., Hellmeier, C. and Weiss, K. 2002. Response of surface and subsurface water and Technological Development, MCT/ CNPQ/CT-HIDRO/SEAP-PR no 35/2007-7 and by Brazilian Agricultural Research Corporation-EMBRAPA. quality to land use changes. Geoderma, 105: 277-298. [ Links ]
Karr, J.D., Showers, W.J. and Jennings, G.D. 2003. Low-level nitrate export from confined dairy farming detected in North Carolina streams using 15N. Agr Ecosyst Environ, 95: 103-110. [ Links ]
Line, D.E. 2003. Changes in a stream's physical and biological conditions following livestock exclusion. Trans ASAE, 46: 287-293. [ Links ]
Little, J. 2001. Water quality in the battersea drain and lower little Bow River (1998-2000)-Interim Report. Irrigation Branch, Alberta Agriculture, Food and Rural Development. Lethbridge, AB. [ Links ]
Miranda, C.R. e Palhares, J.C.P. 2007. Gestão ambiental na propriedade suinícola. In: Seganfredo, M.A. Gestão ambiental na suinocultura. Embrapa Brasília pp. 282-301. [ Links ]
Monaghan, R.M., Carey, P.L., Wilcock, R.J., Drewry, J.J., Houlbrooke, D.J., Quinn, J.M. and Thorrold, B.S. 2009. Linkages between land management activities and stream water quality in a border dyke-irrigated pastoral catchment. Agr Ecosyst Environ, 129: 201-211. [ Links ]
Monaghan, R.M., Wilcock, R.J., Smith, L.C., Tikkisetty, B., Thorrold, B.S. and Costaal, D. 2007. Linkages between land management activities and water quality in an intensively farmed catchment in southern New Zealand. Agr Ecosyst Environ, 118: 211-222. [ Links ]
Palhares, J.C.P. and Mattei, R.M. 2006. Monitoramento da qualidade da água de uma microbacia na época de maior disposição dos resíduos animais como fertilizantes. In: Congreso de la Asociación Interamericana de Ingeniería Sanitaria y Ambiental. AIDIS. Punta del Este. [ Links ]
Palhares, J.C.P., Ramos, C., Klein, J.B.,Lima, J.M.M. de, Muller, S. e Cestonaro, T. 2007. Medição da vazão em rios. Embrapa Suínos e Aves. Concórdia. [ Links ]
Pekárová, P. and Pekár, J. 1996. The impact of land use on stream water quality in Slovakia. J Hydrol, 180: 333-350. [ Links ]
SAS Institute. 2002. SAS/STAT user's guide. Release 6.03 (p. 494). SAS Institute. Cary. [ Links ]
Schofield, K., Seager, J. and Merriman, R.P. 1990. The impact of intensive dairy farming activities on river quality: the Eastern Cleddau catchment study. Water Environ J, 4: 176-186. [ Links ]
Shimura, M. and Tabuchi, T. 1997. The relation between cattle farming and nitrogen concentration in stream waters-research on nitrogen outflow from high stocking density area (IV). Jpn Soc Irrig Drainage Reclam Eng, 189: 45-50. [ Links ]
Trimble, S.W. and Mendel, A.C. 1995. The cow as a geomorphic agent: a critical review. Geomorphology, 13: 233-253. [ Links ]
Vidal, M., Loapeza, A., Santoallaa, M.C. and Valles, V. 2000. Factor analysis for the study of water resources contamination due to the use of livestock slurries as fertilizer. Agr Water Manage, 45: 1-15. [ Links ]
Wilcock, R.J., Monaghan, R.M., Quinn, J.M., Campbell, A.M., Thorrold, B.S., Duncan, M.J., McGowan, A.W. and Betteridge, K. 2006. Landuse impacts and water quality targets in the intensive dairying catchment of the Toenepi Stream, New Zealand. New Zeal J Mar Fres Res, 40: 123-140. [ Links ]
Wolia, K.P., Nagumob, T., Kuramochic, K. and Hatano, R. 2004. Evaluating river water quality through land use analysis and N budget approaches in livestock farming areas. Sci Total Environ, 329: 61-74. [ Links ]
Yang, J.L., Gan-Lin Zhang, G.L. and Zhao, Y.G. 2007. Land use impact on nitrogen discharge by stream: a case study in subtropical hilly region of China. Nutr Cycl Agroecosys, 77: 29-38. [ Links ]
Zebarth, B.J., Paul, J.W. and Kleeck, R.V. 1999. The effect of nitrogen management in agricultural production on water and air quality: evaluation on a regional scale. Agr Ecosyst Environ, 72: 35-52. [ Links ]
Zebarth, B.J., Paul, J.W. and Kleeck, R.V. 1999. The effect of nitrogen management in agricultural production on water and air quality: evaluation on a regional scale. Agr Ecosyst Environ, 72: 35-52. [ Links ]
Recibido: 30-5-11.
Aceptado: 23-2-12.

