


Meu SciELO
 Serviços customizados
Serviços Personalizados
Journal
Artigo
 Inglês (pdf)
 Artigo em XML
 Referências do artigo
 Enviar este artigo por email
Indicadores
-
 Citado por SciELO
 -
 Acessos
Links relacionados
 Citado por Google
 -
 Similares em
SciELO
Similares em
SciELO  Similares em Google
Compartilhar

 Permalink
Nutrición Hospitalaria
versão On-line ISSN 1699-5198versão impressa ISSN 0212-1611
Nutr. Hosp. vol.19 no.2 Madrid Mar./Abr. 2004
Original
Nutritional risk and status assessment in surgical patients: a challenge
amidst plenty
F. Mourão*, D. Amado*, P. Ravasco, P. Marqués Vidal y M. E. Camilo
* Undergraduate medical students supervised by the Centre of Nutrition and Metabolism, Institute of Molecular Medicine,
Faculty of Medicine, University of Lisbon, Portugal.
| Abstract Background and Aims: No gold standard exists for nutritional screening/assessment. This cross-sectional study aimed to collect/use a comprehensive set of clinical, anthropometric, functional data, explore interrelations, and derive a feasible/sensitive/specific method to assess nutritional risk and status in hospital practice. Patients and Methods: 100 surgical patients were evaluated, 49M:51F, 55 ± 18.9(18-88) years. Nutritional risk assessment: Kondrups Nutritional Risk Assessment, BAPEN's Malnutrition Screening Tool, Nutrition Screening Initiative, Admission Nutritional Screening Tool. Nutritional status: anthropometry categorised by Body Mass Index and McWhirter & Pennington criteria, recent weight loss > 10%, dynamometry, Subjective Global Assessment. Results: There was a strong agreement between all nutritional risk (k = 0.69-0.89, p < 0.05) and between all nutritional assessment methods (k = 0.51- 0.88, p ≤ 0.05) except for dynamometry. Weight loss > 10% was the only method that agreed with all tools (k = 0.86-0.94, p ≤ 0.05), and was thereafter used as the standard. Kondrups Nutritional Risk Assessment and Admission Nutritional Screening Tool were unspecific but highly sensitive (≥ 95%). Subjective Global Assessment was highly sensitive (100%) and specific (69%), and was the only method with a significant Youden value (0.7). Conclusions: Kondrups Nutritional Risk Assessment and Admission Nutritional Screening Tool emerged as sensitive screening methods; the former is simpler to use, Kondrups Nutritional Risk Assessment has been devised to direct nutritional intervention. Recent unintentional weight loss > 10% is a simple method whereas Subjective Global Assessment identified high-risk/undernourished patients. (Nutr Hosp 2004, 19:83-88) Key words: Malnutrition. Nutritional risk. Nutritional status. Screening. Surgical patients. Hospital. | EVALUACIÓN DEL RIESGO Y DEL ESTADO Resumen Fundamento y objetivos: no hay ninguna referencia para el cribado o la evaluación nutricional. En este estudio transversal se trató de recoger o utilizar un conjunto amplio de datos clínicos, antropométricos y funcionales; explorar las interrelaciones y obtener un método factible, sensible y específico para medir el riesgo y el estado nutricional en la práctica hospitalaria. Pacientes y métodos: se evaluó a 100 pacientes quirúrgicos, 49 varones y 51 mujeres, 55 ± 18,9 (18-88) años. Evaluación del riesgo nutricional: evaluación del riesgo nutricional de Kondrup, instrumento de cribado de la malnutrición de BAPEN, iniciativa para el cribado nutricional, instrumento para el cribado nutricional al ingreso. Estado nutricional: la antropometría se clasificó según el índice de masa corporal y los criterios de McWhirter y Pennington, el adelgazamiento reciente > 10%, la dinamometría, y la evaluación general subjetiva. Resultados: se observó una gran concordancia entre todos los métodos de evaluación del riesgo nutricional (κ = 0,69-0,89, p < 0,05) y entre todos los métodos de evaluación nutricional (κ = 0,51-0,88, p ≤ 0,05), salvo la dinamometría. El adelgazamiento > 10% fue el único método que coincidió con todos los instrumentos (κ = 0,86-0,94, p ≤ 0,05) y, por tanto, se utilizó como referencia. El instrumento de evaluación del riesgo nutricional de Kondrup y el del cribado de la nutrición en el momento del ingreso resultaron inespecíficos pero muy sensibles (≥ 95%). La evaluación subjetiva general resultó muy sensible (100%) y específica (69%) y fue el único método con un valor significativo de Youden (0,7). Conclusiones: la evaluación del riesgo nutricional de Kondrup y el instrumento de cribado nutricional durante el ingreso resultaron métodos sensibles para el cribado; el primero resulta más sencillo; la evaluación del riesgo nutricional de Kondrup se ha diseñado para dirigir la intervención nutricional. El adelgazamiento reciente no intencionado > 10% supone un método sencillo, mientras que la evaluación subjetiva general permitió identificar a los pacientes de alto riesgo o desnutridos. (Nutr Hosp 2004, 19:83-88) Palabras clave: Malnutrición. Riesgo nutricional. Estado nutricional. Cribado. Pacientes quirúrgicos. Hospital. |
Correspondence: Paula Ravasco.
Centre of Nutrition and Metabolism, Faculty of Medicine,
University of Lisbon.
Avenida Prof. Egas Moniz. - 1649-028 Lisbon - Portugal.
Tel.: +351217985187. Fax: +351217985142.
e-mail: p.ravasco@fm.ul.pt
Recibido: 14-VIII-2003.
Aceptado: 29-XII-2003.
Introduction
Malnutrition comprises any over or under-nutrition disorder enticing changes in body composition and functional capacity1, 2. Disease-associated malnutrition usually refers to undernutrition, a syndrome that worsens patients well-being and prognosis, bearing increased overall costs1, 3. Hospital undernutrition, although recognised as of clinical significance, still remains widely undiagnosed/underestimated4, 5; nevertheless, the prevalence of malnutrition depends upon the criteria used since nutritional status can be defined by multiple ways6, 7.
The lack of consensus on a reliable nutritional assessment method drives away most attempts to integrate nutrition evaluation in routine patient care; there were already too many nutritional status assessment tools only recently to include nutritional risk screening. In theory, nutritional screening would be simple to use and allow early detection of patients who require and/or benefit from timely and cost-effective nutritional intervention 8; others consider nutritional risk screening as the first step to identify patients to be referred to full nutritional assessment and intervention planning 9. Both approaches have limitations and so far no attempt has been made to compare their performance in the same cohort of patients. Therefore, the goal of this cross-sectional study in surgical patients was to test a comprehensive set of nutritional risk and status parameters, in order to assess their utility by exploring their interrelationships, and to propose thereafter a feasible and sensitive method to assess nutritional risk and status in hospital routine practice.
Materials and methods
Study population
This cross-sectional study, approved by the Hospital Ethics Committee according to the 1996 Helsinki Ethics Declaration, was carried out from December 1999 until August 2000 at a 60 beds General Surgical Department in a tertiary University Hospital in Lisbon, Portugal. During this period, all consecutive newly admitted adult patients (≥ 18 years of age) were eligible, those aged ≥ 65 years were defined as elderly10. Exclusion criteria included: coma, bedridden, intermediate and intensive care patients or unable to give informed consent; patients whose surgery took place before nutritional assessments were not included. The assessment of both nutritional risk and nutritional status was always performed within three days of hospital admission, depending on the availability of the investigators (FM and DA), 2 trained and supervised medical students who collected all data, the core of their Clinical Research elective.
Nutritional risk assessment
Nutritional risk was evaluated by Kondrups Nutritional Risk Assessment tool (NRA)11, BAPENs Malnutrition Screening tool (MST)7, Nutrition Screening Initiative (NSI) 12 and by the Admission Nutrition Screening tool (ANST)13. Kondrups NRA has been developed as an evidence-based screening method whereby every patient is evaluated according to recent nutritional changes and disease severity reaching a grade from 1 (slight risk) to ≥ 3 (severe risk). BAPENs MST combines body mass index (BMI) and percentage of weight loss over the previous 6 months; nutritional risk is categorised as severe, moderate or low. NSI is based on nutritional factors, e.g number of meals, diet composition, weight changes, nutritional intake and its impediments, and several other parameters related to diagnosis, oral diseases, financial limitations and drug therapy; the score attributed to each item is then summed-up allowing for the categorisation as high, moderate or low nutritional risk. The ANST is based upon the patients diagnosis or changes in nutritional intake or weight; patients are then categorised as at-risk or non-risk patients.
Nutritional status assessment
Anthropometry Height was measured in the standing position using a stadiometer and weight was measured with a Seca® floor scale and rounded to the nearest 0.5 kg. Unintentional % weight loss was calculated by comparison with the patient´s usual reported weight and classified as severe if >10% in the six months prior to hospital admission. Height and weight were used to calculate Body Mass Index (BMI: weight (kg)/height (m)2), classified as malnutrition when < 20 kg/m2, normal 20-25 kg/m2, over-weight 25-30 kg/m2 and obese > 30 kg/m2 14. Triceps skinfold thickness (TSF in mm) was measured with a skinfold caliper (John Bull, London, UK) at the back of the non-dominant arm, at the midpoint between the tip of the acromial process of the scapula and the olecranon process of the ulna determined with a nonstretchable flexible tape. The fold was held in position while TSF was measured with the caliper placed on the skin just below the fingers lifting up the fat fold; 3 measurements were taken and the average recorded. Mid-arm circumference (MAC in cm) was measured using a non-stretchable flexible tape, perpendicular to the long axis of the arm, at the same site and position as TSF; care was taken not to pinch or gap the tape and measurements were taken in triplicate to the nearest 0.1 cm. Individual values were scored according to reference tables standardised for age and sex15. Patients anthropometric data were assembled to catego-rise nutritional status as obesity/overweight, well-nourished, mild, moderate or severe malnutrition according to McWhirter & Pennington criteria4.
Subjective Global Assessment (SGA) relies on symptoms, reported weight loss, changes in diet in-take, and physical examination to categorise nutritional status as adequate, moderate or severe malnutrition16.
Functional status was evaluated with a Jamar® hand grip dynamometer (Irvington, New York); patients were asked to grip the dynamometer thrice with their non-dominant hand, the average of the 3 measurements was recorded and compared to age and sex standardised tables values provided by the manufacturer; a grip strength below 85% of the reference was considered as malnutrition4.
Statistical analysis
Data were analysed using SPSS 10.0 (SPSS Inc, USA) statistical software. Categorical data were expressed as number of patients and (percentage); continuous data were expressed as mean ± standard deviation and range. Comparisons were made using χ2 test, Students t-test or non-parametric tests as appropriate. Concordance analysis was performed using Kappa coefficient. The Youden value, a parameter that aggregates sensitivity and specificity, was calculated to rank diagnostic tests from –1 (the worst) to 1 (the best). Spearman non-parametric correlations were used to assess relationships. Statistical significance was determined for p < 0.05.
Results
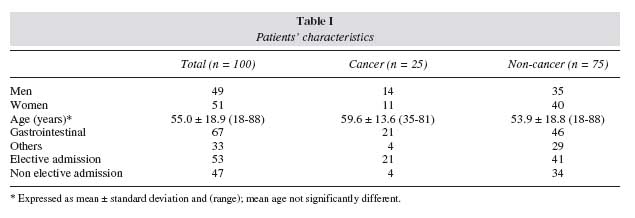
Patients characteristics
The study cohort comprised 100 patients, 51 women: 49 men, mean age 55.0 ± 18.9 (range: 18-88, 35 elderly) years,
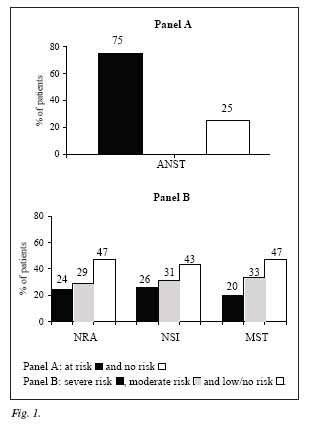
Nutritional risk
Risk categories are shown in figure 1. Univariate concordance analysis between all nutritional risk methods, dividing patients into at-risk or non-risk, showed an agreement between all screening methods, k = 0.69-0.89, p < 0.05; when NRA, NSI and MST divided patients in high, moderate or low risk, concordance was significantly higher (k = 0.87-0.93, p < 0.002). For every method, patients with cancer, ≥ 65 years old or reporting > 10% weight loss in the previous six months were at nutritional risk, p = 0.001.
Nutritional status
At admission, 58% of patients referred an involuntary weight loss of 9 ± 5 (range: 2-27) kg over the previous six months, representing > 10% of their body weight in 21% of patients and > 5% and < 9% in 25%. Weight loss was greater and duration of weight loss was longer in cancer patients (13 ± 5, range: 9-35), p = 0.004.
Patients´ nutritional status according to the remaining four assessment methods is shown in table II. Results display a diversity of categories which are method specific; those relying on anthropometric data are the only able to detect overweight/obese patients, categories absent in SGA where clinical variables are dominant, hence shifting the prevalence towards moderate to severe malnutrition. When analysing the subcategories: well-nourished, mild, moderate or severe malnutrition, BMI and McWhirter displayed a similar pattern and significantly different from the SGA categorisation, p = 0.01. SGA and dynamometry showed a similar distribution pattern.
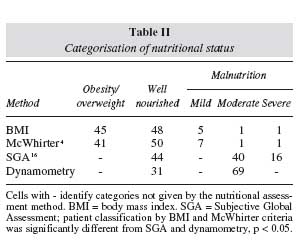
Malnutrition was prevalent in cancer patients and in the elderly, p = 0.02; the latter showed a lower handgrip strength, p = 0.04.
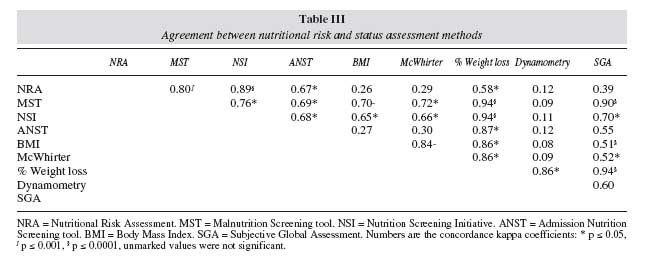
Concordance between nutritional risk and status assessment methods
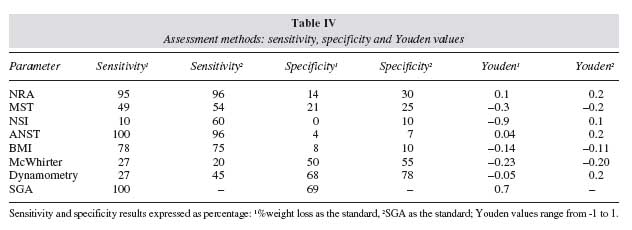
Table III illustrates the concordance analysis between all methods; screening tools were categorised as at-risk and non-risk and status assessment tools as malnourished and adequate. Agreement between nutritional risk methods was consistently significant, k = 0.69-0.89, p < 0.05. Concordance amongst nutritional assessment methods exhibited a broader range (k = 0.51-0.88, p ≤ 0.05), e.g. BMI and SGA agreed with all but dynamometry. Recent weight loss > 10% was the only method that showed concordance with all nutritional risk and status assessment methods (k = 0.86- 0.94, p ≤ 0.05). We further performed an age-adjusted sensitivity and specificity analysis and calculated the Youden value for each assessment method (table IV). Because this is a comparative analysis of 1 or more methods Vs a standard, % weight loss was flagged as the method with consistently superior ability to detect mild to extreme nutritional changes, hence to effectively identify patients at nutritional risk or already malnourished. NRA and ANST were just highly sensitive, while SGA was highly sensitive and specific; furthermore, SGA was the only method with a significant Youden value, thus revealing a strong capacity to effectively detect patients both at high nutritional risk and malnutrition. In order to value the clinical variables comprised in some of the screening methods and given the excellent sensitivity and specificity of SGA, further analysis was performed using SGA as the standard, NRA and ANST maintained their high sensitivity while dynamometry specificity improved, table IV.
Discussion
Lack of education is a key factor for lack of nutritional care 7,17; hence the context in which this study using different methods was devised and conducted by medical students in order to raise awareness and skills.
Nutritional risk. An appropriate patient-centred nutrition care process requires a series of steps with feedback loops; nutritional screening should first identify those patients who are at nutritional risk or who may be malnourished and that should then undergo a full nutritional assessment9,18. The importance of nutritional risk screening is consensual, numerous and increasing methods are at hand and yet they are seldom put into practice19. This study compares results obtained in surgical patients with 4 methods of different complexity and structure, devised in different ways for different purposes. At a first glance their performance in detecting patients at risk of undernutrition was remarkably similar, varying from 75% for ANST13 to 53-57% for the others7, 11, 12. The higher prevalence with ANST, highly sensitive but non-specific, is likely to ensue from its extremely simple structure devised to be used by nurses in busy wards 13. The analysis of our results confirms the validity of ANST to identify patients at-risk for undernutrition, whereas the other 3 tools were able to further recognise the existence of poor nutritional status, thus stressing their higher potential value. Despite the high concordance between those 3 other methods, NRA, NSI and MST, only Kondrups NRA proved to be highly sensitive still non-specific, and seemingly appropriate to screen disease related undernutrition in hospitalised patients and to set up boundaries for nutritional intervention8.
Nutritional status. Accurate nutritional assessments lack age-appropriate standards and variations in the published prevalence or incidence of malnutrition is influenced by the assessment and classification criteria6; in the present study, the prevalence of malnutrition ranged from 7% (BMI) to 69% (dynamo-metry). Clinical evaluation remains the most widely used method 9; it has become almost a dogma that unintentional weight loss > 10% of pre-illness weight, or in the previous 3-6 months, is a dynamic parameter of nutritional status able to screen and identify significant nutritional changes20. Our analyses corroborated its superior performance as well as its ability to detect mild to extreme nutritional changes; hence, weight loss was the best indicator of nutritional deterioration and should be used to identify patients at nutritional risk or with recent onset undernutrition9,21.
In addition to weight loss, 4 different methods were compared; in this group of non-oedematous patients, nutritional status classification was similar when categorised by BMI or McWhirter & Pennington criteria; the prevalence of malnutrition was then 7-9%, while most patients were classified as well nourished or overweight similary to recent reports 22. Regardless of their limitations, methods relying on anthropometry are needed to classify overnutrition or extreme undernutrition. Conversely, SGA classified 56% of patients as malnourished, reaching 69% by dynamometry; the latter did not agree or correlate with any other parameter, but a trend was found between dynamometry and Kondrups NRA (p = 0.06), suggesting that patients at nutritional risk may already have reduced functional capacity; likewise, NRA had a strong concordance with weight loss. SGA combining weight, functional status, and nutritional intake changes16, showed its high sensitivity and specificity indicating a very high performance and a strong capacity to effectively detect patients both at high nutritional risk and undernutrition.
In conclusion, Kondrups NRA emerged as the most sensitive tool to screen nutritional risk in hospitalised patients. The high prevalence of undernutrition (. 58%) in newly admitted surgical patients depended upon the method and criteria used (7-69%); BMI still provides useful information. Recent unintentional weight loss > 10% is a simple method whereas SGA allowed a valid overall nutritional status evaluation. Our results suggest that NRA screening in combination with SGA might optimise outcome-driven nutritional management, to be further validated in larger prospective studies; it certainly would make decisions easier if a gold standard did exist.
Acknowledgements
The Centre of Nutrition and Metabolism is partially funded by a grant from the "Fundação para a Ciência e Tecnologia "(RUN 437).
References
1. "King Fund Centre: A positive approach to nutrition as treatment. London: King" Fund Centre, 1992. [ Links ]
2. Kelly I, Tessier S, Cahill A: Still hungry in the hospital: identifying malnutrition in acute hospital admissions. Q J Med, 2000, 93:93-98. [ Links ]
3. Green CJ: Existence, causes and consequences of disease-related malnutrition in the hospital and the community, and clinical and financial benefits of nutritional intervention. Clin Nutr, 1999, 18:3-28. [ Links ]
4. McWhirter JP and Pennington CR: Incidence and recognition of malnutrition in hospital. BMJ, 1994, 308:945-948. [ Links ]
5. Edington J, Boorman J, Durrant ER, et al.: Prevalence of malnutrition on admission to four hospitals in England. Clin Nutr, 2000, 19:191-195. [ Links ]
6. Heymsfield SB, Tighe A and Wang Z-M: Nutritional assessment by anthropometric and biochemical methods. In: Shils ME, Olson JA, Shike M, eds. Modern nutrition in health and disease. 8th ed. Malvern: Lea and Febiger; 1994, 812-841. [ Links ]
7. BAPEN-Malnutrition Advisory Group: Guidelines for detection and management of malnutrition. Essex: BAPEN; 2000. [ Links ]
8. Kondrup J, Johansen N, Plum L, et al.: Incidence of nutritional risk and causes of inadequate nutritional care in hospitals. Clin Nutr, 2002, 21:461-468. [ Links ]
9. ASPEN Board of Directors: Guidelines for the use of parenteral and enteral nutrition in adult and pediatric patients. JPEN, 2002, 26 (Supl):9SA-11SA. [ Links ]
10. Casimiro C, García de Lorenzo A and Usan L: Evaluation of nutritional risk in ambulatory elderly patients. Nutr Hosp, 2001, 16:97-103. [ Links ]
11. Kondrup J, Rasmussen HH, Hamberg O, Stanga Z and an ad hoc ESPEN Working Group: Nutritional Risk Screening (NRS 2002): a new method based on an analysis of controlled clinical trials. Clin Nutr, 2003, 22:321-336. [ Links ]
12. Chernoff R: Nutrition monitoring and research studies: Nutrition Screening Initiative. In: Berdanier C, ed. Handbook of nutrition and food. Boca Raton, FL: CRC Press; 2002, 463-476. [ Links ]
13. Kovacevich DS, Boney AR, Braunschweig CL, Pérez A and Stevens M: Nutrition risk classifications: a reproducible and valid tool for nurses. Nutr Clin Pract, 1997, 12:20-25. [ Links ]
14. Garrow JS: Treat obesity seriously. Edinburgh: Churchill Livingstone, 1981. [ Links ]
15. Frisancho AR: New norms of upper limb fat and muscle areas for assessment of nutritional status. Am J Clin Nutr, 1981, 34:2540-2545. [ Links ]
16. Detsky A, McLaughlin JR, Baker JP, et al.: What is subjective global assessment of nutritional status? JPEN, 1987, 11:8-13. [ Links ]
17. Council of Europe: Food and nutritional care in hospitals: how to prevent undernutrition. Report and recommendations of the Committee of Experts on Nutrition, Food Safety and Consumer Protection. Strasbourg: Council of Europe Publishing, 2002. [ Links ]
18. American Society of Parenteral and Enteral Nutrition Board of Directors and Task Force on Standards for Specialized Nutrition Support for Hospitalized Adult Patients: Russell MAM, Brewer C, Rogers J, Seidner D. Standards for Specialized Nutrition Support: Adult Hospitalized Patients. Nutr Clin Pract, 2002, 17:384-391. [ Links ]
19. Chernoff R: Normal aging, nutritional assessment, and clinical practice. Nutr Clin Pract, 2003, 18:12-20. [ Links ]
20. Hill G: The clinical assessment of adult patients with protein energy malnutrition. Nutr Clin Prac, 1995, 10:129-130. [ Links ]
21. Klein S, Kinney J, Jeejeebhoy K, et al.: Nutrition support in clinical practice: review of published data and recommendations for future research directions. Am J Clin Nutr, 1997, 66:683-706. [ Links ]
22. Prentice A and Jebb S: Beyond body mass index. Obes Rev, 2001, 2:141-147. [ Links ]

