


Mi SciELO
 Servicios personalizados
Servicios Personalizados
Revista
Articulo
 Inglés (pdf)
 Articulo en XML
 Referencias del artículo
 Enviar articulo por email
Indicadores
-
 Citado por SciELO
 -
 Accesos
Links relacionados
-
 Citado por Google
 -
 Similares en
SciELO
Similares en
SciELO -
 Similares en Google
Compartir

 Permalink
Nutrición Hospitalaria
versión On-line ISSN 1699-5198versión impresa ISSN 0212-1611
Nutr. Hosp. vol.25 no.3 Madrid may./jun. 2010
International BMI-for-age references underestimate thinness and overestimate overweigth and obesity in Bolivian adolescents
Las referencias internacionales de IMC por edad subestiman delgadez y sobreestiman sobrepeso y obesidad en adolescentes bolivianos
A. Baya Botti4, F. J. A. Pérez-Cueto2, P. A. Vasquez Monllor3 and P. W. Kolsteren1,4
1Nutrition and Child Health Unit. Department of Public Health. Prince Leopolod Institute of Tropical Medicine. Antwerp. Belgium.
2Department of Agricultural Economics. Faculty of Bioscience Engineering. Ghent University. Ghent. Belgium.
3Facultad de Ingenieria de Alimentos. Universidad Privada del Valle. Cochabamba. Bolivia.
4Department of Food Safety and Food Quality. Faculty of Bioscience Engineering. Ghent. Belgium.
This project has been financed by Nutrition Third World, a Belgian Foundation and supported by the Prince Leopold Institute of Tropical Medicine.
ABSTRACT
Background: Since no growth standards for adolescents exist and a single reference applicable everywhere is still in debate, it is recognized that the best reference should be derived from the growth pattern of the healthy population that will use it. In 2007 a study developed references for body mass index for 12th to 18th y Bolivian school adolescent (BAP.
Objectives: To compare nutritional status outcomes applying BMI references from the BAP, the Center for Disease Control and Prevention CDC 2000, the International Task Force (IOTF), and the 2007 WHO, to determine appropriateness of use in Bolivian adolescents.
Subjects/methods: References were applied in 3306 adolescents, 45.0% male, 55% female, 12th to 18th y selected from a nationally representative sample.
Results: Main findings reveal that the CDC and the 2007 WHO underestimate underweight (p < 0.001) and the three international references overestimate overweight (p < 0.001) with variation between ages and gender.
Conclusions: Bolivian health providers are advised to replace CDC, OITF and 2007WHO references for the use of BAP in Bolivia which reflects its healthy adolescent population growth pattern. International references may lead to incorrect conclusions when applied on Bolivian adolescents. They could deflect efforts from population which need prompt intervention and mislead treatments and budget to unnecessary ones. We recommend validation of international references where appropriate until a standard is released.
Key words: Body Mass Index (BMI). Bolivia. Adolescents. Bolivian Growth Percentiles. CDC. Growth references. IOTF. Nutritional Status. Overweight. Obesity. Underweight.
RESUMEN
Introducción: Puesto que no existen estándares de crecimiento para adolescentes y la aplicación de una sola referencia a nivel mundial es aún debatible, se reconoce que la mejor referencia es aquella derivada del patrón de crecimiento de la población saludable en la que será posteriormente utilizada. Por ello en 2007 se efectuó un estudio para desarrollar la Referencia Boliviana de IMC poredad (BAP) para adolescentes entre 12 a 18 años).
Objetivos: Comparar la clasificación de adolescentes por categorías nutricionales, aplicando las referencias de IMC boliviano (BAP), la referencia CDC 2000, los puntosde corte de IOTF y de la OMS, 2007.
Métodos y población: Las referencias se aplicaron a los datos medidos de peso y talla de 3.306 adolescentes, 45% varones y 55% mujeres seleccionados de una muestrarepresentativa de la población boliviana.
Resultados: Se observa que CDC y OMS 2007 subestiman la prevalencia de delgadez (P < 0,001) mientras que las tres referencias internacionales sobreestiman el sobrepeso(p < 0,001) con variaciones por edad y género.
Conclusión: Se recomienda al personal de salud boliviano reemplazar las referencias CDC, IOTF y OMS 2007 por la Referencia BAP, la cual refleja el patrón de crecimiento de la población de adolescentes saludables. Las referencias internacionales pueden conducir a conclusiones erróneas cuando se aplican en la población boliviana. Su uso puede desperdiciar esfuerzos y recursos en poblaciones que no necesitan intervención, mientras desatienden aquellas que verdaderamente lo necesitan.
Palabras clave: Índice de Masa Corporal (IMC). Bolivia. Adolescentes. Percentiles bolivianos de crecimiento. CDC. Referencias de crecimiento. Estado nutricional. Sobrepeso. Obesidad. Delgadez.
Introduction
Considerable evidence suggests that malnutrition affects humanperformance, health and survival, physical growth, morbidity, mortality,1,2 cognitive development, reproduction, physical capacity and risks for several adult-onset chronic diseases.3-6. Growth references are used to sentinel malnutrition, and the Body-Mass-Index-for-age (BMI-for-age) reference is the tool of choice to screen and monitor nutritional status of adolescents.7.
In Bolivia, since national references were not available, the National Center for Heath Statistics/World Health Organization NCHS/WHO growth reference, the Centers for Disease Control and Prevention 2000 (CDC) BMI-for-age growth charts,8 and other International references including the International Obesity Task Force (IOTF)9 have been systematically used by clinicians and researchers.10,11 In 2007 a new WHO refe rence12 was released for 5 to 19 year old children, which can be expected to be adopted soon in Bolivia.
Because developing country specific references is a labour intensive and expensive exercise, many countries adopt international references. Worldwide, CDC and IOTF references are most frequently used.13,14 Shortcomings in consistent use have been recognized9,15-19 which lead a number of researchers to question the use of international references to classify individuals in developing countries.13,20,21 However very little information exists on comparing outcomes between international and local reference data for countries were the majority of the population is not from Caucasian or Asian descent. Although some studies have recommended the use of an international reference for countries whose population has not been part of the reference population,14 others suggest more caution because of either over or under-estimating overweight and/or obesity using the CDC 2000 and IOTF reference, andrecommend the use of national references.13,22.
The CDC growth charts released in 200023 replaced the older 1977 version of the National Center for Health Statistics (NCHS) reference. The NCHS reference was developed with data from individuals who were evaluated on the first National Health and Nutrition Examination Survey (NHANES I) in 1971-197423 and the FELS longitudinal study. CDC 2000 BMI-for age is now recommended for routine use in Canada, Australia, Chile and Mexico among other countries24 to screen for underweight, normal weight, at risk of overweight and overweight (obese) children and adolescents.
The IOTF references were derived from pooled data sets from a population of 98.159 individuals 0 to 25 years old from six countries. The reference considers BMI-for-age cut-offs linked to adult cut-off points of 25 kg/m2 and 30 kg/m2 for obesity at age 18. In 2007, the IOTF provided an additional reference for thinness.25
In 2006,26 a working group of experts on growth and development and representatives from international organizations studied the feasibility to develop international growth standards for school-aged children and adolescents. They recommended the development of a growth standard to replace the currently used international reference. Considerations for the new standard were that it should reflect growth of a healthy population that could express its full genetic potential, and could capture the variations in human growth patterns by its multiethnic composition.
Growth data initially from 45 countries were reviewed, but difficulties to build a functional reference from these data sets, lead to the use of a statistical approach instead. The new WHO reference is based on the 1977 NCHS/WHO growth reference data,27 merged with data from the WHO Child Growth Standards.28 In 2007 the WHO growth references for school children and Adolescents was released for BMI-for-age, weight-for-age and height-for age.
At present, there are three internationally recommended references: CDC 2000, WHO 2007 and IOTF. Populations from non-Caucasian ancestry such as South America, the Middle East, the African Continent, and Central America29 are not represented in these references and there is little information on how the international BMI-for-age reference apply in these populations.
The choice of reference is critical, because misleading outcomes could result in important bias in the classification of individuals.9,15,30 This concern is evident in Bolivia, and a large part of the South American Western continent with a predominant Andean ancestry population (more than 160 million people), where differences in genetic ancestry, altitude, and diet may have shaped body composition over time to fit environmental needs. It is possible that this population is particularly different in growth characteristics from the population used todevelop the international references.31.
In 2007 the Bolivian Metabolic Syndrome in Adolescence Study (MESA) developed BMI-for-age references for adolescents 12-18 y, called Bolivian Adolescent Percentiles (BAP). Since the BMI-for-age percentile values for this population are available,31 the aim of the present report is to compare nutritional classification outcomes using the CDC 2000, the IOTF, the 2007 WHO reference and the BAP and to assess the implications of using different international references when assessing nutritional status of 12 to 18 year old adolescents.
Methods
The BMI-for-age values from 3,306 healthy adolescents were used. Data were obtained from a representative sample of adolescents, randomly selected with replacement, from the self-reported healthy students of 32 schools located in the 327 counties of Bolivia, considering population proportions. The Univalle University Ethics Committee and the Bolivian Ministry of Education approved the protocol. Ethical procedures meet the terms of the Helsinki declaration of 1975 reviewed in 2000. Informed consent was obtained from all participants, and a legal guardian.
Data on heights and weight from participants were recorded for each individual by trained personnel following standard procedures.32 Weight was recorded in light, indoor clothing with a Beurer's digital scale to the nearest 0.1 kg; height was measured without shoes to the nearest 0.1 cm using a wall-stadiometer.
Reference values for BMI-for-age were developed with the formula weight (kg)/height2 (m). Smoothed values were obtained at the 5th, 50th, 85th and 95th percentiles by the LMS method33. The LMS Pro software used for data management came from the institute of Child Health, London. Descriptive statistics were computed using SPSS v 12 and graphs and charts from LMSChartMaker 2006.
Percentile values from the CDC, IOTF, and 2007 WHO reference as well as BAP were applied to the sample data.
Nutritional categories followed NCHS/WHO cutoff33 percentile classification: underweight/thin < 5th BMI-for-age; healthy weight 5th < BMI-for-age < 85th; overweight 85th < BMI-for-age < 95th; and obese BMIfor-age > 95th. The same percentiles cut-offs were used for the CDC 2000, 2007 WHO and BAP. IOTF cut-off points as described by Cole et al. (2002) were used for overweight and obesity9 and from Cole et al. (2007)24 to define thinness based on respectively BMI cut offs of 25, 30 and 18.5 at the age of 18 years.
Comparisons between the three references and BAP were performed for the nutritional classification for the total population by age and gender.
Prevalence of each category was expressed as a proportion. For significance the nonparametric McNemar test was applied. Statistical analyses were performed using SPSS v.15 Software (SPSS Inc. Chicago, Illinois 60606); p values < 0.05 were considered as statistically significant.
Results
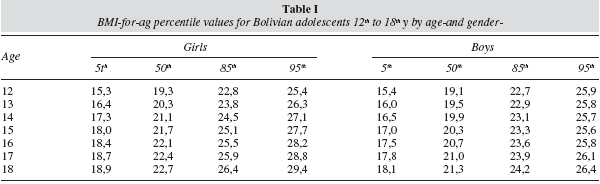
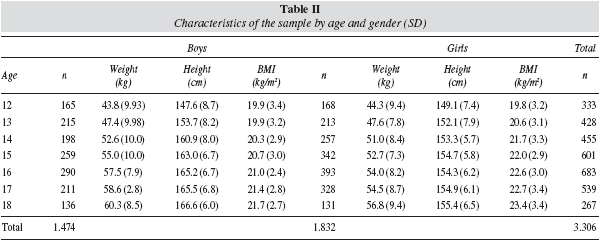
References were applied to 3306 adolescents, 45% males and 55% females, 12 to 18 years old. Table I shows the characteristics of the sample. Table II shows the Bolivian adolescent percentile values at 5th, 50th, 85th, and 95th percentile.
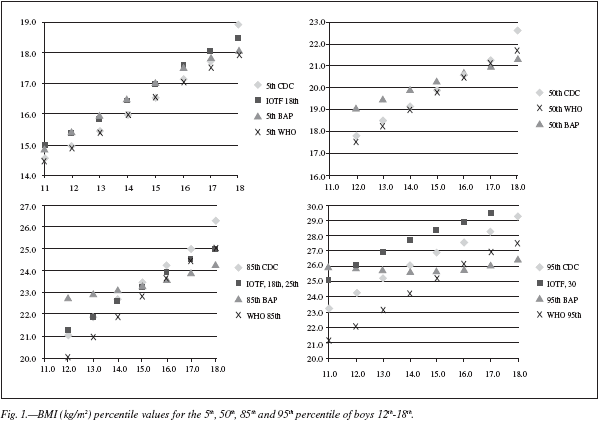
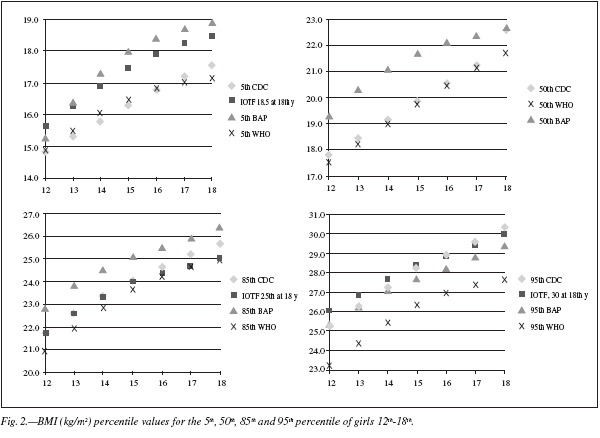
The percentile plot values between references applied to the adolescents reveals that the growth pattern of Bolivian adolescent follows a distinct shape compared to the adolescents from the CDC 2000, and WHO 2007 references. Figures 1 and 2 show the pattern of the 5th, 50th, 85th and 95th percentiles for boys and girls for each one of the references mentioned. BMI in Bolivian girls was higher at all ages, been 1.2 points higher than the American girls at age 12, and 1.4 point higher at age 16 y. (average 1.5 kg/m2). The difference in BMI in 12 to 16 year old boys was 2.1 points higher at age 12 and 0.1 at 16year of age.
IOTF, CDC and 2007 WHO and BAP reference produced different estimates for all nutritional status categories (p < 0.001) except for the BAP-CDC for obesity and IOTF for thinness. Overall, both the CDC and the 2007 WHO references yielded lower prevalence of underweight and higher prevalence of overweight (p <0.001) than BAP (table III).

The comparison of the four references for adolescent boys (table IV) show only statistical difference between BAP and CDC estimates in the classification of thinness (P < 0.001) where CDC underestimates the actual prevalence by 52%. The differences between BAP and IOTF estimates were significant for overweight and obesity. IOTF overestimates the overall prevalence of overweight (p < 0.001) but underestimates the overall prevalence of obesity in boys (p < 0.001). Concerning the BAP - 2007 WHO comparison, WHO's reference underestimates thinness and healthy weight while overestimates obesity prevalence (p < 0.001).

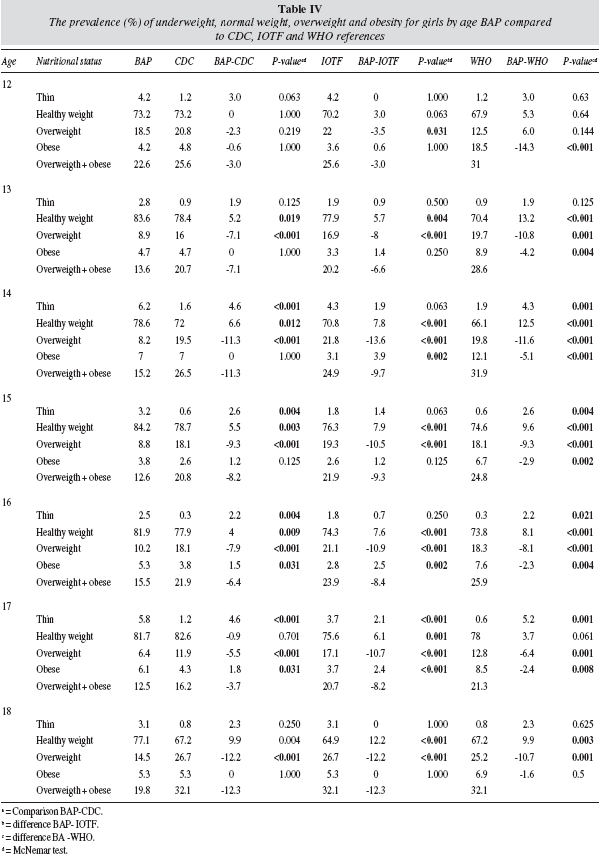
Table V shows that overall differences in classification of girls according to CDC, IOTF or 2007 WHO were significant (p < 0.001) compared to BAP. All international references tend to underestimate thinness, while overestimating overweight. Obesity levels are on the other hand underestimated with the exception of the WHO 2007 that also overestimates obesity.
American adolescents are taller than Bolivians. Comparing the 50th percentile of both populations, boys the difference is smallest at the beginning of adolescence, being 1.0 cm at 12y, increasing to 7.1 at 15 yr and 9.6 cm at 18 y. In girls the differences are even more sticking with a difference of 7.6 cm at age 12 increasing to 11.5 cm at 15 yr and 12.1 cm at age 18. Comparing the weight percentiles reveals that the 50th percentile at 12 years for Bolivian boys is 1.57 kg higher than for their American counterparts. This trend reverses with age and by the age of 15 American adolescents are 2.66 kg heavier increasing to 8.3 kg by the age of 18. A similar although less pronounced trend is seen in girls. Bolivian girls weight 0.85 kg more than Americans at age 12, but by15 y American adolescents are 0.43 kg heavier increasing to 2.0 kg at the age of 18.
Discussion
International references are useful to compare between studies and countries and for monitoring global trends of overweight and obesity, but there is no conclusive evidence to prove that they are valid in developing countries34. The present study shows that the application of international references could be inappropriate for certain populations. Emplying the CDC 2000, and WHO 2007 references in Bolivian adolescents yielded underestimation of thinness at specific ages, while overestimation of overweight happened when the IOTF's reference was applied.
Our results raise concern about the difference in classification of categories of nutritional status using BAP in relation to CDC, IOTF and 2007 WHO references which have important clinical implications in diagnosis and policy performance.
Underestimating the prevalence of underweight/ thinness in girls with the CDC and the 2007 WHO reference for girls 14 to 17 y and in boys at 13 and 16 y could be critical since underdiagnosed children might be at risk of nutritional deficiencies that could remain untreated. Underestimating underweight in girls by the CDC classification may possibly reinforce behaviour associated with the belief that thinness is important for attractiveness at that age, whilst increasing risk of malnutrition, micronutrient deficiencies, and associated diseases.
The use of BAP values for estimating nutritional status revealed a higher prevalence of underweight in adolescents. The cut-off values of the BAP charts, in contrast to the CDC and IOTF, allow identification of a larger number of adolescents with low weight and therefore provide the probability to them to receive prompt intervention.
On the other side of the spectrum the CDC, IOTF and 2007 WHO references overestimate the prevalence of overweight in 13 to 18 y girl adolescents and IOTF in boys 12 to 14 y all of which are under the 85th percentile of the Bolivian adolescent population distribution. Apart from the possibility to spend resources on unnecessary treatments, overestimation of overweight could give adolescents a false sense of their body weight status, making them feel overweight or obese. It could seriously affect their self esteem and body image and induce manners that could lead to weight loss or improper eating habits.
Although it has been widely considered that population from developing countries have lower BMI, this does not appear to be the case with Bolivian adolescents. Bolivian girls and boys present considerable higher median BMI values at 50th percentile at all 12 to 18 y, and boys present higher values from 12 to 16 y, respectively compared to North Americans.
Used for nutritional surveillance, the CDC, 2007 WHO and IOTF references could mask the prevalence of underweight giving a false notion to individuals, families, health providers and the government that levels of underweight are low, distracting them from the actual seriousness of the problem. Using the international reference to target groups in deprived areas with malnutrition could bypass those in need for support .
The differences in growth pattern of Bolivian adolescent may be attributable to genetic factors, influence of altitude adaptation, or other environmental factors. Although, to the knowledge of the authors no studies have done on genetic variation on growth of the Bolivian population, ethnic associated genetic polymorphisms in the Bolivian population has been documented. Differences in drug metabolism have been described between Bolivians and Caucasian, Asian, Oceanian, and African populations35 which might be the result of long periods of environmental exposure to the conditions encountered in these areas. This type of specific exposure may have increased frequencies in certain genes that control growth as a result of adaptation. How the genetic pool has changed these patterns of growth due to genetic mixing of the last 500 years remains to be studied.
One problem with developing references is always the question on the golden standard. In the studied population there will be a certain degree of children who participated, who have not been able to express their full genetic potential. But even if this is certainly the case, it is very unlikely that this explains all the differences that have been observed. Moreover the fact that the comparison with the IOTF and the CDC and the WHO reference give different prevalence estimates proves that these references represent populations between them. Perhaps is this case it might be more appropriate to use a local reference, in particular for BMI for age, where body distribution of fat might be more genetically determined.
It seems prudent to advice adding to the evaluation of the Bolivian population also the use of the Bolivian adolescent percentile (BAP) values and charts for nutritional diagnosis, growth monitoring and risk assessment, since it could reflects more specifically Bolivian adolescent's growth pattern and allow a more balanced judgement of the degree of malnutrition in this population group.
Acknowledgments
The authors thank specially the adolescents and their parents for their trust and participation in the study; to the School directors for opening their doors and allowing the survey to be performed. We want to thank to medical students and the staff of the Faculty of Medicine of the Universidad del Valle for their assistance during data collection. The authors are in debt with Aime De Souza, whom has taken much of the work of data transcription. We are also thankful to Joris Menten for his advice in data analysis and Carl Lachat for his collaboration in the revision of the manuscript.
References
1. Pelletier DL, Frongillo EA, Jr., Habicht JP. Epidemiologic evidence for a potentiating effect of malnutrition on child mortality. Am J Public Health 1993; 83: 1130-3. [ Links ]
2. Pelletier DL, Frongillo EA, Jr., Schroeder DG, Habicht JP. A methodology for estimating the contribution of malnutrition to child mortality in developing countries. J Nutr 1994; 124: 2106S-22S. [ Links ]
3. Flegal K, Carroll MD, Kuczmarski RJ, Johnson C. Overweight and obesity in the United States: prevalence and trends, 1960-1994. International Journal of Obesity 1998; 22: 39-47. [ Links ]
4. Flegal KM, Graubard BI, Williamson DF, Gail MH. Excess deaths associated with underweight, overweight, and obesity. JAMA 2005; 293:1861-7. [ Links ]
5. Dietz WH. Health consequences of obesity in youth: Childhood predictors of adult disease. Pediatr 1998; 101: 518-25. [ Links ]
6. Freedman DS, Khan LK, Dietz WH, Srinivasan SR, Berenson GS. Relationship of childhood obesity to coronary heart disease risk factors in adulthood: the Bogalusa Heart Study. Pediatr 2001; 108: 712-8. [ Links ]
7. Dietz WH, Bellizzi MC. Introduction: the use of body mass index to assess obesity in children. Am J Clin Nutr 1999; 70: 123S-5S. [ Links ]
8. Kuczmarski RJ, Ogden CL, Guo SS. 2000 CDC Growth charts for the United States: Methods and development 2. Series 11, 246, 1-190. 2002. Hyattsville, Maryland, National Center for Health Statistics. Vital Health Stat. Ref Type: Report. [ Links ]
9. Cole TJ, Bellizzi MC, Flegal KM, Dietz WH. Establishing a standard definition for child overweight and obesity worldwide: international survey. BMJ 2000; 320: 1240-3. [ Links ]
10. Benefice E, Lopez R, Monroy SL, Rodriguez S. Fatness and overweight in women and children from riverine Amerindian communities of the Beni River (Bolivian Amazon). Am J Hum Biol 2007; 19: 61-73. [ Links ]
11. Pérez-Cueto A, Almanza M, Kolsteren P. Female gender and wealth are associated to overweight among adolescents in La Paz, Bolivia. Eur J Clin Nutr 2005; 59: 82-7. [ Links ]
12. De Onis M, Onyango AW, Borghi E, Siyam A, Nishida C, Siekmann J. Development of a WHO growth reference for school-aged children and adolescents. Bull World Health Organ 2007; 85: 660-7. [ Links ]
13. Wang Y, Wang JQ. A comparison of international references for the assessment of child and adolescent overweight and obesity in different populations. Eur J Clin Nutr 2002; 56: 973-82. [ Links ]
14. Goldstein A, Haelyon U, Krolik E, Sack J. Comparison of body weight and height of Israeli schoolchildren with the Tanner and Centers for Disease Control and Prevention growth charts. Pediatr 2001; 108: E108. [ Links ]
15. Río-Navarro BE, Velázquez-Monroy O, Santos-Preciado JI et al. Mexican anthropometric percentiles for ages 10-18. Eur J Clin Nutr 2007; 61: 963-75. [ Links ]
16. De Onis M, de Onis M, Onyango AW, Borghi E, Garza C, Yang H. Comparison of the World Health Organization (WHO) Child Growth Standards and the National Center for Health Statistics/WHO international growth reference: implications for child health programmes. Public Health Nutr 2006; 9: 942-7. [ Links ]
17. De Onis M, Garza C, Habicht JP. Time for a new growth reference. Pediatr 1997; 100: E8. [ Links ]
18. Garza C, De Onis M. Rationale for developing a new international growth reference. Food Nutr Bull 2004; 25: S5-14. [ Links ]
19. Woodruff BA, Duffield A. Anthropometric assessment of nutritional status in adolescent populations in humanitarian emergencies. Eur J Clin Nutr 2002; 56: 1108-18. [ Links ]
20. Roberfroid D, Lerude MP, Perez-Cueto A, Kolsteren P. Is the 2000 CDC growth reference appropriate for developing countries? Public Health Nutr 2006; 9: 266-8. [ Links ]
21. Wang Y, Adair L. How does maturity adjustment influence the estimates of overweight prevalence in adolescents from different countries using an international reference? Int J Obes Relat Metab Disord 2001; 25: 550-8. [ Links ]
22. Hosseini M, Carpenter RG, Mohammad K, Jones ME. Standardized percentile curves of body mass index of Iranian children compared to the US population reference. Int J Obes Relat Metab Disord 1999; 23: 783-6. [ Links ]
23. Must A, Dallal GE, Dietz WH. Reference data for obesity: 85th and 95th percentiles of body mass index (WT/HT) and triceps skinfold thickness. Am J Clin Nutr 1991; 53: 839-46. [ Links ]
24. Cole TJ, Flegal KM, Nicholls D, Jackson AA. Body mass index cut offs to define thinness in children and adolescents: international survey. BMJ 2007; 335: 194. [ Links ]
25. Cole TJ, Flegal KM, Nicholls D, Jackson AA. Body mass index cut offs to define thinness in children and adolescents: international survey. BMJ 2007; 335: 194. [ Links ]
26. Butte NF, Garza C, De Onis M. Evaluation of the feasibility of international growth standards for school-aged children and adolescents. J Nutr 2007; 137: 153-7. [ Links ]
27. Hamill PV, Drizd TA, Johnson CL, Reed RB, Roche AF. NCHS growth curves for children birth-18 years. United States. Vital Health Stat 1977; 11: i-74. [ Links ]
28. WHO Child Growth Standards based on length/height, weight and age. Acta Paediatr Suppl 2006; 450: 76-85. [ Links ]
29. Martorell R, Schroeder DG, Rivera J, Kaplowitz HJ. Pattern of linear growth in rural Guatemala, adolescents and children. J Nutr 1995; 125: 1060-7. [ Links ]
30. Flegal KM. Defining obesity in children and adolescents: epidemiologic approaches. Crit Rev Food Sci Nutr 1993; 33: 307-12. [ Links ]
31. Baya A, Pérez-Cueto A, Vasquez-Monllor P, Kolsteren P. Anthropometry of height, weight, arm, wrist, and abdominal circumference and body mass index, for Bolivian adolescents 12 to 18 y - Bolivian adolescent percentile values from the MESA study. Nutr Hosp 2009; 24 (3): 304-11. [ Links ]
32. WHO. Physical status: The use and interpretation of anthropometry. Report of a WHO Expert Committee. 854, 1-453. 1995. Geneva, WHO. WHO Technical Report Series. Ref Type: Report. [ Links ]
33. Cole TJ, Freeman JV, Preece MA. Body mass index reference curves for the UK, 1990. Arch Dis Child 1995; 73: 25-9. [ Links ]
34. Wang Y, Monteiro C, Popkin BM. Trends of obesity and underweight in older children and adolescents in the United States, Brazil, China, and Russia. Am J Clin Nutr 2002; 75: 971-7. [ Links ]
35. Bravo-Villalta HV, Yamamoto K, Nakamura K, Baya A, Okada Y, Horiuchi R. Genetic polymorphism of CYP2C9 and CYP2C19 in a Bolivian population: an investigative and comparative study. Eur J Clin Pharmacol 2005; 61: 179-84. [ Links ]
![]() Correspondence
Correspondence
Ana Baya Botti.
PO Box 6557.
Cochabamba, Bolivia.
E-mail: baya.ana@gmail.com
Recibido: 3-VI-2009.
Aceptado: 5-VI-2009.

