


Mi SciELO
 Servicios personalizados
Servicios Personalizados
Revista
Articulo
 Inglés (pdf)
 Articulo en XML
 Referencias del artículo
 Enviar articulo por email
Indicadores
-
 Citado por SciELO
 -
 Accesos
Links relacionados
-
 Citado por Google
 -
 Similares en
SciELO
Similares en
SciELO -
 Similares en Google
Compartir

 Permalink
Nutrición Hospitalaria
versión On-line ISSN 1699-5198versión impresa ISSN 0212-1611
Nutr. Hosp. vol.33 no.3 Madrid may./jun. 2016
https://dx.doi.org/10.20960/nh.263
TRABAJO ORIGINAL / Nutrición en el anciano
Food consumption and risk of malnutrition in community-dwelling very old Spanish adults (≥ 80 years)
Consumo de alimentos y riesgo de malnutrición en personas muy mayores (≥ 80 años) de vida independiente
Susana Jiménez-Redondo1, Beatriz Beltrán de Miguel1, Javier Gómez-Pavón2,3 and Carmen Cuadrado Vives1
1Department of Nutrition. Pharmacy Faculty. Universidad Complutense de Madrid. Madrid, Spain.
2Geriatric Department. Hospital Central de la Cruz Roja. Madrid, Spain.
3Older People Health Observatory. Villanueva de la Cañada, Madrid. Spain
ABSTRACT
Introduction: There are few studies assessing overall diet and food patterns of the oldest population.
Objectives: To examine food groups consumption (grams and servings) and their compliance with the dietary guidelines in community-dwelling very old Spanish adults. The relationship with the risk of malnutrition was also studied.
Methods: Within the cross-sectional health study of elderly people of Villanueva de la Cañada (Madrid, Spain), in 98 non-institutionalized elders aged ≥ 80 years (66% women) food consumption was calculated from a 24-hour dietary recall and nutritional risk was assessed by Mini Nutritional Assessment (MNA). Statistical significance was evaluated at 95% confidence level (p < 0.05).
Results: Men consumed significantly higher amounts of snacks/pickles and alcoholic beverages. The consumption of cereals/grain products (2 servings/day), vegetables (1.5 servings/day) and meat, fish, eggs (1.4 servings/day), was below desirable levels. As nutritional status got worse, fruit consumption was significantly smaller (p = 0.039). Relatively weak but highly significant correlations were found between MNA and oils/fats, fruits and alcoholic beverages. After adjustment for energy intake, oils and fats and fruits associations disappeared whereas a negative association between milk/dairy products and MNA was found.
Conclusions: Dietary patterns of the elderly population of Villanueva are departing from the traditional Mediterranean diet and though adequate consumption of fruits, milk/dairy products, oils/fats and sugar/confectionery has been achieved, cereals/grain products, vegetables and the meat,fish,eggs group consumption was below the desirable levels. Deterioration of the nutritional status coincided with a reduction in the consumption of all food groups except for ready meals and milk/dairy products whose consumption increased. Further research on the influence of fruit, milk/dairy products, wine and olive oil consumption on nutritional status is required.
Key words: Community-dwelling very old people. Mini Nutritional Assessment (MNA). Dietary patterns. Servings. Dietary guidelines.
RESUMEN
Introducción: existen pocos estudios que valoren el consumo de alimentos de la población muy mayor.
Objetivos: evaluar el consumo de los grupos de alimentos (gramos y raciones) y su adecuación a las recomendaciones para la población anciana española. Además se estudia su relación con el riesgo nutricional.
Métodos: dentro del estudio transversal sociosanitario en mayores de Villanueva de la Cañada (Madrid), en 98 individuos ≥ 80 años (66% mujeres) se evaluó el consumo de alimentos a partir de un recuerdo-24 horas y el riesgo nutricional fue valorado mediante Mini Nutritional Assessment (MNA). La significación estadística se evaluó a nivel de confianza del 95% (p < 0,05).
Resultados: los hombres consumieron significativamente mayor cantidad de aperitivos y bebidas alcohólicas. El consumo de cereales y derivados (2 raciones/día), verduras y hortalizas (1,5 raciones/día) y alimentos del grupo carnes, pescados y huevos (1,4 raciones/día) no alcanzó las recomendaciones. Al empeorar el estado nutricional el consumo de frutas fue significativamente menor (p = 0,039). Se han encontrado correlaciones relativamente débiles, pero altamente significativas entre el MNA y el consumo de aceites/grasas, frutas y bebidas alcohólicas. Tras ajustar la ingesta de energía, la asociación con los aceites/grasas y con las frutas desaparece mientras que surge una asociación negativa con el consumo de lácteos.
Conclusiones: el patrón alimentario observado se desvía del mediterráneo tradicional. Así, aunque existe un consumo adecuado de lácteos, frutas, aceites/grasas y azúcares/dulces, el consumo de cereales y derivados, verduras y hortalizas y alimentos del grupo carnes, pescados y huevos no alcanzó las recomendaciones. El deterioro del estado nutricional coincide con una disminución en el consumo de todos los grupos de alimentos menos en el caso de los precocinados y los lácteos cuyo consumo aumenta. La infuencia del consumo de fruta, lácteos, vino y aceite de oliva sobre el estado nutricional requiere más investigación.
Palabras clave: Personas muy mayores de vida independiente. Mini Nutritional Assessment (MNA). Patrón alimentario. Raciones. Recomendaciones dietéticas.
Introduction
Elderly people are a highly heterogeneous group since old age covers an age range of more than 40 years and there are great differences from one individual to another. The age group composed of people of 80 years and over will be the fastest growing segment of the population in the decades to come (1). An extensive body of literature indicates that not only an appropriate nutrient intake but also a balanced consumption of food groups, considering diet as a whole, contribute to healthy ageing. Food pattern analysis can enhance our understanding of current dietary practices, provide a way to evaluate health outcomes of those who adhere to dietary guidelines and produce results that may be directly applicable to guidelines updating (2). To our knowledge, there are few published studies assessing overall diet and food patterns in non-institutionalized elderly people and even fewer concerning the oldest old. Although there are some studies that associated Mediterranean diet and healthy aging in the elderly (3), there is hardly any study that focuses in the existence of scientific evidence that good food patterns benefit subjects, institutionalized or not, aged 80 years and above (4,5). More studies characterizing food consumption and other factors affecting food patterns in very old people are required as an approach to implementing adequate nutritional policies in order to improve the nutritional status of these individuals because "it's never too late" (6).
Objectives
The aim of this paper was to examine the consumption of the different food groups (in grams and servings) and their compliance with current dietary guidelines for the Spanish elderly population in a sample of community-dwelling very old adults living in Villanueva de la Cañada (Madrid, Spain). In addition, the relationship between MNA and food groups consumption was studied.
Material and methods
In 2011, a cross-sectional survey -the Villanueva Study of Health in the Elderly- was carried out in very old women and men living in Villanueva de la Cañada (16,804 registered inhabitants), Madrid, Spain (7,8). All non-institutionalized inhabitants aged 80 years and above (n = 264) were invited by letter to participate in a comprehensive geriatric evaluation. Fifty-eight elders refused to participate and 108 could not be evaluated due to missing data necessary to locate people or because they lacked a permanent place of residence. Finally, 98 non-institutionalized inhabitants aged 80 years and over (65 women and 33 men) were involved. All were clearly informed that involvement was voluntary and that they could withdraw from the study whenever they wanted. There were no significant differences in age or sex between participants and non-participants. Interviews were performed by two geriatricians and one nutritionist at the primary health care centre or at subjects' homes when transfer of the subject to the centre was impossible. The caregiver or a relative was interviewed only if the subject was cognitively impaired. Data was collected by interview from February 2011 to June 2011. Written informed consent was obtained from each subject or cohabiting next of kin.
Within a comprehensive health assessment protocol for very old people, the nutritional assessment tools included were the following:
- Dietary assessment. The evaluation of food consumption was conducted using 24-hour dietary recall, in which an interviewer asked the subject to enumerate and quantify the foods and beverages consumed in the preceding full day. Consumed quantities were estimated in units (e.g. fruits), servings and home-made measurements standardized for this study (9). Consumption data (g/person/day) were classified into 15 food groups using the Spanish Food Composition Data Base by Moreiras et al. (9) utilized in other studies involving elderly people (10,11): cereals and grain products, milk and dairy products, eggs, sugar and confectionery, oils and fats, vegetables, legumes, fruits, meat and meat products, fish and seafood, alcoholic beverages, non-alcoholic beverages, sauces and condiments, ready meals, snacks and pickles. In the present study, the sauce and condiment group was not considered due to a very low consumption, and eggs, fish and seafood, and meat and meat products were also gathered together into a new group, the meat, fish and eggs food group. This daily consumed new group composed of rich in high quality animal protein food groups was built in order to compare our results to other studies. The mean daily intakes (grams) of the food groups consumed daily were expressed also in servings and then compared to the Spanish food-based dietary guidelines for the elderly population, a modified version of Russell et al. (12) by Carbajal (13). The serving sizes of the daily consumed food groups (edible portion) were: 50 g of cereals and grains products, 175 g of vegetables, 125 g of fruits, 125 g of meat, fish and eggs and 125 g of milk and dairy products.
- Nutritional screening test, Mini Nutritional Assessment (MNA). It is a clinical tool that is usually included in comprehensive geriatric evaluation to identify subjects at risk for malnutrition (17-23.5 points) and malnourished (< 17 points). Subjects scoring ≥ 24 points are well nourished. The MNA includes 18 items involving anthropometrical, dietary and subjective measurements. The MNA is well validated and correlates highly with clinical assessment and objective indicators of nutritional status (body mass index, energy intake and vitamin intake). MNA scores demonstrated both high sensitivity (98%) and high specificity (96%) (14).
The study was conducted under a cooperative agreement between the Complutense University of Madrid and the Villanueva de la Cañada City Council. It was performed in accordance with the guidelines laid down in the Declaration of Helsinki and all procedures were approved by the Research Committee of the Faculty of Pharmacy (Complutense University of Madrid).
DATA ANALYSIS
Statistical analysis was performed using SPSS 19.0. Participant characteristics were stratified by sex and reported as frequencies when categorical and as means and standard deviations when continuous. Food group consumption was stratified by sex and nutritional status (MNA), and the findings expressed as minimum and maximum values, percentiles (P25, P50, P75) and means and standard deviations. Comparisons between groups were estimated using, as appropriate, Mann-Whitney U test, Chi-square test, Chi-square test with Bonferroni's correction, two-sample t-test and Kruskal-Wallis test or Anova test. Correlation study of the MNA score and food group consumption was performed using Spearman's rho for non-parametric analysis. The level of significance used was 5%.
Results
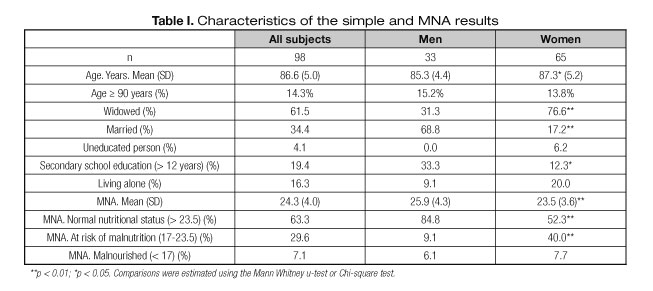
Table I presents the sample characteristics and MNA results. The mean age was 86.6 ± 5.0 years and 28% were aged ≥ 90. There were significant differences in marital status (the majority of women were widowed) and in the percentage of people with secondary studies. Sixteen participants, all octogenarians, lived alone. According to the MNA results, 29.6% were at risk for malnutrition and 7.1% were malnourished. Significant differences were observed between men and women in terms of nutritional status score and the percentage of elders with normal nutritional status and at risk for malnutrition, but not when compared for malnourishment.
Food group consumption expressed in grams/day is shown in table II. The food groups consumed in the greatest amounts were milk and dairy products, and fruits. Men reported significantly higher consumption of snacks and pickles than women (3.5 ± 7.2 vs. 1.2 ± 6.5; p = 0.02) and of alcoholic beverages (79.7 ± 122.8 vs. 17.6 ± 63.1; p = 0.00). Women showed higher consumption of meat and meat products and of non-alcoholic beverages, whereas men had higher intake of fish and seafood, fruits and vegetables but these differences were not statistically significant.
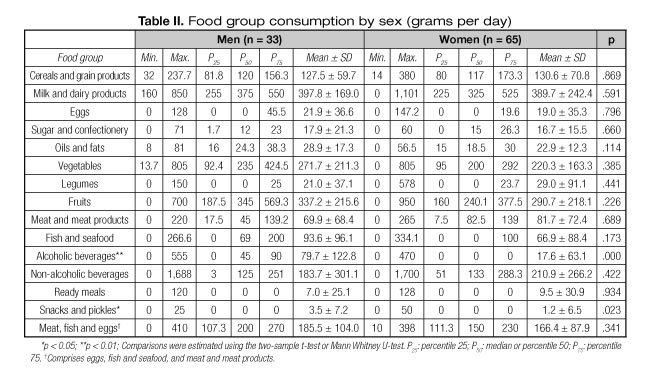
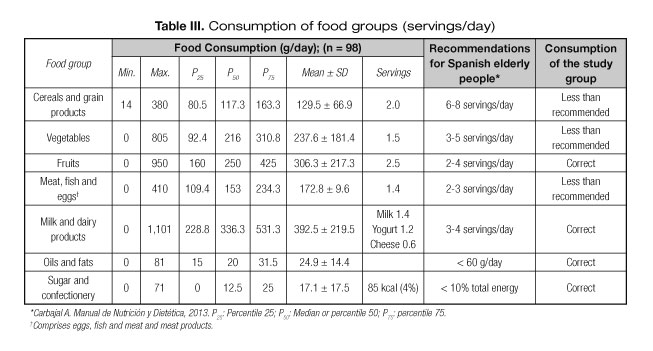
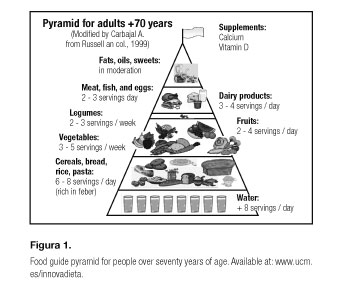
Table III presents food group consumption, converted to servings, in the overall sample, comparing it with the Spanish food-based dietary guidelines for elderly population modified by Carbajal (13) from Russell et al. (12) (Fig. 1). According to the findings, the study group followed the recommendations for most of the food groups. The consumption of cereals and grain products (2 servings/day), vegetables (1.5 servings/day) and meat, fish and eggs (1.4 servings/day) food groups was below desirable levels.
Consumption of food groups according to nutritional status measured by means of MNA and the correlation study between food group consumption and nutritional status are reported in table IV. Significant differences were found for the consumption of fruits (p = 0.04). Elders found to be malnourished had higher intake of ready meals and milk and milk products but differences were not statistically significant. Neither alcoholic beverages nor snacks and pickles were consumed by elders in whom the MNA indicated malnourishment.
Relatively weak but highly significant correlations were found between MNA score and oils and fats (p = 0.004), fruits (p = 0.007) and alcoholic beverages (p = 0.011). Oils and fats and fruits associations disappeared after further adjustment for energy intake whereas a negative association between milk and dairy products and nutritional status appeared (p = 0.029).
Discussion
The present study assessed food patterns of non-institutionalized individuals aged 80 years and over living in a small Spanish town. As far as we know, this is the first study of food consumption of community-dwelling very old people living in a similar urban area. The subjects of previous relevant Spanish studies involving elderly people, such as SENECA, did not reach these ages (11). Spanish participants in the Euronut-SENECA study were aged 71-80 years (12) and the results of the EPIC-Elderly study, although they included people aged 80 and above, were not differentiated by age group (15). A limited number of nutritional surveys considering food consumption at the individual level have been carried out in Spain to assess the nutritional status in random samples of the populations of specific regions (16-20) but in these studies the cut-off ages were below 80 years old except for the survey carried out in Madrid region (ENUCAM), in which people aged 65 years and over were included as a group but no differences by age within this group were shown (20). The study of a very old community dwelling population is complex because there is less population and the participation rate is normally lower than in younger elders. In a German study that described energy and nutrient intake of free-living elderly people with special focus on age-related differences (21) the participation rate was markedly higher in the young-old (65-74 years; 50.1%) compared to the very-old elderly people (≥ 85 years; 29.8%). In our study, the rate of participation was 37%.
The study of food consumption among Villanueva elders showed milk and dairy products and fruits and vegetables to be the food groups consumed in the greatest amounts. These results are similar to those obtained in the people aged 65 and over of the survey carried out in Madrid region (ENUCAM) (20) and in the Spanish participants (aged 75-80 years) in the Euronut-SENECA study (11). The largest difference between the Villanueva study and ENUCAM survey (≥ 65 years group) (20) is detected in fruits (Villanueva: 306 ± 217 g/day vs. ENUCAM: 591 ± 438 g/day) and vegetables (Villanueva: 238 ± 181 g/day vs. ENUCAM: 498 ± 221 g/day) consumption. The largest difference between the Villanueva and Seneca studies (75-80 year age group) (11) is also observed in fruit consumption (Villanueva: 306 ± 217 g/day vs. Seneca: 497 ± 393 g/day); this could be due to the age group difference. Age, body mass index and educational attainment have being found to be strongly associated with frequency of fruit and vegetable consumption in an international comparison of two nationally representative surveys that assessed food intake via 24-h diet recalls (22). In our study, women consumed almost the same amounts as men in nearly all food groups. Men had significantly higher consumption of snacks and pickles (p = 0.023) and alcoholic beverages (p < 0.001). Snacks and pickles were not studied in the Seneca study. Significantly higher consumption of alcoholic beverages by men has also been observed in the Seneca study (75-80 years) (11) and in a study of the dietary habits of Italians aged 65 years or over (23). In the Villanueva study, women consumed more meat and meat products and non-alcoholic beverages, whereas men had higher intake of oils and fats, fish and seafood, and fruits and vegetables. As in our study, in the EPIC-Elderly study (15) men from the Spanish cohort showed higher consumption of fish and seafood and of vegetables than women. On the other hand, this study found higher meat and meat product consumption among men (15), whereas in the Villanueva study women consumed more meat and meat products. Disagreement between the Seneca study and our study could be due to age group differences, indicating that consumption changes with age, and diet studies of individuals aged 80 and over are required. It also could be due to differences in existing food patterns between Spanish regions and between rural and urban areas (the Seneca study was carried out in a rural area in the northwest coastal region and the Villanueva study in an urban area in the central region).
According to the dietary guidelines for the Spanish elderly population proposed by Carbajal (13) (Fig. 1), adequate consumption of fruits, milk and dairy products, oils and fats, and sugar and confectionery has been achieved (Table III). When assessing food consumption by servings, it should be taken into account that serving sizes have not been standardized across countries. Intakes of cereals and grain products, vegetables and items from the meat, fish and eggs food group are below desirable levels. In all, 78% (n = 76) of the sample consumed less than 180 g/day (3.6 50-g servings) of cereals and grain products when an intake of 6-8 servings per day is recommended; 87% (n = 85) of Villanueva elders ate less than 450 g/day of vegetables (2.5 175-g servings) when the recommendation is 3-5 servings/day. In a cross-sectional study of a Spanish population aged ≥ 65 years that described food intake based upon the MNA test, almost 1 of 5 elderly Spaniards failed to consume at least two servings a day of vegetables (24). In our sample, 65 Villanueva elders (66%) consumed less than 200 g/day (1.6 125-g servings) of meat, fish and eggs when 2-3 servings/day are recommended.
The diet of the elderly people from the Villanueva study slightly differed from the traditional Mediterranean, which is characterized by high consumption of foods of plant origin (vegetables, fruits, legumes and cereals), high intake of olive oil as the principal source of monounsaturated fat but low intake of saturated fat, moderate intake of fish, low-to-moderate intake of dairy products, low consumption of meat and poultry, and wine consumed in low-to-moderate amounts, normally with meals (25).
When food group consumption is compared by MNA results (Table IV), elders with normal nutritional status ate significantly more fruit (p = 0.039). This significant difference in fruit consumption could be related to the degree of functional impairment, cognitive impairment and difficulties in chewing and swallowing that are also related to the risk of malnutrition. Deterioration of the nutritional status coincided with a reduction in the consumption of all the food groups except for those including ready meals and milk and dairy products, the consumption of which increased. Neither alcoholic beverages nor snacks and pickles were consumed by elders found to be malnourished upon assessment. In this study that analyses specific aspects of food intake based upon the MNA test, those at risk of malnutrition showed lower consumption of all protein-rich foods (dairy products, legumes, eggs, meat, fish and poultry) (p < 0.001), but it must be taken into account that this study was based upon MNA test questions (24). In an Italian study that evaluated the change in eating habits occurring in 217 community-dwelling and 213 institutionalized elderly subjects, aged 65 years and older, with senile anorexia, MNA scores were significantly better in those who had a regular intake of fruit and vegetables and meat, fish and eggs food groups (26).
In the Villanueva study, the proportion of participants who were at risk for malnutrition (29.6%) or were malnourished (7.1%)
-measured by means of MNA- was higher than the data shown in Guidoz's review (27) (24% [range 8-76%] at risk and 2% [range 0-8%] malnourished) and lower than the data shown in a systematic review of the prevalence of malnutrition in Spanish elderly people (28) (38% [range 23.9-57.5%] at risk and 9% [range 0-23.1%] malnourished). Significant differences were seen in nutritional status scoring (7) and in the percentage of elders with normal nutritional status or risk of malnutrition, but not in the incidence of malnourishment when men and women were compared. Some studies reported significant sex differences (29) for MNA results, while others did not (30). One of the reasons why more women are at risk of malnutrition could be that a higher proportion of women live alone and other reason could be age because there are more women aged ≥ 90 years.
An association was found between the nutritional status measured by MNA score and the consumption of some food groups (Table IV). Lower risk of malnutrition was reported when the consumption of oils and fats (mostly olive oil), fruits and alcoholic beverages (mainly wine; 79.7 ± 122.8 g/day) was higher. In the Italian study of elderly subjects with senile anorexia, an association between the nutritional status and the frequency of consumption of certain food groups was also observed: nutritional parameters were significantly better in subjects who ate sufficient amounts of fruit and vegetables and meat, fish and eggs (26). Although detailed study of food group composition has not been carried out, it is important to highlight that some groups are mainly composed of one foodstuff. The oil and fat food group is principally olive oil, but sunflower oil, butter and margarine are also consumed. Olive oil is consumed by 95.9 % and only 4 women took sunflower oil. Butter (21.4%, n = 21) and margarine (1%, n = 1) are used as bread spreads for breakfast. Wine is the main alcoholic beverage and it is usually combined with soda water during meals. Thirty-five elders (35.7%) drank wine, two of those also drank beer, and a woman drank both beer and whisky. Regular, moderate consumption of wine, mainly with food, increases longevity and reduces the risk of cardiovascular disease (31). Finally, after further adjustment for energy intake it is observed that as the nutritional status worsened, measured by MNA, Villanueva elders consumed more milk and dairy products. This result disagrees with the fact reported in other studies where dairy products consumption improved nutrient intake and prevented malnutrition (32,33). In that sense, it should be taken into account that milk and dairy products are very easy to consume and that could be the reason for people with less functional capabilities to tend to consume more.
Some limitations of the study should be accounted. The small sample size (only 98 of 264 inhabitants) and the small number of men, a common situation when studying very old populations, should be considered a limitation of the study. No inhabitants were excluded but some did not want to participate in the study. Another matter to be taken into account is the fact that the sample consists solely of non-institutionalized elderly people. Cross-sectional community-based studies are subject to under-representation of elderly individuals placed in long-term care institutions. Additional issues are selective mortality and the possibility that people with certain dietary patterns may survive longer. In that case, we cannot be sure that those who have reached older ages, the survivors, demonstrate a pattern that represents changes with aging (34). Finally, the cross-sectional design raises questions of temporality when diet-MNA associations are presented. The limitations resulting from the use of 24h recall as the method chosen for the dietary assessment should not be overlooked either (35), but for this study, in which very old people underwent many tests in the same appointment, this was considered to be the most suitable method due to its simplicity and its relatively little burden on the respondents.
In conclusion, the food patterns observed in the Villanueva elderly people are in harmony with the actual dietary trends in Southern European countries that are breaking away from the traditional Mediterranean diet. Further research on the influence of fruit, milk and dairy products, wine and olive oil intake on nutritional status is required.
Acknowledgements
The authors thank José Manuel Ávila on behalf of Villanueva de la Cañada City Council and the two geriatricians (Johanna Gavidia and Laureany Guzmán).
References
1. European Commission (DG ECFIN) and the Economic Policy Committee (AWG). The 2012 Ageing Report: Economic and budgetary projections for the 27 EU Member States (2010-2060), 2012. European Economy 2/12 DOI: 10.2765/19991. [ Links ]
2. Anderson AL, Harris TB, Tylavsky FA, Perry SE, Houston DK, Strotmeyer ES, et al. Health ABC Study. Dietary patterns and survival of older adults. J Am Diet Assoc 2011;111(1):84-91. [ Links ]
3. Roman B, Carta L, Angel M, Martinez G, Serra-Majem L. Effectiveness of the Mediterranean diet in the elderly. Clin Interv Aging 2008;3(1):97-109. [ Links ]
4. Hernández Galiot A, Goñi Cambrodon I. Quality of the diet of the Spanish population over 80 years non-institutionalized. Nutr hosp 2015;31(6):2571-7. [ Links ]
5. Lasheras C, Fernandez S, Patterson AM. Mediterranean diet and age with respect to overall survival in institutionalized, non-smoking elderly people. Am J Clin Nutr 2000;71:987-92. [ Links ]
6. World Health Organization. Active Ageing: A Policy Framework. Geneva, Switzerland: World Health Organization; 2012. [ Links ]
7. Jiménez-Redondo S, Beltrán-de Miguel B, Gavidia-Banegas J, Guzmán-Mercedes L, Gómez-Pavón J, Cuadrado-Vives C. Influence of nutritional status on health-related quality of life of non-institutionalized older people. J Nutr Health Aging 2014;18(4):359-64. [ Links ]
8. Jiménez-Redondo S, Beltrán-de Miguel B, Gómez-Pavón J, Cuadrado-Vives C. Non-institutionalized nonagenarians' health-related quality of life and nutritional status: is there a link between them? Nutr Hosp 2014; 30(3):602-8. [ Links ]
9. Moreiras O, Carbajal A, Cabrera L, Cuadrado C. Tablas de composición de los alimentos, 13th ed. Ediciones Pirámide; 2009. [ Links ]
10. Carbajal A, Varela-Moreiras G, Ruiz-Oso B, Perea I, Moreiras O. Nutrition and health of the elderly in Europe: Euronut-SENECA. Study in Spain. Rev Esp Geriatr Gerontol 1993;28(4):197-242. [ Links ]
11. Del Pozo S, Cuadrado C, Moreiras O. Age-related changes in the dietary intake of elderly individuals. The Euronut-SENECA study. Nutr Hosp 2003;18:348-52. [ Links ]
12. Russell R M, Rasmussen H, Lichtenstein AH. Modified food guide pyramid for people over seventy years of age. J Nutr 1999;129:751-3. [ Links ]
13. Carbajal A. Manual de Nutrición y Dietética. Universidad Complutense de Madrid; 2013. [ Links ]
14. Morley JE. Assessment of malnutrition in older persons: a focus on the Mini Nutritional Assessment. J Nutr Health Aging 2011;15(2):87-90. [ Links ]
15. Bamia C, Orfanos P, Ferrari P, Overvad K, Hundborg HH, Tjønneland A, et al. Dietary patterns among older Europeans: the EPiC-Elderly study. Br J Nutr 2005;94:100-13. [ Links ]
16. Aranceta J, Perez-Rodrigo C, Eguileor I, Manzana I, González de Galdemo L, Saenz de Bururaga J. Food consumption patterns in the adult population of the Basque Country (EINUT-I). Public Health Nutr 1998;1(3):185-92. [ Links ]
17. Tur JA, Romaguera D, Pons A. Does the diet of the Balearic population, a Mediterranean-type diet, ensure compliance with nutritional objectives for the Spanish population? Public Health Nutr 2005;8(3):275-83. [ Links ]
18. Serra-Majem L, Ribas-Barba L, Salvador-Castell G, Roman-Viñas B, Castell-Abat C, Cabezas-Peña C, et al. Trends in the nutritional status of the Spanish population: Results from the Catalan nutrition monitoring system (1992-2003). Rev Esp Salud Pública 2007; 81:559-70. [ Links ]
19. Quiles J (Coord.), Jiménez R, Marín S, Rizk J, Zubeldía L. Valencia Region Nutrition Survey. Encuesta de nutrición de la Comunitat Valenciana 2010-2011: Informe reducido. Valencia: Generalitat. Conselleria de Sanitat; 2013. [ Links ]
20. Ruiz-Moreno E, del Pozo-de la Calle S, Cuadrado-Vives C, Valero-Gaspar T, Ávila-Torres JM, Belmonte-Cortés S, et al. Madrid Region Nutrition Survey. Encuesta de Nutrición de la Comunidad de Madrid (ENUCAM). Documentos Técnicos de Salud, no. D137. Fundación Española de la Nutrición y Consejería de Sanidad de la Comunidad de Madrid; 2014. [ Links ]
21. Volkert D, Kreuel K, Heseker H, Stehle P. Energy and nutrient intake of young-old, old-old and very-old elderly in Germany. Eur J Clin Nutr 2004;58:1190-200. [ Links ]
22. Tamers SL, Agurs-Collins T, Dodd KW, Nebeling L. US and France adult fruit and vegetable consumption patterns: an international comparison. Eur J Clin Nutr 2009;63(1):11-7. [ Links ]
23. Guili C, Papa R, Mocchegiani E, Marcellini F. Dietary habits and ageing in a sample of Italian older people. J Nutr Health Aging 2012;16(10):875-9. [ Links ]
24. Cuervo M, Ansorena D, García A, Astiasarán I, Martínez JA. Food Consumption Analysis in Spanish Elderly Based upon the Mini Nutritional Assessment Test. Ann Nutr Metab 2008;52:299-307. [ Links ]
25. Willett WC, Sacks F, Trichopoulou A, Drescher G, Ferro-Luzzi A, Helsing E, et al. Mediterranean diet pyramid: a cultural model for healthy eating. Am J Clin Nutr 1995;61(6 Suppl):1402S-6S. [ Links ]
26. Donini LM, Poggiogalle E, Piredda M, Pinto A, Barbagallo M, Cucinotta D, et al. Anorexia and eating patterns in the elderly. PloS one 2013;8(5):e63539. [ Links ]
27. Guigoz Y. The Mini Nutritional Assessment (MNA) review of the literature--What does it tell us? J Nutr Health Aging 2006;10(6):466-85. [ Links ]
28. Milà-Villarroel R, Formiga F, Duran-Alert P, Abellana-Sangrà R. Prevalence in malnutrition in Spanish elders: systematic review. Med Clín 2012;139(11) 502-8. [ Links ]
29. Kvamme JM, Grønli O, Florholmen J, Jacobsen BK. Risk of malnutrition and health-related quality of life in community-living elderly men and women: The Tromsø study. Qual Life Res 2011;20:575-82. [ Links ]
30. Johansson L, Sidenvall B, Malmberg L, Christesson L. Who will become malnourished? A prospective study of factors associated with malnutrition in older persons living at home. J Nutr Health Aging 2009;13(10):855-61. [ Links ]
31. Knoops KT, de Groot LC, Kromhout D, Perrin AE, Moreiras-Varela O, Menotti A, et al. Mediterranean diet, lifestyle factors, and 10-year mortality in elderly European men and women: the HALE project. JAMA 2004;22;292(12):1433-39. [ Links ]
32. Iuliano S, Woods J, Robbins J. Consuming two additional serves of dairy food a day significantly improves energy and nutrient intakes in ambulatory aged care residents: a feasibility study. J Nutr Health Aging 2013;17(6):509-51. [ Links ]
33. Van Staveren WA, de Groot LC. Evidence-based dietary guidance and the role of dairy products for appropriate nutrition in the elderly. Am Coll Nutr 2008;30(5 Suppl 1):429S-37S. [ Links ]
34. Wakimoto P, Block G. Dietary intake, dietary patterns, and changes with age: An epidemiological perspective. J Gerontol A Biol Sci Med Sci 2001;56A(Special Issue II):65-80. [ Links ]
35. Salvador-Castell G, Serra-Majem L, Ribas-Barba L. What and how much do we eat? 24-hour dietary recall method. Nutr Hosp 2015;31(3):46-8. [ Links ]
![]() Correspondence:
Correspondence:
Susana Jiménez Redondo.
Departamento de Nutrición y Bromatología I (Nutrición).
Facultad de Farmacia.
Ciudad Universitaria.
28040 Madrid, Spain
e-mail: s_jimenezredondo@yahoo.com
Received: 15/12/2015
Accepted: 03/02/2016
