


Mi SciELO
 Servicios personalizados
Servicios Personalizados
Revista
Articulo
 Inglés (pdf)
 Articulo en XML
 Referencias del artículo
 Enviar articulo por email
Indicadores
-
 Citado por SciELO
 -
 Accesos
Links relacionados
-
 Citado por Google
 -
 Similares en
SciELO
Similares en
SciELO -
 Similares en Google
Compartir

 Permalink
Nutrición Hospitalaria
versión On-line ISSN 1699-5198versión impresa ISSN 0212-1611
Nutr. Hosp. vol.33 no.3 Madrid may./jun. 2016
https://dx.doi.org/10.20960/nh.268
TRABAJO ORIGINAL / Obesidad y síndrome metabólico
Threshold values of sagittal abdominal diameter for the detection of cardio-metabolic risk factors in Northeastern Mexico: a cross-sectional study
Valores de corte del diámetro sagital del abdomen para la detección de factores de riesgo cardiovascular en el noreste mexicano: estudio transversal
Francisco Javier Guzmán de la Garza1,4, Ana María Salinas-Martínez1,5, Eduardo González-Guajardo3, Magda Gabriela Palmero-Hinojosa1, Jorge Castro-Garza2, Juan Carlos Ramírez-Zúñiga3, Javier Vargas-Villarreal2, Álvaro Mathiew-Quiros1 and Laura Hermila de la Garza-Salinas3
1 Unidad de Investigación Epidemiológica y en Servicios de Salud. Instituto Mexicano del Seguro Social. Monterrey, N.L. Mexico.
2 Centro de Investigación Biomédica del Noreste. Instituto Mexicano del Seguro Social. Monterrey, N.L. Mexico.
3 Delegación Regional de Nuevo León. Instituto Mexicano del Seguro Social. Monterrey, N.L. Mexico.
4 Facultad de Medicina. Universidad Autónoma de Nuevo León. Monterrey, N.L. Mexico.
5 Facultad de Salud Pública y Nutrición. Universidad Autónoma de Nuevo León. Monterrey, N.L. Mexico
ABSTRACT
Background: The use of sagittal abdominal diameter (SAD) has been proposed for screening cardio-metabolic risk factors; however, its accuracy can be influenced by the choice of thresholds values.
Aim: To determine the SAD threshold values for cardio-metabolic risk factors in Mexican adults; to assess whether parallel and serial SAD testing can improve waist circumference (WC) sensitivity and specificity; and to analyze the effect of considering SAD along with WC and body mass index (BMI) in detecting cardio-metabolic risk.
Methods: This cross-sectional study was conducted during 2012-2014 in Northeast Mexico (n = 269). Data on anthropometric, clinical, and biochemical measurements were collected. Sex-adjusted receiver-operating characteristic curves (ROC) were obtained using hypertension, dysglycemia, dyslipidemia and insulin resistance as individual outcomes and metabolic syndrome as a composite outcome. Age-adjusted odds ratios and 95% confidence intervals (CI) were estimated using logistic regression.
Results: The threshold value for SAD with acceptable combination of sensitivity and specificity was 24.6 cm in men and 22.5 cm in women. Parallel SAD testing improved WC sensitivity and serial testing improved WC specificity. The co-occurrence of high WC/high SAD increased the risk for insulin resistance by 2.4-fold (95% CI: 1.1-5.3), high BMI/high SAD by 4.3-fold (95% CI: 1.7-11.9) and SAD alone by 2.2-fold (95% CI: 1.2.-4.2).
Conclusions: The use of SAD together with traditional obesity indices such as WC and BMI has advantages over using either of these indices alone. SAD may be a powerful screening tool for interventions for high-risk individuals.
Key words: Sagittal abdominal diameter. Threshold limit values. Risk factor. Cardiovascular disease. Metabolic syndrome.
RESUMEN
Introducción: el diámetro sagital del abdomen (SAD) se ha usado para detectar factores de riesgo cardiometabólicos; su precisión se ve afectada por los valores de corte.
Objetivo: determinar valores de corte para factores de riesgo cardiometabólicos en mexicanos adultos; evaluar la sensibilidad y especificidad cuando se utiliza en serie o en paralelo con la circunferencia de la cintura (WC); y analizar el uso del SAD individualmente o junto a WC o el índice de masa corporal (IMC) para detectar factores de riesgo cardiometabólicos.
Métodos: en forma transversal, de 2012 a 2014 se estudiaron 209 sujetos provenientes del noreste mexicano. Se recopilaron datos antropométricos, clínicos y bioquímicos. Se construyeron curvas ROC ajustadas por sexo utilizando como resultado individual hipertensión, disglicemia y resistencia a la insulina y como resultado compuesto, el síndrome metabólico. Se calcularon razón de momios e intervalos de confianza (IC 95%) mediante regresión logística.
Resultados: los valores de corte fueron 24,6 cm en hombres y 22,5 cm en mujeres. El SAD en paralelo con la WC mejoró sensibilidad y en forma seriada, la especificidad de WC. La coocurrencia de WC y SAD por encima de los rangos incrementó el riesgo para resistencia a la insulina 2,4 veces (95% CI: 1,1-5,3); BMI y SAD elevados, 4,3 veces (95% CI: 1,7-11,9) y SAD individualmente, 2,2 veces (95% CI: 1,2-4,2).
Conclusiones: utilizar el SAD junto a índices tradicionales de obesidad (WC y BMI) tiene ventajas sobre su uso individual. El SAD puede ser una poderosa herramienta de tamizaje para intervenciones en individuos de alto riesgo.
Palabras clave: Diámetro sagital del abdomen. Valores de corte. Factor de riesgo. Enfermedad cardiovascular. Síndrome metabólico.
Introduction
Metabolic syndrome is a cluster of cardio-metabolic risk factors such as insulin resistance, hypertension, and lipid abnormalities most often occurring in overweight and obese subjects. Metabolic syndrome can favor the development of cardiovascular diseases and diabetes. Additionally, cardiovascular diseases and diabetes are the leading causes of death worldwide (1,2). The amount of visceral adipose tissue is a clinically relevant body fat marker related to insulin resistance, diabetes, hyperlipidemia, and atherosclerosis. The gold standard for measurement of visceral adipose tissue is computed tomography, dual-energy x-ray absorptiometry, or magnetic resonance imaging. However, these tests are expensive and impractical for primary care and preventive medicine; furthermore, they involve radiation exposure and hence are a health hazard (3,4). Therefore, other useful indicators of excess visceral adipose tissue deposits, such as waist circumference (WC) and sagittal abdominal diameter (SAD), have been considered (5-7).
WC is used for detecting abdominal obesity and predicting cardiovascular risk (8-10). SAD, meanwhile, has been suggested as a screening tool for insulin resistance, dysglycemia, diabetes, and hypertension in American, Asian, and European populations; and relevant literature utilizes several SAD cut-off values either in supine (11-14) or standing position (15). Nonetheless, the accuracy of classification using SAD can be influenced by the choice of thresholds values, which might differ according to ethnic group, age, and sex. It is important to identify individuals at particularly high risk for metabolic syndrome in order to prevent cardiovascular disease, and because SAD thresholds values have not been established in the Mexican population, our study aimed to determine: a) the SAD threshold values for detecting cardio-metabolic risk factors (hypertension, dysglycemia, dyslipidemia, insulin resistance, and metabolic syndrome) with the most acceptable accuracy (combination of sensitivity and specificity); b) the extent to which parallel and serial SAD testing could improve WC sensitivity and specificity; and c) finally, we assessed the effect of considering SAD along with WC and body mass index (BMI) for detecting cardio-metabolic risk factors.
Material and Methods
This descriptive, cross-sectional study was conducted from 2012 to 2014 in northeast urban Mexico. Participants were employees between 20 and 60 years of age from the health care sector (107 men and 162 women). They were receiving routine annual worksite health-promotion care, which consisted of screening and monitoring of obesity, diabetes, heart disease, and cancer, among other disorders. The only selection criteria were no pregnancy or lactation. In men, the sample size was sufficient for establishing 71% sensitivity (averaged value of the five cardio-metabolic risk factors under study: hypertension, dysglycemia, insulin resistance, dyslipidemia, metabolic syndrome) with 95% confidence and 15% degree of precision; given averaged prevalence of 35%. In women, the sample size was sufficient for establishing 65% sensitivity (averaged value of the five cardio-metabolic risk factors under study) with 95% confidence and 13% degree of precision; given averaged prevalence of 30% (16). Approval was obtained from the Research Ethics Committee. Written informed consent was obtained from each participant.
A self-administered questionnaire was used to collect information on family and personal history of hypertension (yes or no), diabetes (yes or no), and dyslipidemia (yes or no); smoking status (never, quit smoking, or current smoker); alcohol consumption (never, sometimes, or usually); history of routine programmed exercise activity for a minimum of 20 min, 3 times a week (never, sometimes, or usually); and age, marital status, education, and job category. The methods for anthropometric, clinical, and biochemical measurements are described below.
ANTHROPOMETRIC MEASUREMENTS
Individuals were weighed to the nearest 0.1 kg, and their height was measured to the nearest 0.5 cm using an electronic scale with a stadiometer while wearing no shoes and light clothing. SAD was measured to the nearest 0.1 cm using a modified anthropometer: the curved arm was replaced by an even arm in order to comfortably position it under the subjects' back in supine position (Lafayette Instrument Company, Lafayette, IN, USA) after normal expiration in supine position, with knees bent on a firm examination table and without any clothes surrounding the measurement area. Abdominal height was obtained at the level of the iliac crest (L4-5), allowing the anthropometer arm to touch the abdomen slightly but without compression. WC was measured with the participant wearing only underwear and by using a non-stretchable tape after normal expiration in a standing position, midway between the most caudal part of the lateral costal arch and the iliac crest. Elevated WC was defined as a WC > 102 cm for men and > 88 cm for women (17). BMI was calculated as body weight (kg)/height squared (m2), and then categorized according to the following World Health Organization categories: underweight (< 18.5 m/kg2), normal weight (18.5-24.9 m/kg2), overweight (25.0-29.9 m/kg2), and obese (≥ 30.0 m/kg2). Proper adjustment was made for individuals of short stature (women < 1.50 m, men < 1.60 m): overweight, 23.0-24.9 m/kg2 and obese, ≥ 25.0 m/kg2 (18,19). Two research interns collected the data; they were standardized and subject to periodic supervision for verifying adherence to stipulated procedures. Every anthropometric and clinical measurement was obtained in triplicates, and the mean value was used in further analyses.
CLINICAL AND BIOCHEMICAL MEASUREMENTS
Blood pressure was measured after a 5-min rest in a sitting position using indirect auscultation with a calibrated sphygmomanometer (Tycos Classic Hand Aneroids, Welch Allyn Inc, Skaneateles Falls, NY, USA); systolic and diastolic blood pressures were defined as Korotkoff phases 1 and 5, respectively. Hypertension was self-reported or defined as measured systolic blood pressure of > 140 mmHg and/or diastolic blood pressure of > 90 mmHg. Blood samples were obtained to measure fasting plasma glucose, serum lipids (high-density lipoprotein [HDL]-cholesterol and triglycerides), and serum insulin levels. Blood was drawn under standardized conditions after fasting for 10-14 hours, and samples were collected using a vacuum system (Vacutainer©, BD, Franklin Lakes, NJ, USA). Laboratory analysis was done on the day of sampling, except for insulin; samples were maintained at -20oC until quantitative determination of insulin was performed using an enzyme-linked immunosorbent assay (insulin ELISA, ALPCO Immunoassays; Salem, NH, USA). Dysglycemia was defined as the self-reported presence of diabetes or measured fasting plasma glucose level > 100 mg/dL, and dyslipidemia was defined as self-reported or measured triglyceride levels > 150 mg/dL or HDL-cholesterol level < 40 mg/dL in men and < 50 mg/dL in women. Insulin resistance, as per the Homeostasis Model Assessment index, having a cut-off point of 2.5, was calculated with the following formula: fasting insulinemia (μU/mL) × fasting glycemia (mg/dL)/405 (20). The presence of metabolic syndrome was confirmed if ≥ 3 of the following criteria were met: WC > 102 cm in men and > 88 cm in women; triglyceride level > 150 mg/dL; HDL-cholesterol level < 40 mg/dL in men and < 50 mg/dL in women; systolic blood pressure > 130 mmHg and/or diastolic blood pressure > 85 mmHg or self-reported hypertension; and fasting plasma glucose level > 100 mg/dL or self-reported diabetes (2). Blood samples were processed using automated clinical chemistry equipment following the guidelines of the clinical laboratory quality standards.
STATISTICAL ANALYSIS
Categorical variables were compared using the Chi-squared test, and continuous variables were compared using Student's t-test. Determination of SAD threshold values was based on sex-adjusted receiver operating characteristic (ROC) curves and area under the curve (AUC) using hypertension, dysglycemia, dyslipidemia and insulin resistance as individual outcomes and metabolic syndrome as a composite outcome. Rationale for choosing these outcomes lied in their well documented association with visceral adiposity (7,21) and also because of their importance for preventing cardiovascular disease (22). Screening tests can be offered at the same time (parallel testing) or sequentially (serial testing); therefore, the accuracy of WC and SAD were tested using both approaches. Parallel testing consisted of WC and SAD performed simultaneously and disease individuals were defined as those who tested positive by either one test or by both tests. Sequential testing was a two-stage screening that required a SAD test only when the result of the WC test was positive; disease individuals were defined as those who tested positive by both tests (23). Serial and parallel performance characteristics were examined using EPIDAT© (24). The effect of combining a high WC or high BMI with a high SAD on detection of cardio-metabolic risk factors was assessed using odds ratios (OR) and 95% confidence intervals (CI). For this, unconditional binary logistic regression was conducted using the anthropometric measure as the independent variable, age and BMI as control variables, and the cardio-metabolic risk factor as the dependent variable. Only one anthropometric measure was entered at a time because of the strong and significant correlation between SAD and WC (r = 0.57, p < 0.0001), SAD and BMI (r = 0.79; p < 0.0001), and WC and BMI (r = 0.63, p < 0.0001).
Results
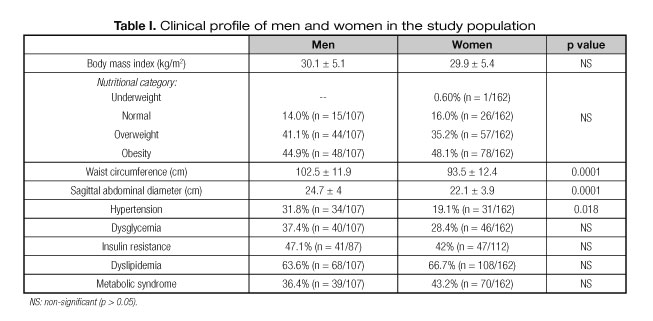
The mean age of the subjects was 42.9 ± 9.6 years. Of all subjects, 60.2% were women and 63.9% were married. With respect to the educational level, 13.1% completed middle school, 50.9% were undergraduates and 36% were graduates. According to job category, 36.1% were professionals or managers. In terms of associated conditions, 10% self-reported diabetes, 12.3% had hypertension, and 9.3% had dyslipidemia. Further, 17.8% usually consumed alcohol, 20.1% smoked tobacco, and 59% did not exercise regularly. Fifty-eight percent of the subjects had at least one family member with hypertension; 51.7%, with diabetes; and 24.8%, with high cholesterol level. Male and female subjects were of similar age (42.4 ± 10.2 vs. 43.2 ± 9.2 years, p > 0.05), and had comparable nutritional status and prevalence of dysglycemia, insulin resistance, dyslipidemia, and metabolic syndrome (p > 0.05). Nonetheless, the WC, SAD, and hypertension frequency differed between men and women (p < 0.05) (Table I).
SAD THRESHOLD VALUES FOR CARDIOMETABOLIC RISK FACTORS
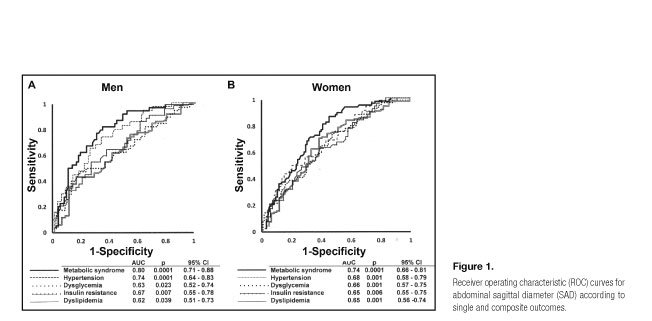
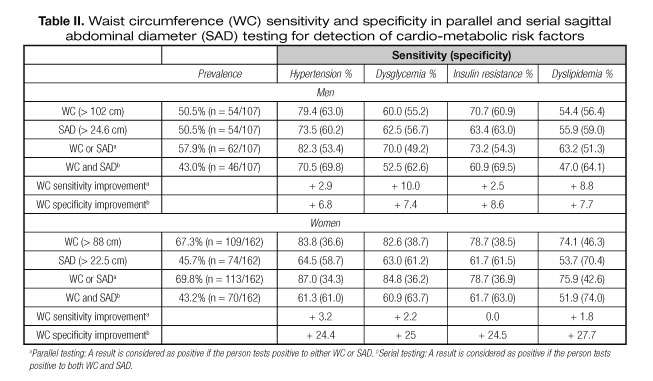
In men, a SAD threshold value of 24.6 cm resulted with the best combination of sensitivity and specificity for metabolic syndrome (79% and 66%, respectively) (Fig. 1A), and resulted with acceptable combination of sensitivity and specificity for individual outcomes (Table II). In women, the SAD threshold value of 22.5 cm also offered the best combination of sensitivity and specificity for metabolic syndrome (67% and 70%, respectively) (Fig. 1B), and acceptable combination for individual outcomes (Table II).
WC SENSITIVITY AND SPECIFICITY WITH PARALLEL AND SERIAL SAD TESTING
Sixty-five percent of the population had SAD or WC values greater than the identified cut-off values, while 43.1% had both values greater than the identified values. Broadly speaking, a high WC in parallel with a high SAD improved WC sensitivity: the highest improvement was seen for dysglycemia in men (+10.0%); as expected, every specificity value decreased. Importantly, serial testing improved WC specificity (Table II).
SAD ALONG WITH WC OR BMI FOR DETECTION OF CARDIO-METABOLIC RISK FACTORS
Individuals with SAD values greater than the cut-off value were older than those with SAD values within the cut-off value (44.6 ± 8.9 vs. 41.4 ± 9.9 years, p < 0.0001). They were also more likely to have lower education levels (18.3% vs. 8.6%, p = 0.03) and not exercise regularly (48.6% vs. 32.8%, p < 0.01). SAD alone increased the probability of detecting any cardio-metabolic risk factor. The co-occurrence of high WC and high SAD slightly increased the risk for detecting cardio-metabolic risk factors, while the combination of high BMI and high SAD increased the risk for hypertension by 4.0-fold (95% CI: 1.3, 12.3) and that for insulin resistance by 4.3-fold (95% CI 1.7, 11.9) (Table III).

Discussion
To our knowledge, this is the first report on SAD threshold values for detection of cardio-metabolic risk factors in the Mexican population in northeast urban Mexico. We found that 24.6 cm for men and 22.5 cm for women were suitable threshold values for detecting hypertension, dysglycemia, dyslipidemia, insulin resistance, or metabolic syndrome, with acceptable combination of sensitivity and specificity. The issue of maintaining the same cut-off for all endpoints without giving up validity was a matter of great concern because of its practicability and potential extended benefits. While the main reason for analyzing detection of separate components of the metabolic syndrome was the opportunity of early stage treatment before installation of the complete syndrome (22,25).
SAD cut-off values differ among countries. In Brasil, Vasques et al. (14) found that 21.0 cm was the optimal cut-off for screening insulin resistance in women, with 70% sensitivity and 70.4% specificity. In Sweden, Riserus et al. (13) found that 22.2 cm in men and 20.1 cm in women were ideal threshold values for cardio-metabolic risk (no data on sensitivity and specificity are available). In Finland, Pajunen et al. (11) identified 23.5 cm in men and women as the upper quartile limit for predicting diabetes. In the USA, Kahn et al. (12) showed that 25.3 cm in men and 24.4 cm in women were the upper quartile limits for detecting dysglycemia, whereas Iribarren et al. (15) showed that 26.9 cm in men and 25.7 cm in women predicted coronary heart disease, even though they measured SAD in a standing position. The cut-off values clearly differ across studies, highlighting the importance of validating best possible thresholds values before generalizing their utilization. For example, if we applied the American 26.9 cm cut-off value for dysglycemia, the sensitivity would decrease from 62.5% to 42.5% in men, and if we applied the Swedish 22.2 cm cut-off value for dysglycemia again, the sensitivity would increase to 82.5%. These variations can be explained by the method used to calculate the cut-off values, i.e., ROC curves or upper quartiles, as well as the age of population. Thus, it is important to conduct multi-centric studies to determine a useful universal threshold value or apply appropriate correction before using SAD measurements for specific populations, as is done for WC (26).
WC and BMI are very practical and widely used measurements. Thus, we determined the effect of considering SAD along with WC or BMI for the detection of cardio-metabolic risk factors. We found that a high SAD alone increased the risk of hypertension, dysglycemia, and insulin resistance by more that 2-fold and the risk of metabolic syndrome by almost 4-fold. The co-occurrence of high SAD and high BMI increased the risk of dysglycemia by 3-fold. This finding is in line with a study in Finland, which showed that SAD was associated with diabetes after a mean follow-up of 8.1 years. Comparisons between the highest and the lowest quartiles yielded a relative risk of 14.7 for SAD alone (95% CI: 6.9-31.2) and the co-occurrence of high SAD and high BMI yielded a relative risk of 37.0 (95% CI: 11.2-122) (11). Another longitudinal study with a median follow-up period of 12 years showed that a high SAD together with a high BMI indicated the risk of coronary heart disease better than that with the use of high BMI alone (15). In addition, several studies have assessed whether SAD adds value to WC. Mukuddem-Petersen et al. (27) reported that SAD had no advantages over WC in detecting components of the metabolic syndrome, while Pajunen et al. (11) showed that for predicting diabetes incidence, a high SAD and high WC together yielded a relative risk of 18.9 (95% CI: 7.2-49.2) as compared to low SAD and normal WC alone. We found the co-occurrence of high SAD and high WC increased the risk of dysglycemia by 2-fold. Finally, we determined to what extent a given WC sensitivity could be improved if SAD is applied in parallel, and we found a slight further improvement in this effect. Conversely, WC showed large improvements in specificity with SAD serial testing. Arguments in favor of selecting a high sensitivity test are that it can detect a lethal and treatable disease or a disease that spreads easily; arguments in favor of a high specificity test are its low cost or invasiveness. Considering these issues, we believe that SAD is useful for detecting cardio-metabolic risk factors in parallel with WC in a clinical setting. However, a high specificity test for population screening is necessary, for which we recommend serial testing instead of parallel testing.
Despite our important findings, our study has a few limitations that need to be considered. First, our study population was predominantly middle aged. Thus, the standard anthropometric data did not accurately account for changes in body composition and fat distribution in the elderly, as aging is associated with an increase in fat mass and decrease in height, lean tissue, and muscle mass (28,29). As such, Kahn et al. (30) reported a tendency to larger SAD with increasing age. Therefore, this should be considered when generalizing threshold values and cardio-metabolic increased risk from young to older adults. We recognize a population-based study would have been the ideal study design but this was not feasible. Nevertheless, we believe our study population typifies the Mexican population in terms of self-reported co-morbidity. The 2012 National Survey (31) showed 16.6% prevalence of self-reported hypertension (in our study it was 12.3%), 9.2% prevalence of self-reported diabetes (in our study, 10%); and 13.0% prevalence of self-reported abnormal cholesterol (in our study, 9.3%). However, results for SAD threshold values should be cautiously interpreted because of the high prevalence of overweight and obesity. The National survey already mentioned revealed 73% of Mexican adult men and 69% of Mexican adult women were overweight or obese (in our study they were 86% and 83.3%, respectively). USA has a similar situation: the National Health and Nutrition Examination Survey 2011-2012 showed that the prevalence of overweight and obesity was 71.3% in North American adult men, 65.8% in North American adult women, 78.6% in Hispanic adult men, and 77.2% in Hispanic adult women (32). Therefore, future studies should address the validity of the identified cut-off values in populations with a lower occurrence of obesity. For the time being, we consider identified cut-off values are useful for selective screening of overweight and obese populations. Apart from the limitations, our study also had several strengths: the anthropometric measurements were performed by trained personnel who used a systematic protocol, and outcome definitions did not rely on only self-report but also on laboratory tests, which were performed when the subjects agreed to participate in the study.
Conclusions
In summary, we identified SAD threshold values with acceptable sensitivity and specificity for detection of cardio-metabolic risk factors in Mexican adults in northeast urban Mexico. SAD was strongly associated with cardio-metabolic risk factors. We found that using SAD together with traditional obesity indices such as WC and BMI has advantages over using these indices alone. Future longitudinal studies should be conducted to confirm our findings. Thus, SAD may be used as a potential indicator for cardiovascular disease and could be a powerful screening tool in interventions for high-risk individuals at individual and population levels.
Acknowledgments
We gratefully acknowledge the unconditional collaboration of Dr. Juan Antonio Elizondo Nolasco and Dr. Eva María Espinosa Flores, whose support was essential to the development of this study.
References
1. World Health Organization. Global status reports on non-communicable diseases 2014. Geneve: World Health Organization; 2014. Cited: 2015 March. Available on: http://www.who.int/nmh/publications/ncd-status-report-2014/en/. [ Links ]
2. Kaur J. A comprehensive review on metabolic syndrome. Cardiol Res Pract 2014;2014:943162. [ Links ]
3. Gallagher D, Shaheen I, Zafar K. State-of-the-art measurements in human body composition: A moving frontier of clinical importance. Int J Body Compos Res 2008;6:141-8. [ Links ]
4. Lee SY, Gallagher D. Assessment methods in human body composition. Curr Opin Clin Nutr Metab Care 2008;11:566-72. [ Links ]
5. Vasques AC, Rosado L, Rosado G, Ribeiro RC, Franceschini S, Geloneze B. Anthropometric indicators of insulin resistance. Arq Bras Cardiol 2010;95:e14-e23. [ Links ]
6. Yim JY, Kim D, Lim SH, Park MJ, Choi SH, Lee CH, et al. Sagittal abdominal diameter is a strong anthropometric measure of visceral adipose tissue in the Asian general population. Diabetes Care 2010;33:2665-70. [ Links ]
7. Hoenig MR. MRI sagittal abdominal diameter is a stronger predictor of metabolic syndrome than visceral fat area or waist circumference in a high-risk vascular cohort. Vasc Health Risk Manag 2010;6:629-33. [ Links ]
8. Cheong KC, Ghazali SM, Hock LK, Yousoff AF, Selvarajah S, Haniff J, et al. Optimal waist circumference cut-off values for predicting cardiovascular risk factors in a multi-ethnic Malaysian population. Obes Res Clin Pract 2014;8:e154-62. [ Links ]
9. Mamtani M, Kulkarni H, Dyer TD, Almasy L, Mahaney MC, Duggirala R, et al. Waist circumference independently associates with the risk of insulin resistance and type 2 diabetes in Mexican American families. PLoS One. 2013;8:e59153. [ Links ]
10. Siren R, Eriksson JG, Vanhanen H. Waist circumference a good indicator of future risk for type 2 diabetes and cardiovascular disease. BMC Public Health 2012;12:631. [ Links ]
11. Pajunen P, Rissanen H, Laaksonen MA, Heliövaara M, Reunanen A, Knekt P. Sagittal abdominal diameter as a new predictor for incident diabetes. Diabetes Care 2013;36:283-8. [ Links ]
12. Kahn HS, Gu Q, Bullard KM, Freedman DS, Ahluwalia N, Ogden CL. Population distribution of the sagittal abdominal diameter (SAD) from a representative sample of US adults: Comparison of SAD, waist circumference and body mass index for identifying dysglycemia. PLoS One 2014;9:e108707. [ Links ]
13. Risérus U, De Faire U, Berglund L, Hellénius ML. Sagittal abdominal diameter as a screening tool in clinical research: Cutoffs for cardiometabolic risk. J Obes 2010;pii: 757939. [ Links ]
14. Vasques AC, Cassani RS, Forti AC, Vilela BS, Pareja JC, Tambascia MA, et al. Sagittal abdominal diameter as a surrogate marker of insulin resistance in an admixtured population-Brazilian Metabolic Syndrome Study (BRAMS). PLoS One 2015;10:e0125365. [ Links ]
15. Iribarren C, Darbinian JA, Lo JC, Fireman BH, Go AS. Value of the sagittal abdominal diameter in coronary heart disease risk assessment: Cohort study in a large, multiethnic population. Am J Epidemiol 2006;164:1150-9. [ Links ]
16. Hajian-Tilaki K. Sample size estimation in diagnostic test studies of biomedical informatics. J Biomed Inform 2014;48:193-204. [ Links ]
17. World Health Organization. Waist circumference and waist-hip ratio: Report of a WHO expert consultation. Geneva: World Health Organization; 2008. Cited: 2015 March 5. Available on: http://whqlibdoc.who.int/publications/2011/9789241501491_eng.pdf. [ Links ]
18. World Health Organization. Obesity: Preventing and managing the global epidemic. Report of a WHO Consultation (WHO Technical Report Series 894) Geneve: World Health Organization; 2004. [ Links ]
19. Mexican Official Standard NOM-008-SSA3-2010. For the treatment of overweight and obesity. Official Journal of the Federation. 4 August 2010. Cited: 2015 March 5. Available on: http://dof.gob.mx/nota_detalle.php?codigo=5154226&fecha=04/08/2010. (In Spanish). [ Links ]
20. Ascaso JF, Pardo S, Real JT, Lorente RI, Priego A, Carmena R. Diagnosing insulin resistance by simple quantitative methods in subjects with normal glucose metabolism. Diabetes Care 2003;26:3320-5. [ Links ]
21. Asayama K, Dobashi K, Hayashibe H, Kodera K, Uchida N, Nakane T. Threshold values of visceral fat measures and their anthropometric alternatives for metabolic derangement in Japanese obese boys. Int J Obes Relat Metab Disord 2002;26:208-13. [ Links ]
22. Huffman MD, Capewell S, Ning H, Shay CM, Ford ES, Lloyd-Jones DM. Cardiovascular health behavior and health factor changes (1988-2008) and projections to 2020: Results from the National Health and Nutrition Examination Surveys. Circulation 2012;29;125:2595-602. [ Links ]
23. Lewis GH, Sheringham J, Kalim K, Crayford T. Mastering Public Health: A postgraduate guide to examinations and revalidation. Boca Raton, FL: CRC Press Taylor & Francis Group; 2008. [ Links ]
24. Xunta de Galicia and Panamerican Health Organization. EpiDat. Version 3.1, 2006. [ Links ]
25. Orchard TJ, Temprosa M, Goldberg R, Haffner S, Ratner R, Marcovina S, et al. Diabetes Prevention Program Research Group. The effect of metformin and intensive lifestyle intervention on the metabolic syndrome: The Diabetes Prevention Program randomized trial. Ann Intern Med 2005;142:611-9. [ Links ]
26. Lear SA, James PT, Ko GT, Kumanyica S. Appropriateness of waist circumference and waist-to-hip ratio cutoffs for different ethnic groups. Eur J Clin Nutr 2010;64:42-61. [ Links ]
27. Mukuddem-Petersen J, Snijder MB, Van Dam RM, Dekker JM, Bouter LM, Stehouwer CD, et al. Sagittal abdominal diameter: No advantage compared with other anthropometric measures as a correlate of components of the metabolic syndrome in elderly from the Hoorn Study. Am J Clin Nutr 2006;84:995-1002. [ Links ]
28. Peter RS, Fromm E, Klenk J, Concin H, Nagel G. Change in height, weight, and body mass index: Longitudinal data from Austria. Am J Hum Biol 2014;26:690-6. [ Links ]
29. St-Onge MP. Relationship between body composition changes and changes in physical function and metabolic risk factors in aging. Curr Opin Clin Nutr Metab Care 2005;8:523-8. [ Links ]
30. Kahn HS, Rissanen H, Bullard KM, Knekt P. The population distribution of the sagittal abdominal diameter (SAD) and SAD/height ratio among Finnish adults. Clin Obes 2014;4:333-4. [ Links ]
31. National Institute of Public Health. National Health and Nutrition Examination Survey 2012. National Results. ENSANUT. Cited: 2015 March 5. Available on: http://ensanut.insp.mx/resultados_principales.php#.VK6TicYWE5g. (In Spanish). [ Links ]
32. Ogden CL, Carroll MD, Kit BK, Flegal KM. Prevalence of childhood and adult obesity in the United States, 2011-2012. JAMA 2014;311:806-14. [ Links ]
![]() Correspondence:
Correspondence:
Francisco J. Guzmán-de la Garza.
Unidad de Investigación Epidemiológica y en Servicios de Salud, IMSS.
Conjunto Lincoln.
C/ María de Jesús Candia y Ave Lincoln, s/n.
Col. Valle Verde.
64360 Monterrey, Nuevo León. México
e-mail: fcojguzman@hotmail.com
Received: 10/11/2015
Accepted: 08/04/2016
