


My SciELO
 Custom services
Services on Demand
Journal
Article
 English (pdf)
 Article in xml format
 Article references
 Send this article by e-mail
Indicators
-
 Cited by SciELO
 -
 Access statistics
Related links
-
 Cited by Google
 -
 Similars in
SciELO
Similars in
SciELO -
 Similars in Google
Share

 Permalink
Nutrición Hospitalaria
On-line version ISSN 1699-5198Print version ISSN 0212-1611
Nutr. Hosp. vol.33 n.5 Madrid Sep./Oct. 2016
https://dx.doi.org/10.20960/nh.575
TRABAJO ORIGINAL / Valoración nutricional
Comparison of body fat calculations by sex and puberty status in obese schoolchildren using two and four compartment body composition models
Comparación de modelos de dos y cuatro compartimentos para grasa corporal en escolares obesos según su sexo y desarrollo puberal
Fabián Vásquez, Gabriela Salazar, Erik Díaz, Lydia Lera, Alyerina Anziani and Raquel Burrows
Institute of Nutrition and Food Technology (INTA). Universidad de Chile
This research was funded by the Domeyko Project, University of Chile. FONDECYT (Postdoctoral Grant no. 3140344).
ABSTRACT
Introduction: Determine body composition changes in adiposity can assess an individual.
Objective: The objective of this study was to evaluate total body fat percentage based on two and four compartment models in obese Chilean school children, adjusting for differences in sex and puberty status.
Methods: Sixty-one obese school children (33 boys and 28 girls) between 8 and 13 years of age were evaluated. Two compartment measurements of body fat percentage considered isotope dilution, plethysmography, radiographic absorptiometry and bioelectrical impedance; using the four compartment model as a benchmark.
Results: Each method explained between 43-87% of the variance in body fat percentage in Tanner stage I and II children and between 78-96% in Tanner stage III and V children. In both groups of children methods differed significantly for stage I, with the exception of plethysmography. High R2 values were observed for girls in all Tanner stages. Each method explained between 34-92% of the variance in body fat percentage for girls in stages I and II and between 63-93% for stages III and V. In obese boys, R2 values were high for stages III and V. In girls and boys in Tanner stage III and V, the smallest differences were observed for isotopic dilution, and DXA (dual-energy X-ray absorptiometry) scan for stages I and II.
Conclusions: For obese boys and girls, the two compartment model with isotopic dilution and DXA had the best precision and smallest differences in determining body fat percentage compared to the benchmark
Key words: Body fat percentage. Four compartment model. Two compartment model. Isotopic dilution. Radiographic absorptiometry. Plethysmography. Bioelectrical impedance.
RESUMEN
Introducción: determinar la composición corporal permite valorar cambios en la adiposidad de un individuo.
Objectivo: el objetivo de este estudio fue evaluar la grasa corporal total basada en modelos de dos compartimentos (2C) y compararlos con el modelo de cuatro compartimentos (4C) en escolares chilenos obesos, considerando potenciales diferencias por sexo y desarrollo puberal.
Métodos: 61 escolares obesos (33 niños y 28 niñas), de entre 8 y 13 años. La medición de la grasa corporal por 2C consideró dilución isotópica, pletismografía, absorciometría radiográfica y bioimpedanciometría; utilizando como patrón de referencia el modelo de 4 compartimentos.
Resultados: cada método dio cuenta de 43-87% de la varianza para determinar el porcentaje de grasa corporal en niños en etapa I y II y 78-96% en etapa III y IV. En ambos grupos de niños, las pendientes difirieron significativamente en la etapa I, con la excepción de la pletismografía. En niñas los valores de R2 altos se observaron en todas las etapas del desarrollo puberal. Cada método dio cuenta de 34-92% de la varianza para determinar el porcentaje de grasa corporal en niñas etapa I y II y 63-93% en etapa III y IV, respectivamente. En niños obesos, los valores de R2 fueron altos, principalmente en el grupo de etapa III y IV. En niños y niñas de Tanner III y IV, las menores diferencias con el patrón de referencia fueron con dilución isotópica; en cuanto a Tanner I y II, las menores diferencias se obtuvieron con DEXA.
Conclusiones: en ambos sexos, el modelo de dos compartimentos con dilución isotópica y DEXA tuvo la mayor precisión y las menores diferencias para determinar la grasa corporal en los niños y adolescentes obesos, en comparación con el patrón de referencia.
Palabras clave: Porcentaje de grasa corporal. Modelo de cuatro compartimentos. Modelo de dos compartimentos. Dilución isotópica. Absorciometría radiográfica. Pletismografía. Bioimpedanciometría.
Introduction
The prevalence of obesity in Chilean school children is 25.3%, with slightly higher levels among boys compared to girls (28.3% vs. 22.3%) (1). Increases in adiposity associated with childhood obesity is a risk factor for glucose intolerance, insulin resistance, dyslipidemia, non-alcoholic fatty liver disease, hypertension, heart attack, stroke and premature death (2-6). Although body mass index (BMI) is widely used as an index of body fat (BF), it is not a direct measurement of adiposity. BMI cannot distinguish between different types of body mass (e.g. fat mass, fat free mass, bone mass), thus the use of BMI can lead to errors in the estimation of BF, especially in the context of obesity. Changes in weight and height associated with normal growth are responsible for a 50% increase in BMI, which further complicates the interpretation of this index for children and adolescents. The increase in BMI during adolescence is primarily a result of an increase in fat free mass (7,8). BMI is a global indicator of nutritional status and does not distinguish between lean and fat mass (9). Thus, measuring fat mass would allow for the quantification of metabolic risk associated with an increase in obesity.
In the classic two compartment model of body composition, body weight is divided into fat mass and fat free mass. This model is used widely for clinical practice and nutritional follow-up. BODPOP uses the relationship between pressure and volume to calculate body volume and density (10) Isotopic dilution quantifies total body water, which can be used to predict fat free mass, as a proportion of water known in fat free mass by age and sex (11) DXA differentiates between fat and fat free mass based on the differential attenuation of x-rayes (12). Bioelectrical impedance, BIA, is an indirect method to measure the total body water and fat free mass (13).
The most precise method, considered the gold standard, for determining body composition is the four compartment model. For this method, fat free mass is divided into water, minerals and proteins (10). Although multi-compartment models of body composition have better precision, few studies have used them to validate simpler methodology in obese children and adolescents (14). The current study aimed to determine the predictive capacity of the two compartment model of BF% (body fat percentage) compared to the four compartment model in a sample of obese Chilean school children, adjusting for possible differences by sex and pubertal stage.
Methods
SUBJECTS
We worked with a sample of 61 obese children years (males = 33 and females = 27) between 8 and 13, from a school in the Macul neighborhood of Santiago, Chile. The school was chosen for convenience, given the proximity of the school to the place of measurements. Inclusion criteria included: BMI ≥ 95th percentile according to CDC-NCHS references (15), full-time attendance at an educational institution, parental consent and child assent. The exclusion criteria included: medical diagnosis of psychomotor disorder, use of drugs that can alter body composition, performing physical activity, and/or biochemical parameters. This research was approved by the Ethics Committee of the University of Chile.
BIOLOGICAL AGE
Pubertal development was classified using Tanner staging, considering breast development in females and genital in males (16). Developmental stages were determined by visual inspection during a physical examination by a pediatrician.
ANTHROPOMETRY
Weight and height were assessed in the morning after an overnight fast. Children wore minimal clothing, standing in front of the scale, with feet together at the center of it, arms attached to the body, the head forming a straight line parallel to the floor to join the corner of the eye and the birth of the ear. An electronic balance (SECA® Model 767) was used with sensitivity of 10 grams for weight and Holtain stadiometer (SECA) with sensitivity 0.1 cm for height, both imported by Precision Hispana. Four skin folds (biceps, triceps, subscapular and suprailiac), with a Lange caliper millimeter (1 mm), were assessed in triplicate using the technique described by Lohman et al. (17).
ISOTOPIC DILUTION
Total body water was determined with deuterium dilution. The isotope (4 grams of deuterium oxide 99.8%) was administered orally according to body weight of the subject. The amount of body water was measured by determining the concentration of deuterium oxide, according to the Plateau method. This required that the subjects were in total fasting for a period of three hours, which corresponds to the period of equilibrium and minimizes changes in total body water content (11). After the fast, a saliva sample (2 mL, baseline) was taken. Subsequently, the deuterium dose and an additional 20 ml of tap water were given to ensure dose ingestion. After three hours, during which participants were not allowed to urinate, eat or drink anything additional, the second saliva sample (post dose) was taken and frozen at -20 oC. For analyzing the concentration of deuterium in saliva, the sample was thawed, equilibrated in hydrogen gas, adding 5% platinum on aluminum with time of three days to reach equilibrium. The deuterium/hydrogen ratio in the gas released was analyzed by mass spectrometry (Hydra, Europe Scientific, Crewe, Cheshire, United Kingdom).
PLETHYSMOGRAFY
Volume and body density were measured with an air displacement plethysmograph (BODPOD, mod 2000, Life Measurement, Inc., Concord, USA). Children were tested with underwear, without metal objects and a swimming cap to compress the hair. Later, children were weighed on a calibrated scale with an accuracy of 5 g. The system performs a pressure measurement with the chamber empty, then the equipment is calibrated using a 50 liter calibration cylinder, after which the subject is measured 2-3 times. Body size obtained by this method was used for the 4C (four compartment) equation.
DUAL-ENERGY X-RAY ABSORPTIOMETRY
Bone mineral density was estimated using dual energy x-ray absorptiometry using Lunar Prodigy Ghc DPX-NT (Lunar Radiology, WI, USA) technology, which assesses the entire body in a five-minute sweep. Children were placed supine wearing a light robe.
BIOELECTRICAL IMPEDANCE
Bioelectrical impedance was measured using Tanita BC-418MA, eight-electrode, hand-to-foot system, manufactured by the Tanita Corporation (Tokyo, Japan). Measurements were collected according to manufacturer's guidelines using a 50 kHz frequency. Height, sex and age were entered manually, whereas weight was recorded automatically. Measurements were taken in the morning after limited physical exercise and empty bladders.
4C MODEL
The 4C model divides the body in fat, water, protein, and minerals (18-20). The ability of the model to adjust core body mineral mass can result in a more accurate estimate of hydration and lean mass density compared with the 3C model. The 4C model is considered the "gold standard" because it takes into account the variability of its components. The equation has been previously validated in children of the same group (21).
The 4C equation used was a follows:
BF (kg) = [(2,747*BV) - (0,710*TBW)] + [(1,460*BMC) - (2,050*W)]
BV = body volume in liters (plethysmography), TBW = total body water in liters (isotope dilution), BMC = bone mineral content in kg. (DXA) and W = body weight (kg).
STATISTICAL ANALYSIS
Descriptive statistics were used: minimum, maximum and frequency tables. Continuous variables were analyzed with the goodness of fit test of Shapiro Wilk test of homogeneity of variance. For variables that met normality assumptions we reported the average and standard deviation, otherwise the median and interquartile range were shown. Differences by gender and pubertal development were analyzed using Student's t test.
Each of the methods (isotopic dilution, DXA and plethysmography BIA) were compared with the results of the 4C model. This comparison was made using the Lin (22) concordance coefficient and Bland-Altman method (23). The Bland-Altman analysis was calculated as the mean difference value between the reference (4C model) and each of the methods and the 95% distribution (confidence intervals).
A regression analysis was done to compare the 4C model and the simplest methods (isotope dilution, DXA, plethysmography and BIA) for determining BF%. The slopes and intercepts were assessed and the standard error of the estimate (SEE) was calculated. p < 0.05 was established as the cutoff for statistical significance. The study data were analyzed using STATA program version 10.1 (24).
Results
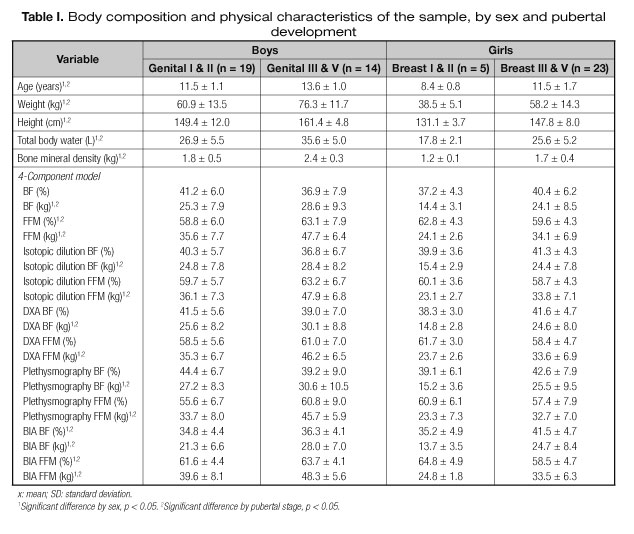
Physical and body composition of the sample by gender and pubertal development characteristics are shown in table I. There was no interaction between sex and pubertal development. However, several significant sex differences were found. Boys had significantly higher values in the variables: age, weight, height, total body water and bone mineral density. As well, in body composition for both BF (kg) and (fat free mass) FFM in kg and percentage for the 4C model, isotopic dilution, DXA, BIA and plethysmography. Also, boys had higher values in the determination of BF% by BIA. Similarly, there were significant differences associated with pubertal development. Both males and females with advanced puberty, showed significantly higher results in age, weight, height, total body water and bone mineral density. BF (kg) and FFM (kg) in the 4C model, isotope dilution, DXA, BIA and plethysmography. Lean mass (%) for boys only in the BIA and 4C model. Girls with pubertal development I and II had significantly higher values of FFM (%).
Lin coefficients for the different methods estimating BF% compared to the "gold standard" 4C model, by sex and pubertal development are shown in table II. Males in stage I and II, had concordance coefficients ranging between 0.352 and 0.866 and between 0.721 and 0.959 for stage III and V. In males, the greatest agreement was obtained with DXA (stage I and II) and isotope dilution in stage III and V. The lowest concordance was observed for the BIA (0.352 and 0.721 for boys and girls, respectively). In females of all stages, the greatest agreement was with plethysmography.
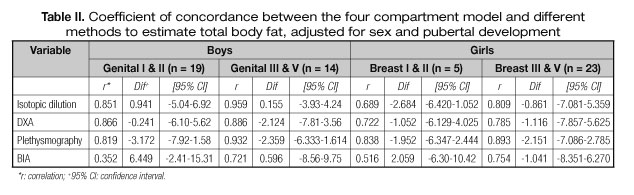
Table III shows the R2 value, intercepts and slopes for the regressions for BF% according to the 4C model and each of the different methods, along with SEE stratified by gender and pubertal development. R2 values were high for males, mainly in stage III and V. Each method explained between 43-87% of the variance in BF% for males in stage I and II and 78-96% for males in stage III and V.
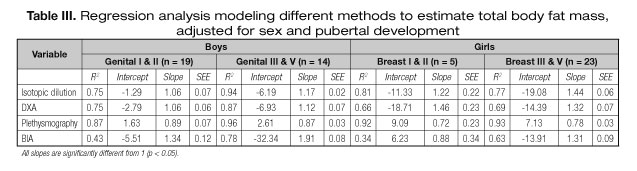
In both groups of children, the slopes differed significantly from 1 except for plethysmography. Lower values of SEE were observed in stage III and V males.
In girls, the highest R2 values were observed with the plethysmography method for all stages of pubertal development. Each method explained 34-92% of the variance in female BF% for stage I and II and 63-93% for girls in stage III and V, respectively.
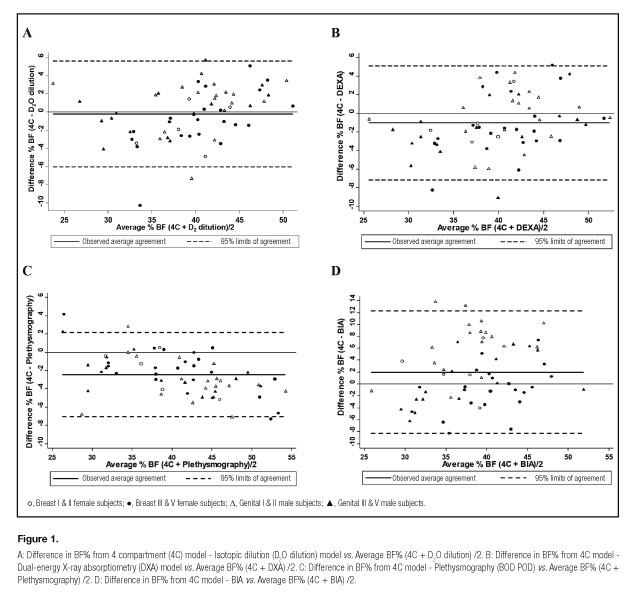
Figure 1 presents the analysis of specific agreement by Bland and Altman test in estimating BF% between the 4C model and the other methods (isotopic dilution, DXA and plethysmography BIA). In males, an underestimation of BF% with DXA and plethysmography was observed. Isotope dilution overestimated by 0.941 for stage I and II and 0.155 for stages III and V, implying a lack of agreement. Also in males, we observed an overestimation of FM (fat mass) by 6.449 for stages I and II and 0.596 for stages III & V, where there is clear disagreement between both measurements. For girls in stage III and V, we observed an overestimation (2.059) in total BF% estimated by BIA.
Discussion
Most methods for assessing body composition are 2C and involve measuring one compartment and body weight difference with another is estimated (e.g., total BF is evaluated and fat free mass is obtained). These methods incorporate theoretical assumptions about the composition of lean tissue, which are not valid in all cases, especially not in the context of obesity and during growth. Therefore, to minimize error, a combination of measurements is suggested to determine body composition. The 4C model allows the quantification of BF and lean mass, with a degree of precision not achievable with a single method (21). Methods has been demonstrated that there are Significant differences in the properties of fat-free tissue in obese, compared to normal weight, children and adolescents have been demonstrated (25-27). Hydration increases and density is lower in lean tissue of obese, compared to normal weight, individuals (25). These differences have been attributed in part to the expansion of extracellular water space (28,29); but also to lower bone mineralization (30). In this study, the 4C model was used as the gold standard to verify the validity of methods for 2C models in estimating total BF% in obese boys and girls with different levels of development of secondary sex characteristics. It is important to have methods that estimate BF% in school age and adolescent children because, even at the same weight, the risk of developing cardiovascular problems is increased with higher proportion of BF and lower lean mass ratio (31).
In our study, the best matching methods of the 2C and 4C models were obtained with DXA and isotopic dilution. Males in stage I & II with DXA (r = 0.87) and stage III & V males with isotope dilution (r = 0.95). In contrast, girls in both categories of pubertal development, the best agreement was obtained with plethysmography (I & II females r = 0.84 and r = 0.89 for the group III & V). These results are comparable to those obtained in a British study, conducted with 30 obese adolescents aged 14.10 ± 1.83 years. In boys, the correlation with plethysmography was r = 0.97 and r = 0.96 for DXA and isotope dilution, respectively. For girls, highest agreement was with plethysmography (r = 0.94) (32). An American study, which evaluated 25 children 11.4 ± 1.4 years, the model showed greater concordance with isotope dilution was 4C (r = 0.98), plethysmography (r = 0.97) and DXA (r = 0.95) (33). A study conducted with Mexican adolescents in school-age children (12.2 ± 2.0 years), showed greatest concordance with DXA, regardless of gender and pubertal stage (r = 0.95) (34).
In turn, in both sexes and stages of development, less agreement and correlation was obtained between the BIA and the 4C model. Our findings are similar to those of Aguirre et al. (35) who studied 424 Chilean students between 7-10 years and described the inaccuracy of the BIA for body composition estimation in prepubertal children. Bray et al. (36) also concluded that the BIA method was less acceptable.
The differences in BF% by pubertal stage, between the 2C and 4C models ranged from -3.17 to 6.50 in boys and girls and between -2.68 for 2.060 for both sexes.
Goran et al. (37) found underestimates similar to those reported in our study, from -6.45 (-7.37, - 5.53) and in the case of Deurenberg et al. differences ranged from +1.91 (1.18 to 2.63) (38).
One of the possible explanations for the limited functionality of the BIA for obese subjects may relate to the characteristics of the population in which the equations were created from. Differences in ethnicity, nutritional status, bone geometry, body composition and pubertal maturation may influence the relevance of the equations for other populations (21,39-41).
Our data are of particular interest because they allow for the comparison of validity of the models versus the gold standard (4C) to determine which methods are more reliable for assessing BF in obese adolescents of different pubertal development. In this cross-sectional study, comparing DXA and isotope dilution to the 4C model, we found that Tanner III and V stage children had minor differences for isotope dilution compared with the gold standard and that DXA had the best comparison to the gold standard for Tanner I & II children. Thus, isotopic dilution and DXA seem to have the highest accuracy and reliability for measuring BF in obese children and adolescents.
One of the strengths of this research was utilizing four compartments, which yields high precision and accuracy and is considered the gold standard in determining BF in vivo. Another advantage of the study was in the evaluation of differences in BF estimation using different methods, while considering gender and pubertal stage of development. However, a potential limitation is the narrow age range of the study group, which prevents extrapolation to a larger population.
In conclusion, it has been shown that isotopic dilution and DXA are methods sufficiently reliable compared to the gold standard method (4C) for determining BF% in obese children and adolescents, considering sex and stage of pubertal development. In the case of isotope dilution, it is a simple method that can be performed on site (e.g., schools, health centers) and only requires that samples be sent to a laboratory for validation, if sites do not have equipment. DXA requires equipment that is available in clinical centers or hospitals, which facilitates the measurement of fat and bone mineral density in obese patients.
Being able to reliably assess BF, which is associated with other metabolic variables, in obese adolescents could encourage better monitoring and thus help in the treatment of obese subjects. Moreover, we believe that having the proper methods is a contribution to the nutritional surveillance of pediatric obesity, providing reliable information to estimate the change in adiposity, in the global assessment of nutritional status for obese adolescents.
References
1. National Council for School Assistance. Map Nutritional 2013. (Online). Available from: URL: http://bpt.junaeb.cl:8080/MapaNutricionalGx/. (Accessed Jan. 23, 2015). [ Links ]
2. Demerath EW, Reed D, Rogers N, Sun SS, Lee M, Choh AC, et al. Visceral adiposity and its anatomical distribution as predictors of the metabolic syndrome and cardiometabolic risk factor levels. Am J Clin Nutr 2008;88:1263-71. [ Links ]
3. Goran MI, Alderete TL. Targeting adipose tissue inflammation to treat the underlying basis of the metabolic complications of obesity. Nestle Nutr Inst Workshop Ser 2012;73:49-66. [ Links ]
4. Dulloo AG, Montani JP. Body composition, inflammation and thermogenesis in pathways to obesity and the metabolic syndrome: an overview. Obes Rev 2012;13:1-5. [ Links ]
5. Warolin J, Coenen KR, Kantor JL, Whitaker LE, Wang L, Acra SA, et al. The relationship of oxidative stress, adiposity and metabolic risk factors in healthy Black and White American youth. Pediatr Obes 2013. DOI: 10.1111/j.2047-6310.2012.00135.x. (Epub ahead of print). [ Links ]
6. Shashaj B, Bedogni G, Graziani MP, Tozzi AE, DiCorpo ML, Morano D, et al. Origin of cardiovascular risk in overweight preschool children: a cohort study of cardiometabolic risk factors at the onset of obesity. JAMA Pediatr 2014;168:917-924. DOI: 10.1001/jamapediatrics.2014.900. [ Links ]
7. Prentice AM, Jebb SA. Beyond body mass index. Obes Rev 2001;2:141-7. [ Links ]
8. Demerath EW, Schubert CM, Maynard LM, Sun SS, Chumlea WC, Pickoff A, et al. Do changes in body mass index percentile reflect changes in body composition in children? Data from the Fels Longitudinal Study. Pediatrics 2006;117:e487-495. [ Links ]
9. Goacher PJ, Lambert R, Moffatt PG. Can weight-related health risk be more accurately assessed by BMI, or by gender specific calculations of Percentage Body Fatness? Med Hypotheses 2012;79:656-62. [ Links ]
10. Goin SB. Densitometry. In: Roche A, Heymsfield S, Lohman TG, editors. Human body composition. New York: Human Kinetics; 1996. p. 3-23. [ Links ]
11. Schoeller DA. Hydrometry. In: Roche A, Heymsfield S, Lohman TG, editors. Human body composition. New York: Human Kinetics; 1996. p. 25-43. [ Links ]
12. Mazess RB, Cameron JR, Sorenson JA. Determining body composition by radiation absorption spectrometry. Nature 1970;228:771-2. [ Links ]
13. Fuller NJ, Elia M. Potential use of bioelectrical impedance of the 'whole body' and of body segments for the assessment of body composition: comparison with densitometry and anthropometry. Eur J Clin Nutr 1989;43:779-91. [ Links ]
14. Roemmich JN, Clark PA, Weltman A, Rogol AD. Alterations in growth and body composition during puberty. I. Comparing multicompartment body composition models. J Appl Physiol 1997;83:927-35. [ Links ]
15. National Center for Health Statistical (NCHS) - Centers for Disease Control and Prevention (CDC) (Online). (2002?) (citado 17 Diciembre de 2014). Available from: URL: http://www.cdc.gov/GrowthCharts/. [ Links ]
16. Tanner JM. Fetus into man. Physical growth from conception to maturity. 2nd ed. Harvard University Press; 1989. [ Links ]
17. Lohman TG, Boileau RA, Slaughter RA. Body composition in children. In: Lohman TG. Editor. Human body composition. New York: Human Kinetics; 1984. p. 29-57. [ Links ]
18. Fuller NJ, Jebb SA, Laskey MA, Coward WA, Elia M. Four-component model for the assessment of body composition in humans: comparison with alternative methods, and evaluation of the density and hydration of fat-free mass. Clin Sci (Lond) 1992;82:687-93. [ Links ]
19. Bellisari A, Roche A. Anthropometry and Ultrasound. In: Heymsfield S, Lohman T, Wang Z, Going S. Editors. Human Body Composition. 2nd ed. United States: Human Kinetics; 2005. p. 109-28. [ Links ]
20. Sopher A, Shen W, Pietrobelli A. Pediatric Body Composition Methods. In: Heymsfield S, Lohman T, Wang Z, Going S. Editors. Human Body Composition. 2nd ed. United States: Human Kinetics; 2005. p. 129-39. [ Links ]
21. Wells J, Fuller N, Dewit O, Fewtrell M, Elia M, Cole T. Four-component model of body composition in children: density and hydration of fat-free mass and comparison with simpler models. Am J Clin Nutr 1999;69:904-12. [ Links ]
22. Lin LI. A concordance correlation coefficient to evaluate reproducibility. Biometrics 1989;45:255-68. [ Links ]
23. Bland JM, Altman DG. Statistical methods for assessing agreement between two methods of clinical measurement. Lancet 1986;1:307-10. [ Links ]
24. Stata Corp LP. Stata Statistical Software: Release 10. Stata Corp LP: College Station, TX: College Station, TX, 2007. [ Links ]
25. Haroun D, Wells JC, Williams JE, Fuller NJ, Fewtrell MS, Lawson MS. Composition of the fat-free mass in obese and nonobese children: matched case-control analyses. Int J Obes (Lond) 2005;29:29-36. [ Links ]
26. Wells JC, Fewtrell MS, Williams JE, Haroun D, Lawson MS, Cole TJ. Body composition in normal weight, overweight and obese children: matched case-control analyses of total and regional tissue masses, and body composition trends in relation to relative weight. Int J Obes (Lond) 2006;30:1506-13. [ Links ]
27. Vásquez F, Díaz E, Lera L, Vásquez L, Anziani A, Burrows R. Métodos de composición corporal y modelo de cuatro compartimentos en escolares obesos chilenos. Nutr Hosp 2012;27:1079-85. [ Links ]
28. Marken Lichtenbelt WD, Fogelholm M. Increased extracellular water compartment, relative to intracellular water compartment, after weight reduction. J Appl Physiol 1999;87:294-8. [ Links ]
29. Leone PA, Gallagher D, Wang J, Heymsfield SB. Relative overhydration of fat-free mass in postobese versus never-obese subjects. Ann NY Acad Sci 2000;904:514-9. [ Links ]
30. Goulding A, Taylor RW, Jones IE, McAuley KA, Manning PJ, Williams SM. Overweight and obese children have low bone mass and area for their weight. Int J Obes Relat Metab Disord 2000;24:627-32. [ Links ]
31. Barker DJ. The developmental origins of insulin resistance. Horm Res 2005;64:2-7. [ Links ]
32. Gately PJ, Radley D, Cooke CB, Carroll S, Oldroyd B, Truscott JG, et al. Comparison of body composition methods in overweight and obese children. J Appl Physiol 2003;95:2039-46. [ Links ]
33. Fields DA, Goran MI. Body composition techniques and the four-compartment model in children. J Appl Physiol 2000;89:613-20. [ Links ]
34. Ramírez E, Valencia ME, Moya-Camarena SY, Alemán-Mateo H, Méndez RO. Four-compartment model and validation of deuterium dilution technique to estimate fat-free mass in Mexican youth. Nutrition 2009;25:194-99. [ Links ]
35. Aguirre CA, Salazar GD, López de Romaña DV, Kain JA, Corvalán CL, Uauy RE. Evaluation of simple body composition methods: assessment of validity in prepubertal Chilean children. Eur J Clin Nutr 2015;69:269-73. [ Links ]
36. Bray GA, DeLany JP, Volaufova J, Harsha DW, Champagne C. Prediction of body fat in 12-y-old African American and white children: evaluation of methods. Am J Clin Nutr 2002;76:980-90. [ Links ]
37. Goran MI, Kaskoun MC, Carpenter WH, Poehlman ET, Ravussin E, Fontvieille AM. Estimating body composition of young children by using bioelectrical resistance. J Appl Physiol 1993;75:1776-80. [ Links ]
38. Deurenberg P, Kusters CS, Smit HE. Assessment of body composition by bioelectrical impedance in children and young adults is strongly age-dependent. Eur J Clin Nutr 1990;44:261-8. [ Links ]
39. Osborne DL, Weaver CM, McCabe LD, McCabe GP, Novotny R, Van Loan MD, et al. Body size and pubertal development explain ethnic differences in structural geometry at the femur in Asian, Hispanic, and white early adolescent girls living in the U.S. Bone 2012;51:888-95. [ Links ]
40. Rush EC, Puniani K, Valencia ME, Davies PSW, Plank LD. Estimation of body fatness from body mass index and bioelectrical impedance: comparison of New Zealand European, Maori and Pacific Island children. Eur J Clin Nutr 2003;57:1394-401. [ Links ]
41. Haroun D, Taylor SJC, Viner RM, Hayward RS, Darch TS, Eaton S, et al. Validation of bioelectrical impedance analysis in adolescents across different ethnic groups. Obesity 2010;18:1252-9. [ Links ]
![]() Correspondence:
Correspondence:
Fabián Vásquez.
Institute of Nutrition and Food Technology (INTA).
Universidad de Chile, 56-2-29781462.
Av. El Líbano 5524, Macul.
7830490 Santiago, Chile
e-mail: fvasquez@inta.uchile.cl
Received: 14/01/2016
Accepted: 29/02/16
