


Mi SciELO
 Servicios personalizados
Servicios Personalizados
Revista
Articulo
 Inglés (pdf)
 Articulo en XML
 Referencias del artículo
 Enviar articulo por email
Indicadores
-
 Citado por SciELO
 -
 Accesos
Links relacionados
-
 Citado por Google
 -
 Similares en
SciELO
Similares en
SciELO -
 Similares en Google
Compartir

 Permalink
Nutrición Hospitalaria
versión On-line ISSN 1699-5198versión impresa ISSN 0212-1611
Nutr. Hosp. vol.33 no.5 Madrid sep./oct. 2016
https://dx.doi.org/10.20960/nh.577
TRABAJO ORIGINAL / Valoración nutricional
Validity and reliability of beverage intake questionnaire: evaluating hydration status
Validez y fiabilidad de un cuestionario de ingesta de bebidas: evaluación del estado de hidratación
Efsun Karabudak and Eda Koksal
Department of Nutrition and Dietetics. Faculty of Health Sciences. Gazi University. Ankara, Turkey
ABSTRACT
Objective: The purpose of this investigation is to test the validity and reliability the assessment methods for the true beverage consumption of adults.
Methods: This cross-sectional study was carried out 291 healthy volunteers. The beverage intake questionnaire (BIQ) was prepared in combination with a new one which is developed based on basic principles and the existing one developed for the beverages consumed the most with respect to frequency and amount by Turkish populations. During the initial visit the participants completed BIQ1 and then provided a urine sample to determine urinary specific gravity (USG). For validity, participants recorded the type and quantity of foods and beverages consumed on the same day and previous two days. Two weeks later, for reliability, participants completed the same beverage intake questionnaire (BIQ2).
Results: Mean daily total fluid intake was estimated at 1,773 ± 49.4mL using the dietary intake record (DIR), 2,120 ± 49.5 mL with BIQ1 and 1,990 ± 46.3 mL for BIQ2. The largest contribution to total fluid intake was plain water. The response on the two assessment tools (DIR and BIQ1) all beverage intakes were significantly correlated (p < 0.01) except for alcoholic beverage intake. One could see a significant correlation between BIQ1 and BIQ2 in relation to total fluid intakes (r = 0.838,p < 0.01). The USG measurement was negatively correlated with three assessment tools (DIR, BIQ1 and BIQ2), the amount of plain water and the amount of total fluid intake.
Conclusions: The self-administered instrument described in this study may be useful for researchers interested in assessing habitual beverage consumption patterns or evaluating hydration status for adults.
Key words: Beverage intake questionnaire. Validity. Reliability. Urine gravity. Fluid intake.
RESUMEN
Objetivo: el objetivo de este estudio es evaluar la validez y la fiabilidad de los métodos utilizados para medir el consumo de bebidas de los adultos correctamente.
Método: este estudio transversal fue conducido con 291 voluntarios sanos. El cuestionario de consumo de bebidas (BIQ) fue desarrollado como una nueva encuesta con la adición de las bebidas más consumidas por la población turca en términos de frecuencia y cantidad. Los participantes realizaron el cuestionario BIQ1 en la primera reunión y después se tomaron muestras de orina con el fin de determinar la densidad urinaria (USG). Se registró la validez, el tipo y la cantidad de alimentos y bebidas consumidos por los participantes en el mismo día y dos días antes. Para comprobar la fiabilidad, se realizó a los participantes el mismo cuestionario de consumo de bebidas (BIQ2) dos semanas más tarde.
Resultados: el consumo total diario de líquidos fue estimado en 1.773 ± 49,4 ml por los registros de alimentos (DIR), en 2.120 ± 49,5 ml por el BIQ1 y en 1.990 ± 46,3 ml por el BIQ2. La mayor contribución a la ingesta total de líquidos es debida al agua. Ambas herramientas de evaluación (DIR y BIQ1) mostraron una correlación significativa en todas las bebidas con excepción de las bebidas alcohólicas (p < 0,01). Una de la correlación más significativa se encontró en el consumo total de líquidos entre BIQ1 con BIQ2 (r = 0,838, p < 0,01). Se encontró que la medición de la USG está correlacionada negativamente con las tres herramientas (DIR, BIQ1 ve BIQ2) de evaluación para el agua y la ingesta total de líquidos.
Conclusión: los cuestionarios para evaluar el estado de hidratación o y los hábitos de consumo de bebidas en adultos pueden ser de utilidad para aquellos investigadores interesados.
Palabras clave: Cuestionario de consumo de bebidas. Validez. Fiabilidad. Densidad urinaria. Ingesta de líquidos.
Introduction
Total fluid intake and its biomarkers have been associated with health and hydration status (1). Therefore, it is important to balance the hydration status of individuals in terms of health and function as it provides an indication regarding drinking behavior.
Guidelines for adequate total water intake for the general adult population have been proposed by several international governing bodies. Yet these recommendations are based on population median water intakes, with limited consideration of links between water intake and hydration status and without links between water intake and health. Moreover, the recommendations do not provide a method for individuals to ensure that they are consuming enough water to meet their specific hydration needs (2,3).
Establishing the adequacy of fluid intake based on physiological indicators of hydration is challenging, because there are multiple biological indicators of hydration in average adults in free-living conditions, each sensitive to a different aspect of hydration. Another common hardship in this area is a reliance on self-reported measures of habitual intake (4,5). Various markers have been proposed to assess the state of hydration (plasma osmolality, urine specific gravity (USG), urine osmolality), which can be used in different laboratory conditions, clinical practice or sports. However, to date, there has been no universally accepted biomarker that reflects an increase in hydration status in response to an increase in beverage intake. Therefore, no markers are defined as gold standard (4,6).
Interest in the type and quantity of beverage consumption is not new, and numerous approaches have been used to assess beverage intake, but the validity of these approaches has not been well established. While some research objectives have focused on the assessment of beverage-associated nutrients or intakes of individual beverages, other investigators have extrapolated beverage intakes from previously collected diet records or diet questionnaires (7,8). The available questionnaires were designed to measure beverage intake in children and adolescents, and most do not exclusively measure beverage intake (9). There is currently no rapid method for determining habitual beverage intake in Turkish adults. A brief, self-administered, valid and reliable beverage intake assessment tool could enhance nutrition research targeting beverage intake patterns. Thus, our objective is to test the validity and reliability of a newly developed self-administered beverage intake questionnaire (BIQ) as compared to dietary intake records (DIRs) and USG.
Methods
PARTICIPANTS
This cross-sectional study was carried out on a haphazard sample of 291 volunteers (56% male and 44% female) whose ages ranged between 19 and 55 (31.4 ± 10.1 years), located in Ankara, Turkey, between October and December 2014. Most participants (about 59%) were educated to secondary school level. A total of 331 subjects took part in the study, with 321 subjects completing both the beverage intake questionnaire (BIQ) and the dietary intake records (DIRs), and providing a urinary sample, and 30 subjects being excluded because of an energy intake below 900 kcal or greater than 5,000 kcal. The completion rate was 88%. The inclusion criteria for the study were absence of major diseases affecting nutritional status or the ability to keep a diet record, and no major diet changes in the past 6 months. Exclusion criteria included use of medication likely to interfere with water balance, such as hypertensive or diuretic treatment; history of metabolic or gastrointestinal disease; renal, hepatic or cardiac failure; abstention from strenuous physical activity; or high daily consumption of alcohol (more than two units or three units per day for women and men, respectively). Information on self-reported age (year), height (cm), weight (kg), education and profession was also collected. Body mass index (BMI) was calculated and participants were classified, according to their BMI, into three groups as underweight (BMI ≤ 18.5 kg/m2), normal weight (BMI: 18.5-24.9 kg/m2) and overweight (BMI > 25.0 kg/m2) (10).
The study was conducted according to the guidelines set out in the Declaration of Helsinki, and written informed consent was obtained from all subjects.
DIETARY ANALYSIS
Participants were visited twice in a 15-day period. During the initial visit, participants completed the beverage intake questionnaire (BIQ1) and then provided a urine sample to determine USG. Participants recorded the type and quantity of food and beverages consumed on the same day and following two days, which were consecutive -in total, 24-hour dietary records (DIRs). Two weeks later, on the second visit, participants completed the same beverage intake questionnaire (BIQ2).
The beverage intake questionnaire (BIQ) was adapted from Hedrick (11) and the most recent form consisted of the beverages consumed the most with respect to the frequency and amount by Turkish populations. The BIQ estimates habitual mean daily intake of water and beverages across 17 beverage categories [including water (plain), black and herbal tea, Turkish and instant coffee, buttermilk/kefir, milk (whole, reduced-fat, low-fat/skimmed), soda, cola and soft drinks (regular/diet), fruit juice drinks (natural/flavored), vegetable juice, sport drinks, energy drinks, most alcoholic beverages: beer (light, regular), raki, wine, mixed alcoholic drinks] plus one open-ended section for "other" beverages not listed. The BIQ included how often, which kind, what amounts and which portion size questions for each beverage. The frequency of servings was classified from "never" to "how many times a day/week/month" and the kind was categorized as diet/natural with or without sugar/cream, etc. In terms of amounts, common beverage sizes and amount used depended on beverages kinds (e.g. glass, bottle, box, can etc, and for portion size we used small, medium and large sizes).
URINE ANALYSIS
All visits were conducted between 6 and 12 a.m. to avoid the differences in USG measurements that may occur throughout the day. USG, an objective indicator of total fluid intake (hydration status and compliance), was determined using a handheld refractometer (ATAGO 4410 Digital Urine Specific Gravity Refractometer, Bellevue, WA). A urine sample from a "hydrated" subject typically falls within the range of 1.005 to 1.030 (12). All participants were completed the urine measurement.
DATA ANALYSIS
The analyses were performed using the SPSS package program version 15.0 (SPSS, Inc., Chicago, IL, USA). Descriptive statistics (mean ± standard error of the mean (SEM)) are reported for mean total consumption of beverage and beverage categories. To assess validity, the BIQ1 (test) responses were compared to DIR responses, and, for assessing reliability (retest), BIQ1 responses were compared to BIQ2. Spearman correlation coefficients were calculated to determine the strength of the relationship between DIR and BIQ1, and BIQ1 and BIQ2, and among associated specific gravity (USG).
The agreement between BIQ and DIR, and BIQ1 and BIQ2, was calculated using the intra-class correlation coefficient (ICC) and the Cronbach's alpha statistic. Each Cronbach's alpha statistic was compared with recognized standards of agreement as follows: "fair" (< 0.4), "moderate" (0.4-0.75), "good" (0.75-0.90) and "perfect" (> 0.90) (13). Bland-Altman plots were also generated and the mean difference (BIQ1-DIR) and limits of agreements (2 SD of the mean difference) were interpreted. This was performed using MedCalc for Windows, version 9.6.0.0 (MedCalc Software, Mariakerke, Belgium). p-values of < 0.01 and < 0.05 (two-tailed) were regarded as statistically significant.
Results
The mean BMI of participants was 24.2 ± 4.05 kg/m2. Over half (54.3%) of our sample had a normal weight, while 40.2% were overweight. The mean daily total fluid intake and kinds of beverage are given in table I. Mean daily total fluid intake was estimated at 1773 ± 49.4 mL using the DIR, 2,120 ± 49.5 mL with BIQ1 and 1,990 ± 46.3 mL per day for BIQ2. Differences in total fluid intake between DIR and BIQ1 were -347 ± 37 mL per day and differences between BIQ1 and BIQ2 were 130 ± 27 mL per day (Table I).

When analyzing table I, the responses in the two assessment tools (DIR and BIQ1 = validity) were significantly correlated (all beverages p < 0.01) except for alcoholic beverages (beer, raki and wine). The correlation coefficients between the DIR and BIQ1 ranged from 0.314 (buttermilk/kefir) to 0.777 (sport drinks). Significant correlations were detected between all BIQ1 and BIQ2 variables, although the correlation for wine was lower than that for other beverage categories. The correlation coefficients between BIQ1 and BIQ2 ranged from 0.287 (wine) to 0.992 (cola) (p < 0.01). And a significant correlation was found between DIR and BIQ1 (r = 0.723, p < 0.01) and between BIQ1 and BIQ2 in total fluid intakes (r = 0.838, p < 0.01).
The largest contributor to total fluid intake was plain water, representing 58.6 ± 1.12%, 53.0 ± 0.9% and 55.0 ± 0.9% of DIR, BIQ1 and BIQ2. Other beverage types that accounted for more than 10% of total fluid intake were hot beverages (tea and coffee) (14.0 ± 19%) and sweetened beverages (cola, soda, soft, sport and energy drinks) (12.0 ± 19%). Milk, diet beverages, flavored water and alcohol made up the remaining 13% of fluid intake.
The mean ± SEM for USG was 1.019 ± 0.0003 mOsm/kg. While 55.3% of individuals had a normal hydration status, 5.9% were cases of dehydration (≤ 1.005).
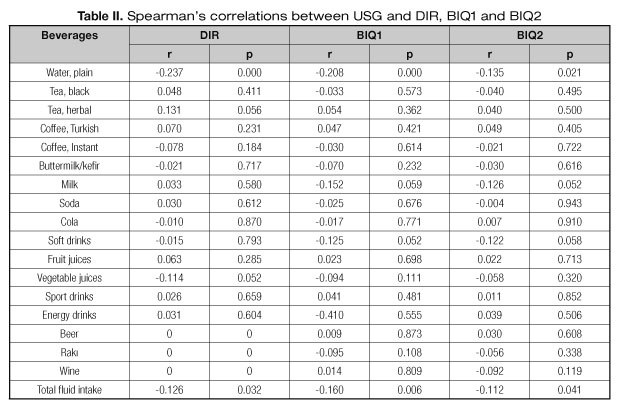
Spearman's correlations were calculated for participants with complete USG and three assessment tools (DIR, BIQ1 and BIQ2) (table II). USG measurement was negatively correlated with three assessment tools (DIR, BIQ1 and BIQ2), with amounts of plain water (respectively, r = -0.237, p = 0.000; r = -0.208, p = 0.000; r = -0.135, p = 0.021) and with amounts of total fluid intake (respectively, r = -0.126, p = 0.032; r = -0.160, p = 0.006; r = -0.112, p = 0.041) (Table II).
Comparing DIR and BIQ1, the agreement was classified according to Cronbach's alpha statics as "perfect" on cola, fruit juices and vegetable juices; as "good" on water, black tea, instant coffee, milk, energy drinks and total fluid intake; and as "moderate" on Turkish coffee, buttermilk/kefir, soda and sports drinks. Comparing BIQ1 and BIQ2, the agreement was classified as "perfect" on 14 items and as "good" on 3 items (Table III).

The Bland-Altman plot for total fluid intake showed that the agreement between the DIR and BIQ1 in Figure 1 and BIQ1 and BIQ2 in Figure 2 was dependent on intake level. Differences in the daily intake of total fluid with DIR and BIQ1; BIQ and BIQ2 plotted against the mean daily intake estimated by the two methods. Mean difference and 95% limits of agreement (1.96 × SD of mean difference) are included.


These plots show that the DIR and BIQ1 and BIQ1 and BIQ2 are very likely to agree on total fluid intake, since the range obtained for the 95% limits of agreement was -890.6 + 1,583.8 for DIR-BIQ1 and -776.7 + 1037.5 for BIQ1-BIQ2 in total fluid intake. The observed limits of agreement are quite strongly influenced by a few outliers (Figs. 1-2).
Discussion
The purpose of this study was to assess the hydration status with rapid, accurate and simple beverage intake questionnaire and to determine the validity and reliability of it's in healthy, sedentary individuals. This questionnaire was designed to capture the usual beverage intake. Dietary records have been used successfully to estimate energy and nutrient intakes. Numerous dietary records have been used to assess beverage intake. Some research objectives have extrapolated beverage intakes from previously collected diet records or diet questionnaires (7,8,14). Other investigators have focused on the assessment of beverage associated nutrients or intakes of individual beverages (15,16). In addition, three days of recalls or records may not adequately represent total fluid intake or kinds of beverage, particularly for items that have high intra-individual variation (i.e. are consumed sporadically) (17). Moreover, the validity of these approaches has not been well established.
In this study, compared with the dietary intake record, the BIQ tended to over-report total fluid intake by 346.6 mL. When the difference between BIQ1 and BIQ2 was analyzed, the BIQ1 over-reporting was only 130.4 mL. Comparing DIR and BIQ1, the total fluid intake agreement was classified as "good" and "perfect" according to Cronbach's alpha statics respectively comparing DRI-BIQ1 and BIQ1-BIQ2.
It is well known that fluid intake is difficult to monitor. Although there is a lack of biomarkers to reflect hydration status in response to beverage intake, various markers have been proposed for assessing the state of hydration (1). Some dietary intake methods have used biomarkers to validate the data collected. Biomarkers of intake are able to objectively assess dietary intake/status without the bias of self-reported dietary intake errors and also overcome the problem of intra-individual diet variability (18,19).
In this study, we used urinary specific gravity as a reference biomarker of the self-reported intake of total fluid and kinds of beverages (BIQ) (1). As would be expected for a possible biomarker of total fluid intake, USG was negatively correlated with the amount of total fluid intake for three assessment tools (DIR, BIQ1, BIQ2); thus, the BIQ appears to be a valid and reliable and easily administered questionnaire for assessing beverage intakes among adults. The reliability and validity coefficients for the BIQ were similar in magnitude to those reported elsewhere. Malisova's study (20) reported no correlations between beverage intake estimated from the water balance questionnaire against USG (r = -0.107, p = 0.403). However, they found moderate correlations with the other biomarkers measured. Hedrick's study (11) found that USG was negatively correlated with grams of total daily beverage consumption at different time (-0.202, p < 0.05 and -0.238, p < 0.05).
In our study, of the 17 beverage variables assessed, 14 of beverages were significantly correlated with DIR (p < 0.05). The results of our study suggest that a quantitative beverage intake questionnaire provides more useful data about consumption of total fluid and kinds of beverage intakes than a 3-day dietary record and urinary specific gravities. In other studies, beverage frequency records (11) appear to be a better measuring method for assessing (20) beverage intake than the 3-day dietary questionnaire when compared with biomarkers. It is clear that the development of a properly validated beverage frequency questionnaire may improve the evidence behind hydration outcomes.
Conclusion
As a conclusion, the self-administered instrument described in this study shows reproducibility in a range observed for similar dietary intake record used with adults. This tool may be useful for researchers interested in assessing habitual beverage consumption patterns to evaluate hydration status for adults, particularly in large-scale investigations where lengthier, resource-intensive dietary intake assessment techniques are not feasible. Among nutrition practitioners, this tool could be utilized as a rapid method to assess total fluid intake and kinds of beverages in Turkey.
Although several hydration status studies have investigated the response of various biomarkers to changes in beverage intake, important theoretical considerations have also been published (21,22). We still do not have enough data available in the literature to set robust biomarkers proxies for fluid intake.
Limitations
Two primary limitations exist in this investigation. Firstly, participants completed the self-administrated BIQ and DIR. So subjects were prone to underestimate their beverage intake when they kept dietary records.
Secondly, In Turkish society, alcoholic beverages are not consumed in high amounts and at high frequency. Therefore, the amount of alcoholic beverages in DIR was less than in the BIQ. In addition, every alcoholic beverage should be combined into only one category, "alcoholic beverages". A need for studies that systematically examine the correlation of beverage intake and hydration biomarkers in different populations has been demonstrated.
Acknowledgements
The authors would like to thank Dietitian Gulsum BEKDIS, Dietitian Cansu CAN, Dietitian ipek SARLAK YABUZ and Dietitian Seda YUZBASIOGLU to technical help to data collection and for their collaborated efforts in conducting the survey.
References
1. Sontro, JM, Dixon SN, Garg AX, Buendía-Jiménez I, Dohein O, Huang SH, et al. Association between water intake, chronic kidney disease, and cardiovascular disease: a cross-sectional analysis of NHANES data. Am J Nephrol 2013;7:434-42. [ Links ]
2. EFSA Panel on Dietetic Products, Nutrition, and Allergies (NDA). Scientific Opinion on Dietary reference values for water. EFSA Journal 2010;8(3):1459-62. [ Links ]
3. Institute of Medicine (IOM). Dietary Reference Intakes for Water, Potassium, Sodium, Chloride, and Sulfate. The National Academies Press; Washington, DC; 2004. [ Links ]
4. Cheuvront SN, Ely BR, Kenefick RW, Sawka M.N. Biological variation and diagnostic accuracy on dehydration assessment markers. Am J Clin Nutr 2010;92:565-73. [ Links ]
5. Cheuvront SN, Fraser CG, Kenefick RW, Ely BR, Sawka MN. Reference change values for monitoring dehydration. Clin Chem Lab Med 2011;49:1033-37. [ Links ]
6. Armstrong LE, Maresh CM, Castellani JW, Bergeron MF, Kenefick RW, LaGasse KE, et al. Urinary indices of hydration status. Int J Sport Nutr 1994;4:265-79. [ Links ]
7. Sohn W, Heller KE, Burt BA. Fluid consumption related to climate among children in the United States. J Public Health Dent 2001;61:99-106. [ Links ]
8. Hirvonen T, Pietinen P, Virtanen M, Albanes D, Virtamo J. Nutrient intake and use of beverages and the risk of kidney Stones among male smokers. Am J Epidemiol 1999;150:187-94. [ Links ]
9. Hedrick VE, Savla J, Comber DL, Flack KD, Estabrooks PA, Nsiah-Kumi PA, Ortmeier S, et al. Development of a brief questionnaire to assess habitual beverage intake (BEVQ-15): sugar-sweetened beverages and total beverage energy intake. J Acad Nutr Diet 2012;112:840-49. [ Links ]
10. WHO/FAO. Diet, Nutrition and the Prevention of Chronic Diseases, WHO Technical Report Series, 916, Geneva; 2003. [ Links ]
11. Hedrick VE, Comber DL, Estabrooks PA, Savla J, Davy BM. The Beverage Intake Questionnaire: Determining Initial Validity and Reliability. J Am Diet Assoc 2010;110:1227-32. [ Links ]
12. Williamson MA, Snyder LM. Wallach's Interpretation of Diagnostic Tests. 9th ed. Lippincott Williams & Wilkins: Philadelphia, USA; 2011. [ Links ]
13. Fleiss J. Reliability of Measurement. The Design and Analysis of Clinical Experiments, Wiley Classics Library Edition published John Wiley & Sons, Inc., Canada; 1992. p. 1-32. [ Links ]
14. Barbieri P, Crivellenti LC, Nishimura RY, Sartorelli DS. Validation of a food frequency questionnaire to assess food group intake by pregnant women. J Hum Nutr Diet 2015;28:38-44. [ Links ]
15. Combet E, Lean MEJ. Validation of a short food frequency questionnaire specific for iodine in UK females of childbearing age. J Hum Nutr Diet 2014;27:599-605. [ Links ]
16. Ferreira-Pêgo C, Babio N, Fenández-Alvira JM, Iglesia I, Moreno LA, Salas-Salvadó J. Fluid intake from beverages in Spanish adults; cross-sectional study. Nutr Hosp 2014;29:1171-78. [ Links ]
17. Willett WC. Nutritional Epidemiology, Third Edition. New York: Oxford University Press; 2012. [ Links ]
18. Institute of Medicine (IOM). Dietary reference intakes: Research synthesis workshop summary. The National Academies Press, Washington, DC; 2007. [ Links ]
19. Hardin DS. Validating dietary intake with biochemical markers. J Am Diet Assoc 2009;109:1698-99. [ Links ]
20. Malisova O, Bountziouka V, Panagiotakos DB, Zampelas A, Kapsokefalou. M. The water balance questionnaire: design, reliability and validity of a questionnaire to evaluate water balance in the general population. Int J Food Sci Nutr 2012;63:138-44. [ Links ]
21. Popowski LA, Oppliger RA, Lambert GP, Johnson RF, Johnson AK, Gisolfi CV. Blood and urinary measures of hydration status during progressive acute dehydration. Med Sci Sports Exerc 2001;33:747-53. [ Links ]
22. Mears SA, Shirreffs SM. Assessing Hydration Status and Reported Beverage Intake in the Workplace. Am J Lifestyle Med 2014;21:1-12. [ Links ]
![]() Correspondence:
Correspondence:
Eda Koksal.
Besevler, 06500
Ankara, Turkey
e-mail: betkoksal@yahoo.com
edakoksal@gazi.edu.tr
Received: 29/04/2016
Accepted: 08/06/2016
