


Mi SciELO
 Servicios personalizados
Servicios Personalizados
Revista
Articulo
 Inglés (pdf)
 Articulo en XML
 Referencias del artículo
 Enviar articulo por email
Indicadores
-
 Citado por SciELO
 -
 Accesos
Links relacionados
-
 Citado por Google
 -
 Similares en
SciELO
Similares en
SciELO -
 Similares en Google
Compartir

 Permalink
Nutrición Hospitalaria
versión On-line ISSN 1699-5198versión impresa ISSN 0212-1611
Nutr. Hosp. vol.33 supl.3 Madrid 2016
https://dx.doi.org/10.20960/nh.315
Dietary intake according to hydration status in 9-10 year-old soccer players
Lusmar Rodriguez1, Ana Raquel Azevedo1, André Seabra2, Patrícia Padrão1,3 and Pedro Moreira1,2
1Faculty of Nutrition and Food Sciences. University of Porto (FCNAUP). Porto, Portugal.
2Research Centre in Physical Activity, Health and Leisure. Faculty of Sport. University of Porto. Porto, Portugal.
3Institute of Public Health. University of Porto (ISPUP). EPIUnit - Epidemiology Research Unit. Porto, Portugal
ABSTRACT
Introduction: Children have an increased risk of voluntary dehydration especially during physical activity which may increase the risk of non-compensating water losses.
Objectives: The aim of this study was to assess the hydration status and its relation to food intake in a children group of soccer players.
Method: A sample of 36 boys aged 9-10 years was included in this study; 30 completed a 24 h urine collection. Participants completed a 24 h urine collection; a 24 hours food recall corresponding to the day of urine collection was applied, weight and height were measured and parents/caregivers filled a lifestyle and socio-demographic questionnaire. The free water reserve (FWR [ml/24 h] = urine volume [ml/24 h] - obligatory urine volume [ml/24 h]) was used to assess the hydration status. Food and beverage groups were created and models of unconditional logistic regression were fitted in order to estimate the magnitude of the association between the hydration status and diet.
Results: Forty three per cent of participants were classified as at risk of hypohydration. Children who reported a high fruit and vegetables intake (above the median) were at decreased risk of hypohydration (OR = 0.19, 95% CI 0.04-0.94, p = 0.041), compared to children who reported a low fruit and vegetables intake.
Conclusions: Almost half of the children were at risk of hypohydration. Our results suggested that water food sources such as fruit and vegetables may contribute to euhydration.
Key words: Free water reserve. Children. Dietary intake. Hydration status. Sport.
Introduction
Water is essential to a wide variety of physiological functions in cell structure, metabolic transportation and temperature regulation, as well as in residual elimination (1). The human organism regulates body water content in order to maintain the equilibrium of fluid ingestion and excretion through the hypothalamic mechanism of thirst control, antidiuretic hormone regulation, renal function, breathing and perspiration (2,3).
The demand of water intake varies between subjects and depends on environmental factors such as climate conditions, lifestyle, physical activity and eating habits. The water intake should be sufficient to compensate daily losses (4). An appropriate hydration can reduce the risk of several diseases and physiological disturbances as headaches, obstipation, urolithiasis and renal malfunction (5). However, water consumption habits are complex and receive under-attention when evaluating eating habits (6).
Soccer is characterized as a high intensity exercise with a general intensity of 70-80% VO2 max (7). The elevation of body temperature and the sweating response results from the high intensity of this sport and normally generate a loss of body water that needs to be replaced to avoid dehydration (8).
The amount of water in children is approximately 75% of their body weight (9), and in the case of young athletes, adequate fluid intake is important to maintain a satisfactory body hydration status and avoid the risk of low performance and heat injury (10).
As far as we are aware, very few studies addressed the hydration status in children using FWR as hydration marker and dietary intake, particularly fruit and vegetable intake (11) which favors hydration. New studies are needed focusing on dietary intake and hydration status (5,6) and the present study aims to contribute to fill this research gap in children soccer players.
Objectives
The aim of this research was the evaluation of the hydration status and its relation to food intake in a children group of soccer players.
Methods
This study was performed in a convenience sample of 30 male 9-10 years soccer players from a club of the north of Portugal, which completed a 24 h urine collection. Additionally, a food record corresponding to the day of urine collection combined with a lifestyle and socio-demographic questionnaire was filled with their parents help.
URINE SAMPLING AND ANALYSIS
To estimate hydration status, urine samples were collected during 24 hours, on Sunday 23rd of November 2013. The mean temperature was 9 oC, with 59% humidity. All subjects and their parents received written instructions on the urine collection procedure. Only the first morning urine was discarded, while the first urine of the following day was considered. The urine collection was stored in individual containers that were maintained at low temperatures until analyzed. A certified laboratory analyzed the urine samples to determine urine volume (ml), creatinine (mg/d) and sodium content (mg/d) (12). Every child had a weight-related 24 h creatinine excretion rate equal or higher than 0.1 moll kg-1 d-1 (13,14), so the total sample was considered.
DATA COLLECTION
Trained interviewers from the Faculty of Nutrition and Food Science of the University of Porto performed data collection. A Tanita segmental BC-418 was used to evaluate the subject's weight (kg). Height (m) was obtained using a portable stadiometer and waist perimeter (cm) (29) was analyzed through a SECA® tape measure.
Body mass index (BMI) was calculated according to the following formula: BMI = (weight [kg])/(height2 [m2])
BMI percentiles were classified using the OMS growth curves (5-18 year-olds): low BMI (< percentile 3), normal BMI (≥ percentile 3 and < percentile 85), overweight (≥ percentile 85 and < percentile 97) and obesity (≥ percentile 97) (15,16).
HYDRATION STATUS AND FWR
The free water reserve, calculated as FWR (ml/24 h) = (measured urine volume [ml/24 h] - obligatory urine volume [ml/24 h]) was used to assess hydration status. The obligatory urine volume (ml/24 h) was derived from the excreted 24 h urine solutes (mOsm/24 h; mainly determined by urinary concentrations of nitrogen, sodium, potassium, and phosphorus) divided by the mean value (2 standard deviation) of maximum urine osmolality of the renal concentrating test for healthy subjects in the respective age group. In children and young adults having a typical affluent Western diet, this value is 830 mOsm/l. Positive and negative FWR values correspond to "euhydrated state" and "risk of hypohydration", respectively (17).
DIETARY ASSESSMENT
To estimate individual food and nutrient intake one-day dietary record was used. Images of the Manual of Quantification of Foods (18) were also used to obtain a more accurate portion intake. To convert food into nutrients (including water composition of food), the Food Processor Plus® software was used (ESHA Research, USA). This software follows food composition guidelines of the United States Department of Agriculture, however, typically Portuguese food were added to this database of nutritional content of foods, according to the Portuguese Food Composition Table (PFCT) (19,20).
Foods and beverages were grouped in four categories (Table I): "milk and dairy products", "fruit and vegetables", "coffee, barley, soft drinks, juices and water" and "others"; and then, each category was divided in two groups according the median of the ingested amount: "low consumption" (≤ 50th percentile) and "high consumption" (> 50th percentile). Models of unconditional logistic regression were fitted in order to estimate the magnitude of the association between the contribution of different food groups and the hydration status.

The total energy intake was used to reject potentially implausible records by relating it to the basal metabolic rate (21) considering age- and sex-specific cut-offs (22). Eight children presented implausible eating records, however, the data was analyzed considering the overall sample since non-significant differences in the hydration variables were detected between children with plausible and implausible eating records.
STATISTICAL ASSESSMENT
Data was analyzed with the statistical software IBM SPSS Inc. (Version 21.0). Kolmogorov-Smirnov test was used to test variables normality. Categorical variables were expressed in absolute value and percentage, and the continuous variables in mean ± standard deviation, median (P50) and percentiles (P25, P75). T-student's test was used for independent samples, and the Mann-Whitney U test was utilized to compare cardinal variables. Chi-squared test was used for categorical variables. Statistical significance was considered for a p < 0.05.
Fruit and vegetables groups were considered in an unconditional logistic regression model, in order to estimate the degree of association between food groups intake and hydration status of children.
Results
The characteristics of children and their parents/legal guardians, according to hydration status, are presented in tables II and III; there are no significant differences between any of these descriptive variables with regard to hydration status. The majority of the children (16, 53.3%) had a normal weight. FWR was positive in 17 children (56.8%), presenting euhydrated status; however, negative FWR values with risk of hypohydration were observed in 13 children (43.3%). Energy intake was 1,683 ± 566 kcal, and it was not significantly different according to the hydration status.


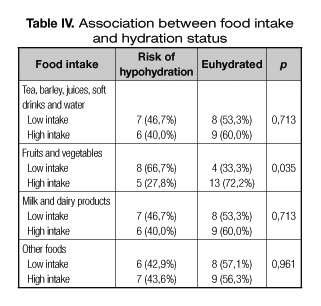
In table IV, urine biomarkers of hydration are presented for each of the hydration status categories. Table V shows the intake of the different food groups (low and high intake) according to hydration status, and a significant higher prevalence of euhydrated children is found in the group with a higher intake of fruit and vegetables. This association was confirmed after logistic regression analysis, and children with higher intake of fruit and vegetables were at a lower risk of hypohydration (OR = 0.19, CI 95% 0.04-0.94).

Discussion
This study provides evidence for higher intake of fruit and vegetables and lower risk of hypohydration, defined according to FWR values, in children athletes aged 9-10. Although there is no fully accepted method to characterize hydration status, FWR may be recommended to define 24-h hydration status (23), and previous studies also revealed that FWR values may be affected by the quality of the diet (24,25). Montenegro-Bethancourt (2013) provided, for the first time, evidence for an association between fruit and vegetables intake and children hydration status. Although other authors (26,27) speculated that fruit and vegetables were an essential predictor of hydration status, we also assessed the association with other food groups such as "milk and dairy products", and "coffee, barley, sodas, juices and water". Nonetheless, our findings revealed that only high "fruit and vegetables" intake was significantly associated with a better hydration status. Therefore, a better hydration status could be achieved not only with water and other fluids but also with the ingestion of fruit and vegetables.

In the present study, urine collection was made on Sunday to facilitate the collection on a 24 h period with the help of the children's parents/legal guardians. Although this day may not represent a typical weekday, Sunday may offer the best logistic conditions to characterize familiar food and beverages intake pattern and avoid the influence of professionals at school, which we considered to be a strength of our study. On the other hand, the small size of the sample and the difficulty in obtaining precise data of the dietary intake were the bigger limitations in our study. Moreover, only one-day urine collection and one 24 h diet record made our results harder to generalize to normal daily behavior.
The results obtained in this research showed that the mean total intake of water was 1.5 l and when compared to the 2.1 l recommended by European Food Safety Authority (EFSA), only 71% of the children met EFSA recommendations. A large proportion of hypohydrated children was also found in the study conducted by Phillips (28). However, according to the calculated minimal fluid intake recommendation (during and following an hour of exercise) of 945 ml (10) plus the daily water needs (2,1 l), children should consume a total of 3,045 ml of water in a single day. Water intake below fluid intake guidelines, particularly considering sport activities, may result in increased risk of heat-related illnesses and increased physiological strain (29,30).
The possibility that inexperienced athletes, attending sports exercise sessions, could fail to drink properly is elevated and it might be explained by anxiety, distraction and diversion (10), typical in this age range. Therefore, coaches and parents should promote the fluid ingestion and educate in the importance of hydration and healthy eating practices in young athletes to improve the overall quality of children's diet and their hydration status (10), and increase sports performance.
Conclusions
In conclusion, almost half of the children were at risk of hypohydration. Our results suggested that a hydrated state could be better achieved in the group with a higher intake of fruits and vegetables.
Declaration of interest
P.P. was a member of the Scientific Board of the Institute of Hydration and Health between 2008 and 2015.
References
1. Institute of Medicine of the U.S. National Academies 2005. Dietary reference intakes for water, potassium, sodium, chloride, and sulfate. Cited on June 2nd 2015. Available at: http://www.nal.usda.gov/fnic/DRI/DRI_Water/water_full_report.pdf. [ Links ]
2. Armstrong LE, Johnson EC, Muñoz CX, Swokla B, Le Bellego L, Jiménez L, et al. Hydration biomarkers and dietary fluid consumption of women. J Acad Nutr Diet 2012;112(7):1056-61. [ Links ]
3. Van Wynsberghe DNCRCR. Human anatomy and physiology. New York: McGraw-Hill; 1995. [ Links ]
4. Perrier E, Rondeau P, Poupin M, Le Bellego L, Armstrong LE, Lang F, et al. Relation between urinary hydration biomarkers and total fluid intake in healthy adults. European Journal of Clinical Nutrition 2013;67(9):939-43. [ Links ]
5. Clark WF, Sontrop JM, Macnab JJ, Suri RS, Moist L, Salvadori M, et al. Urine volume and change in estimated GFR in a community-based cohort study. Clinical Journal of the American Society of Nephrology 2011;6(11):2634-41. [ Links ]
6. Marcos A, Manonelles P, Palacios N, Warnberg J, Casajus JA, Pérez M, et al. Physical activity, hydration and health. Nutricion Hospitalaria 2014;29(n06):1224-39. [ Links ]
7. Bangsbo J, Mohr M, Krustrup P. Physical and metabolic demands of training and match-play in the elite football player. Journal of Sports Sciences 2006;24(7):665-74. [ Links ]
8. Edwards AM, Noakes TD. Dehydration: Cause of fatigue or sign of pacing in elite soccer? Sports Medicine (Auckland, NZ) 2009;39(1):1-13. [ Links ]
9. Kleiner SM. Water: An essential but overlooked nutrient. J Am Diet Assoc 1999;99(2):200-6. [ Links ]
10. Rowland T. Fluid replacement requirements for child athletes. Sports Medicine (Auckland, NZ) 2011;41(4):279-88. [ Links ]
11. Montenegro-Bethancourt G, Johner SA, Remer T. Contribution of fruit and vegetable intake to hydration status in schoolchildren. The American Journal of Clinical Nutrition. 2013;98(4):1103-12. [ Links ]
12. Owen LJ, Wear JE, Keevil BG. Validation of a liquid chromatography tandem mass spectrometry assay for serum creatinine and comparison with enzymatic and Jaffe methods. Annals of Clinical Biochemistry 2006;43(Pt 2):118-23. [ Links ]
13. Rangan AM, Flood VM, Gill TP. Misreporting of energy intake in the 2007 Australian Children's Survey: Identification, characteristics and impact of misreporters. Nutrients 2011;3(2):186-99. [ Links ]
14. Remer T, Neubert A, Maser-Gluth C. Anthropometry-based reference values for 24-h urinary creatinine excretion during growth and their use in endocrine and nutritional research. The American Journal of Clinical Nutrition 2002;75(3):561-9. [ Links ]
15. De Onis M, Onyango AW, Borghi E, Siyam A, Nishida C, Siekmann J. Development of a WHO growth reference for school-aged children and adolescents. Bulletin of the World Health Organization 2007;85(9):660-7. [ Links ]
16. Group WHOMGRS. WHO Child Growth Standards based on length/height, weight and age. Acta Paediatrica (Oslo, Norway: 1992) 2006;450:76-85. [ Links ]
17. Manz F. Hydration in children. Journal of the American College of Nutrition 2007;26(Suppl. 5):562s-9s. [ Links ]
18. Marques MPO, De Almeida MDV. Manual de Quantificação de Alimentos 1996. [ Links ]
19. Drewnowski A, Rehm C, Constant F. Water and beverage consumption among children age 4-13y in the United States: Analyses of 2005-2010 NHANES data. Nutrition Journal 2013;12(1):85. [ Links ]
20. Ferreira F, Graça M. Tabela de composição dos alimentos portugueses. Instituto Nacional de Saúde Dr Ricardo Jorge; 1985. [ Links ]
21. Schofield WN. Predicting basal metabolic rate, new standards and review of previous work. Human Nutrition Clinical Nutrition 1985;39(Suppl. 1):5-41. [ Links ]
22. Sichert-Hellert W, Kersting M, Schoch G. Underreporting of energy intake in 1 to 18 year old German children and adolescents. Zeitschrift fur Ernahrungswissenschaft 1998;37(3):242-51. [ Links ]
23. Phillips SM, Sykes D, Gibson N. Hydration status and fluid balance of elite European youth soccer players during consecutive training sessions. Journal of Sports Science & Medicine 2014;13(4):817-22. [ Links ]
24. Stahl A, Kroke A, Bolzenius K, Manz F. Relation between hydration status in children and their dietary profile-Results from the DONALD study. European Journal of Clinical Nutrition 2007;61(12):1386-92. [ Links ]
25. Alexy U, Cheng G, Libuda L, Hilbig A, Kersting M. 24 h-sodium excretion and hydration status in children and adolescents-Results of the DONALD Study. Clinical Nutrition 2012;31(1):78-84. [ Links ]
26. Ebner A, Manz F. Sex difference of urinary osmolality in German children. American Journal of Nephrology 2002;22(4):352-5. [ Links ]
27. Remer T, Dimitriou T, Manz F. Dietary potential renal acid load and renal net acid excretion in healthy, free-living children and adolescents. The American Journal of Clinical Nutrition 2003;77(5):1255-60. [ Links ]
28. Phillips SM, Findlay S, Kavaliauskas M, Grant MC. The Influence of serial carbohydrate mouth rinsing on power output during a cycle sprint. J Sports Sci Med 2014;13(2):252-8. [ Links ]
29. Rodríguez NR, Di Marco NM, Langley S. American College of Sports Medicine position stand. Nutrition and athletic performance. Medicine and Science in Sports and Exercise 2009;41(3):709-31. [ Links ]
30. Smith JW, Holmes ME, McAllister MJ. Nutritional considerations for performance in young athletes. Journal of Sports Medicine (Hindawi Publishing Corporation) 2015;2015:734649. [ Links ]
![]() Correspondence:
Correspondence:
Lusmar Rodriguez.
Faculty of Nutrition and Food Sciences.
University of Porto (FCNAUP).
Porto, Portugal
e-mail: lusmararodriguez@gmail.com

