


My SciELO
 Custom services
Services on Demand
Journal
Article
 English (pdf)
 Article in xml format
 Article references
 Send this article by e-mail
Indicators
-
 Cited by SciELO
 -
 Access statistics
Related links
-
 Cited by Google
 -
 Similars in
SciELO
Similars in
SciELO -
 Similars in Google
Share

 Permalink
Nutrición Hospitalaria
On-line version ISSN 1699-5198Print version ISSN 0212-1611
Nutr. Hosp. vol.34 n.1 Madrid Jan./Feb. 2017
https://dx.doi.org/10.20960/nh.977
TRABAJO ORIGINAL / Nutrición en el anciano
Satisfaction with life and food-related life in Ecuadorian older adults
Satisfacción con la vida y con la alimentación en adultos mayores ecuatorianos
Berta Schnettler1, Germán Lobos2, María del Carmen Lapo3, Cristian Adasme-Berríos4 and Clementina Hueche5
1Facultad de Ciencias Agropecuarias y Forestales. Universidad de La Frontera. Chile.
2Facultad de Economía y Negocios. Universidad de Talca. Chile.
3Universidad Católica de Santiago de Guayaquil. Ecuador.
4Facultad de Ciencias Sociales y Económicas. Universidad Católica del Maule. Talca, Chile.
5Centro de Excelencia en Psicología Económica y del Consumo. Universidad de La Frontera. Chile
ABSTRACT
Objective: To distinguish typologies of seniors according to their levels of satisfaction with life and food-related life, and to characterize them according to the importance assigned to family, health-related aspects, eating habits, nutritional status and sociodemographic characteristics.
Material and methods: A survey was administered to a non-probabilistic sample of 817 seniors aged 60 years and over, of both genders, resident in urban and rural zones of the province of Guayas, Ecuador. The instrument included: Satisfaction with Life Scale (SWLS), Satisfaction with Food-related Life (SWFL), the Health-related Quality of Life Index (HRQOL-4) and the Family Importance Scale (FIS). Eating habits, sociodemographic variables, approximate weight and height were asked about.
Results: A cluster analysis was used to distinguish three typologies that differed significantly in the scores on the SWLS, SWFL, FIS, number of days with mental health problems, self-perception of health status, body mass index, eating habits and zone of residence. Two typologies presented high levels of satisfaction with life and food-related life, although the variables associated with overall well-being and in the food domain were different in each typology.
Conclusions: The results suggest that high levels of satisfaction with life and food-related life in Ecuadorian seniors are associated with both healthful eating habits and having lunch in company, fewer mental health problems and greater importance assigned to family.
Key words: Satisfaction with life. Satisfaction with food-related life. Older adults. Eating habits. Health.
RESUMEN
Objetivo: distinguir tipologías de adultos mayores según sus niveles de satisfacción con la vida y con la alimentación, y caracterizarlas según la importancia asignada a la familia, aspectos relacionados a la salud, hábitos alimentarios, estado nutricional y características sociodemográficas.
Material y métodos: se aplicó un cuestionario a una muestra no probabilística de 817 adultos mayores de 60 años o más, de ambos sexos, residentes en zonas urbanas y rurales de la provincia de Guayas, Ecuador. El instrumento incluyó: Satisfaction with Life Scale (SWLS), Satisfaction with Food-related Life (SWFL), el Índice de Calidad de Vida Relativo a la Salud (ICVRS) y la Escala de Importancia de la Familia (FIS). Se consultaron hábitos alimentarios, variables sociodemográficas, peso y estatura aproximada.
Resultados: mediante análisis clúster se distinguieron tres tipologías que difirieron significativamente en los puntajes de la SWLS, SWFL, FIS, número de días con problemas de salud mental, autopercepción del estado de salud, índice de masa corporal, hábitos alimentarios y zona de residencia. Dos tipologías presentaron altos niveles de satisfacción con la vida y con la alimentación, aunque las variables asociadas al bienestar general y en el dominio de la alimentación fueron diferentes en cada tipología.
Conclusiones: los resultados sugieren que altos niveles de satisfacción con la vida y con la alimentación en adultos mayores ecuatorianos se asocian tanto con hábitos alimentarios saludables como con almorzar en compañía, menores problemas de salud mental y mayor importancia asignada a la familia.
Palabras clave: Satisfacción con la vida. Satisfacción con la alimentación. Adultos mayores. Hábitos alimentarios. Salud.
Introduction
Although multiple factors contribute to health status, nutrition is one of the major determinants of an elderly person's health (1,2) and successful aging (3). At the same time, among older people eating habits are affected by health status and biological changes shaped by aging (1,4). Different studies stress that seniors undergo a series of physiological and psychological changes that affect their eating process and nutritional status (1,3,5). For example, they are more quickly satiated, often suffer from olfactory dysfunction, are less sensitive to sensory-specific satiation (5) or may suffer appetite loss (1) among others, which may negatively affect their nutrient and energy intake (1,5). By contrast, a diet consistent with recommended dietary guidelines may be associated with superior nutritional status, functional ability (6), quality of life (6,7), and survival in seniors (7). Regarding psychological aspects, altered mental states such as depression, confusion and memory loss affect a large segment of the elderly population, limiting their ability to eat an adequate diet or enjoy it (8).
Seniors' quality of diet has also been related to their sociodemographic traits, like gender (1), marital status (1,4,9), education level (9), socioeconomic status (4) and zone of residence (10), among others. Likewise, it has been reported that the elderly are a heterogeneous group with important variations in their physical and mental health (11) and in their nutritional status (12).
Nevertheless, food is not only critical to seniors' physiological and psychological well-being, but also contributes to social quality of life (QoL) (3). The positive social aspects of eating are important pleasures of life (3), but mealtimes with company are beneficial to seniors from the physiological and psychological perspective, improving their QoL (13). Mahadevan et al. (14) suggest that mealtimes are much more than the opportunity to consume needed calories and nutrients; they are social experiences that also elicit feelings of comfort and security, and contribute to an overall sense of well-being, where the role of family (14,15) and friends is fundamental (14). Indeed, family can be considered a protective factor for aging well and an important resource for achieving high QoL and life satisfaction (LS) in seniors (2,16,17). By contrast, it has been reported among the elderly eating alone was linked to lower QoL, depression, a less varied diet (2), poor dietary behaviour, such as skipping meals, low vegetable and fruit intake, consuming less home-cooked food, and obesity (18). However, although there is a lot of evidence to indicate that family has a positive effect on different aspect of a senior's life, the importance that they themselves assign to having family and its relation to their well-being has been insufficiently studied (19).
Recent studies conducted in Europe, America and Asia support food as being one of the important life domains that affect a senior's LS, suggesting that satisfaction with food-related life is positively related to overall LS (10,15,20,21). In addition, this relationship is associated with few mental health problems and social aspects in the elderly (21). In this regard, it has been determined that satisfaction with life and food-related life are associated with family and social interaction around food, so that seniors are more satisfied with their lives and their food-related life to the extent that they can share meals with family more often (21,22). Nevertheless, previous studies with university students show that the relation between LS and satisfaction with food-related life is not homogeneous: there are groups with levels of overall high, average and low LS and satisfaction in the food domain that also differ in aspects related to health, eating habits and sociodemographic characteristics (23), which have not been studied in seniors.
Therefore, the main aim of this study was to distinguish types of older adults in Ecuador based on their level of life satisfaction and satisfaction with food-related life, and to characterize them by the importance assigned to family, health-related aspects, eating habits, nutritional status and sociodemographic characteristics. Population aging, initially experienced by the more developed countries, has recently become apparent in much of the developing world too (11). The proportion of seniors is projected to more than double worldwide over the next half century; however, it is noteworthy that the elderly population is growing at a faster rate in the less developed regions. In Ecuador the proportion of the population 60 years and over increased from 6.3% in 1990 to 8.7% in 2010 and is expected to increase to 26% by 2060, a country with little research into the health and well-being of older people (24).
Material and methods
PARTICIPANTS
A survey was administered to a sample of 817 seniors aged 60 years and over, of both genders, resident in urban and rural zones of the province of Guayas, Ecuador. A two-stage sampling was done, stratified by clusters with incidental subsampling and by networks (snowball sampling) within the cluster. Twenty-five cantons in the province of Guayas were used as strata, with proportional affixation to the size of the sample population. Within each canton the affixation was done by cluster, also proportionally to the size of the sample population. The stratum was ultimately defined as the intersection between commune and cluster. Gerontology centres were used as clusters. The gerontology centers within each stratum were selected by simple random sampling with the "random sample of cases" function in SPSS. The absolute maximum error expected from the results of the questionnaire was ± 5% for a 95% confidence level.
PROCEDURE
The seniors were contacted in gerontology centres and once they had agreed to participate, they were asked to sign an informed consent prior to application of the survey. Trained surveyors administered the questionnaires personally in March and July 2015. Prior to the application of the survey, the questionnaire was pre-tested with 10% of the survey sample. The preliminary test was done using the same method of addressing the participants as in the definitive survey. As the pre-test of the instrument was satisfactory, no changes were required in either the questionnaire or the interview procedure. The Institutional Research Board of the Universidad Católica de Santiago de Guayaquil approved the study.
INSTRUMENTS
The questionnaire included the following scales:
- The Satisfaction with Life Scale (SWLS; Diener et al. [25]) and the Satisfaction with Food-related Life (Health-related quality of life index -HRQOL-4-; Grunert et al. [20]). The SWLS is a 5-item scale to evaluate overall cognitive judgments about a person's own life. The SWFL is a similar scale that evaluates cognitive judgments on the person's food-related life. On each scale the respondents must indicate their degree of agreement with the statements using a 6-point Likert scale (1: disagree completely, 6: agree completely).
- HRQOL-4: Developed by Hennessy et al. (26), it consists of four items that explore the self-perception of health, recent physical health (physical illness and injuries), recent mental health (stress, depression and emotional issues) and recent limitations on activity (education, work or leisure).
This study used the Spanish versions of the SWLS, SWFL and HRQOL-4, which have shown good levels of internal consistency in a previous study with older adults in Chile (15).
Family Importance Scale (FIS; Burroughs and Rindfleisch [27]): This consists of seven items to assess the value a person places on having a family and spending time with them:
1. I can't imagine having a fully satisfying life without my family.
2. It is possible for me to be happy without being married.
3. I would not work longer hours if it interferes with family activities.
4. The rewards of raising a family are more important to me than anything else.
5. The needs of other family members are more important than my own needs.
6. My really important relationships are in the home.
7. The family evening meal is one of the most important activities of my day.
Respondents were asked to score each item using a 6-level Likert scale (1: disagree completely, 6: agree completely). The alpha for the scale was 0.73 (27). Two bilingual translators translated all the original items on the FIS from English to Spanish. Subsequently, a third bilingual translator back-translated the Spanish versions of the scales into English. Any differences were resolved by discussion, with all the translators agreeing on the final version of the scale.
The seniors were also asked about the frequency of consumption of eight food and drink groups. Then, they were asked about the frequency with which they eat breakfast, lunch and dinner in company. Classification questions were included to establish gender, age, area of residence, number of people in the home, marital status, and education level. Finally, their estimated weight and height were asked about to obtain their body mass index (BMI, kg/m2).
DATA ANALYSES
Given that the psychometric properties of the SWLS, SWFL and FIS have not previously been studied in older adults in Ecuador, an exploratory factor analysis (EFA) was used for each scale followed by a confirmatory factor analysis (CFA). Each analysis was done with 50% of the sample separately. The EFA was implemented using SPSS 16.0 and the CFA using LISREL 8.8. The parameters were estimated by robust maximum likelihood. The convergent validity was found by inspecting the significance of the t values of the factor loadings for each factor (28). A CFA model fits reasonably well if the goodness-of-fit index (GFI) and the adjusted goodness-of-fit index (AGFI) are greater than 0.90, and if the root mean square error of approximation (RMSEA) is lower than 0.08 (28).
To distinguish senior types based on SWLS and SWFL scores, a cluster analysis (hierarchical conglomerates) was used, with linkage by Ward's method and the squared Euclidian distance as the measure of similarity between objects. The number of groups was obtained by the percentage change of the recomposed conglomeration coefficients. To describe the types, Pearson's Chi-square test was applied to the discrete variables and a one-factor analysis of variance for the continuous variables. Because Levene's test indicated non-homogeneous variances, the averages of variables with significant differences (p ≤ 0.001 or p ≤ 0.05) were separated according to Dunnett's T3 test for multiple comparisons.
Results
The mean age of the sample was 73.7 years (SD = 7.4), 52.5% were men. The average number of people in the home was 3.57 (SD = 2.05). The highest proportion indicated being married (45.5%) or widowed (31.5%). 50.1% live in an urban zone. Participants with elementary (53.1%) and secondary (20.6%) education predominated. The average BMI of the sample was 25.5 k/m2 (SD = 4.7).
Most of the seniors eat bread (38.7, 29.4%, respectively), meat (31.1, 49.0%), milk and dairy products (47.7, 32.1%), fruits (60.2, 27.5%), vegetables (70.9, 20.4%) and soft drinks (48.6, 15.5%) daily or twice or three times a week. Cereals and pasta (37.1, 22.2%) and fish (39.5, 29.6%) are consumed in greater proportion twice or three times a week or once a week. The highest proportion of respondents eats breakfast, lunch and dinner in company on a daily basis (76.6, 74.9 and 76.1%, respectively).
In this study the Cronbach's α of three (items measuring recent physical health, recent mental health, and recent limitations on activity) of the four items of the HRQOL-4 was 0.868. In the first question from the HRQOL-4, most seniors perceived their health as fair (45.8%) or good (34.0%). The average number of days with physical health-related problems in the last month was 5.78 (SD = 8.73), the average with mental health problems was 4.75 days (SD = 7.88) and the average number of days in which they could not carry out their usual activities due to health problems was 4.95 (SD = 8.23).
Using an EFA one factor was detected on the SWLS that grouped the 5 items (63.3% explained variance), showing a good level of internal consistency (Cronbach's α: 0.838). The CFA showed that the one-dimensional structure of the SWLS could be validated in seniors with an acceptable goodness-of-fit (RMSEA = 0.070, GF I = 0.99, AGFI = 0.96). Likewise, one factor was detected on the SWFL that grouped the 5 items (63.6% explained variance), showing a good level of internal consistency (Cronbach's α: 0.854). The CFA performed meant that the one-dimensional structure of the SWFL could be validated with an acceptable goodness-of-fit (RMSEA = 0.063, GFI = 0.99, AGFI = 0.97). The standardized factor loadings ranged from 0.43 to 0.86 in the SWLS and ranged from 0.59 to 0.85 in the SWFL. All the factor loadings from the SWLS and SWFL were statistically significant; therefore, there is convergent validity on both scales. In this study the mean SWLS score of all participants was 21.73 (SD = 4.05; range = 8-30). The mean SWFL score of all participants was 23.41 (SD = 3.98; range = 7-30).
Using an EFA only one factor was detected on the FIS that grouped four of the seven original items (60.3% explained variance). Items 1, 2, and 3 were eliminated because they presented communality values below 0.4. For the four remaining items, the FIS presented a good level of internal consistency (Cronbach's α: 0.801) and higher than that reported with the 7 original items (27). The CFA performed with the four items of the FIS meant that its one-dimensional structure could be validated in older adults in Ecuador with an acceptable goodness-of-fit (RMSEA = 0.074, GFI = 0.99, AGFI = 0.97). The standardized factor loadings for the four items ranged from 0.58 to 0.86 and were statistically significant; therefore, there is convergent validity. In this study the mean FIS score of all participants was 19.85 (SD = 3.70; range = 4-24).
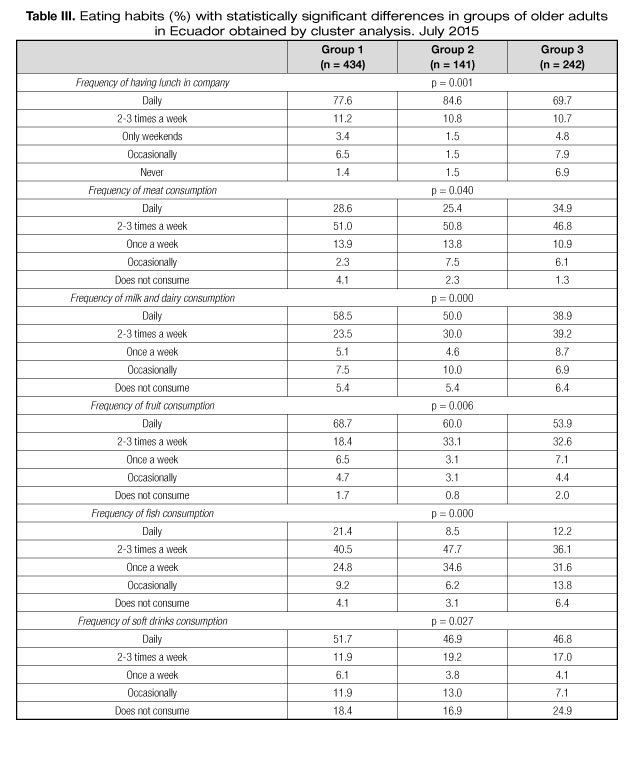
Using a cluster analysis, three senior types were detected with significant differences in the SWLS and SWFL scores (p ≤ 0.001). The types also differed in FIS scores, BMI (p ≤ 0.001) and number of days with mental health problems (p ≤ 0.05) (Table I). The types differed significantly in the area of residence and in the self-perception of health (p ≤ 0.001) (Table II). They also differed in the frequency with which the person had lunch in company and the frequency of consumption of milk and dairy products, fish (p ≤ 0.001), meat, fruits and soft drinks (p ≤ 0.05) (Table III).


GROUP 1: "SATISFIED WITH THEIR LIFE AND THEIR FOOD-RELATED LIFE" (53.1%)
Participants in this group had intermediate scores on the SWLS, SWFL and FIS. This group had the fewest number of days affected with mental health problems (Table I). This group had a greater proportion of respondents living in an urban zone (57.8%) and with a very good (22.8%) or excellent (5.4%) health self-perception (Table II). Group 1 had a higher proportion of seniors who do not consume meat (4.1%) and who consume milk and dairy products (58.5%), fruits (68.7%) and fish (21.4%) daily (Table III).
GROUP 2: "EXTREMELY SATISFIED WITH THEIR LIFE AND THEIR FOOD-RELATED LIFE" (17.3%)
This group scored significantly higher than the others in the SWLS, SWFL and FIS (Table I). Group 2 had the highest BMI although it did not differ statistically from group 1 (Table I). Group 2 was comprised mainly of seniors who eat lunch daily in company (84.6%) and who eat fish twice or three times a week (47.7%) (Table III).
GROUP 3: "MODERATERY SATISFIED WITH THEIR LIFE AND THEIR FOOD-RELATED LIFE" (29.6%)
This group scored significantly lower than the others in SWLS, SWFL, FIS and BMI. Group 3 had by far the highest number of days with mental health problems (Table I). This group was composed of a higher proportion who lives in a rural zone (54.7%) and who have a very poor (4.3%) or fair (56.0%) health self-perception (Table II). Group 3 had a greater proportion of seniors who never have lunch in company (6.9%), consume meat daily (34.9%), fish occasionally (13.8%), milk and dairy products twice or three times a week (39.2%) and who do not consume soft drinks (24.9%) (Table III).
Discussion
This study is the first to relate LS and satisfaction with food-related life in seniors in Ecuador. Three types of senior were distinguished with significant differences in their levels of overall LS and satisfaction with food-related life. This result agrees partially with that obtained by Schnettler et al. (23) in Chilean university students, where they distinguished types with high, medium and low levels in the same variables. However, in this study two types were distinguished with high levels of LS and satisfaction with food-related life (group 1 and 2, 70.4% together) and one type with a medium level (group 3). Although there may be cultural differences, it is possible that the higher level of general well-being and in the food domain in the sample is age-related. Indeed, some authors have concluded that LS is age-sensitive (29) and increases with age (30). Increasing LS in older people has been attributed to changes in self-perception and personal adjustments to their established goals (31), which could be applied to satisfaction with food-related life. Nevertheless, considering that some authors have found that in Latin America well-being appears to decrease with age (32) and others have reported in Chile an inverse U-shaped relationship between subjective well-being and age with an inflection point at 77.5 years (15), new research will be needed to compare the levels of LS and satisfaction with food-related life in samples of similar age in different Latin American countries.
Notwithstanding the above, the characteristics of the three types confirm that seniors are a heterogeneous group in terms of mental health (11) and nutritional status (12). The greater number of days with mental health problems and the lower level of LS and satisfaction with food-related life in group 3 are consistent with the data obtained by Enkvist et al. (33) in Sweden and by Seo et al. (21) in Korea. With a sample aged 78-98 years old, Enkvist et al. (33) found that depression was associated with lower LS. With a sample aged 65 and over Seo et al. (21) found that the elderly with a lower satisfaction with food-related life generally reported higher levels of depression. Although in this study the kind of mental health problem was not investigated, which is a limitation, mental health problems like depression are an important factor that affect food intake in the elderly (8) and may affect their level of satisfaction with food-related life. One notable result is the agreement between the number of days with mental health problems and self-perception of health in groups 1 and 3. This is consistent with results obtained in Costa Rica, where seniors with good self-rated health tend to be less likely to suffer from mental health problems (34). Also, it is consistent with the positive relation between perceived health and subjective well-being reported in seniors in Angola, Brazil, England and Portugal (17).
Following the dietary recommendations for older adults in Ecuador (35), group 1 had a greater proportion of seniors that fulfils the recommendation of daily consumption of milk and dairy, fruit and fish, and a greater proportion that does not consume meat, in contrast to group 3. This group also presented a high proportion of seniors who consume meat daily, contravening the recommendations that indicate its occasional consumption (35), although it stands out for the greater proportion of seniors who do not consume soft drinks. Therefore, group 1's eating habits are healthier and adhere more to the dietary recommendations than group 3, which is in line with the high and medium level of LS in each group (6). Likewise, the eating habits of these groups are consistent with their levels of satisfaction with food-related life. Studies with university students (23) and seniors (10) indicate that higher levels of satisfaction with food-related life are linked to more healthful eating habits. Despite the above, group 3 registered the lowest average BMI and was the only one in the normal weight range, contrary to evidence linking dietary behaviour with obesity (18). This could be related to the greater proportion of seniors of this type who never have lunch in company. Eating alone has been linked to underweight in older adults, whereas energy intake from a meal was reported to be higher in people who eat with others, because in this situation people may have greater exposure to food and are more likely to eat more than they require (18).
Although the differences in the levels of LS and satisfaction with food-related life of groups 1 and 3 are related to their eating habits and the quality of their diet, this is not the case for group 2. However, the high levels of satisfaction with life and with food-related life in group 2 may be related to the greater proportion of seniors of this type who have lunch daily in company. This agrees with studies that indicate that meals in company improve QoL and LS in seniors (3,13-15). Likewise, it agrees with the results of previous studies in Korea that reported that the elderly who had company during a meal showed higher LS and satisfaction with their food-related life (21). Seo et al. (21) and Dean et al. (22) associated this high satisfaction with the social and family support received on these occasions. But it is also possible that there may be a connection to the hedonic pleasure associated with meals in company (3). Additionally, the characteristics of group 3 agree with studies that indicate that eating alone is linked to lower QoL, depression (2) and poor dietary behaviour (18). One noteworthy result is the agreement between the levels of overall LS, satisfaction with food-related life and the importance the seniors in all three types assign to having a family and spending time with them. Although there is evidence that indicates older adults consider contact with family members as very important for their well-being (19), family relationships are not always positive. Indeed, family can reduce well-being as a result of social pressure, conflict or stress (16). This could explain group 3's significantly lower score on the FIS and their lower levels of LS and satisfaction with food-related life. Therefore, it is possible to suggest that while family support and company promote satisfaction with life and with food-related life in Ecuadorian seniors, they also need to enjoy their family bonds.
Contrary to reports in the literature, the typologies did not differ according to gender, marital status or education level (1,4,9). However, the levels of LS in groups 1 and 3 are consistent with the results of a study that reported that seniors who live in an urban environment present a higher LS score than those living in rural settings (17). By contrast, the quality of the diet and the levels of satisfaction with food-related life of these types contradict the results obtained by Kim et al. (10) in Korea, in that the rural elderly were more satisfied with food-related life and had more balanced diets than the urban elderly. The latter may be associated with the living conditions in the countryside of both countries, and therefore new research of a transcultural nature is needed to delve more deeply into the relationship between subjective well-being, diet quality and zone of residence in seniors.
Therefore, high levels of LS and satisfaction with food-related life in Ecuadorian seniors are associated both with healthful eating habits and eating lunch in company, fewer mental health problems and greater importance assigned to family. These results can be used by the Ecuadorian authorities to develop programs and public policies than can help improve their elderly citizens' quality of life.
Limitations of this study include the non-probabilistic nature of the sample, as it was conducted in only one country and in one province in Ecuador, which does not allow generalization of the results. Also, all data were self-reported, thus responses may be affected by social desirability and recall or response bias. Another limitation of the study is that the questionnaire did not include questions to determine the socioeconomic status, to identify who the seniors live with or who they eat with when they do so in company. These aspects must be explored in future studies, and the main mental health problems that affect seniors must be identified.
Acknowledgements
These results belong to the Interdisciplinary Excellence Research Program on Healthy Ageing (PIEI-ES), the Comparative Analysis Project on the Quality of Life of Older Adults in Chile and Ecuador, SINDE, Universidad Católica de Santiago de Guayaquil and Fondecyt Project 1160005.
References
1. De Morais B, Oliveira C, Afonso M, et al. Nutritional risk of European elderly. Eur J Clin Nutr 2013;67:1215-9. [ Links ]
2. Kimura Y, Wada T, Okumiya K, et al. Eating alone among community-dwelling Japanese elderly: association with depression and food diversity. J Nutr Health Aging 2012;16(8):728-31. [ Links ]
3. Academic of Nutrition and Dietetics. Position of the Academy of Nutrition and Dietetics: Food and Nutrition for Older Adults: Promoting Health and Wellness. J Acad Nutr Diet 2012;112:1255-77. [ Links ]
4. Dunneram Y, Jeewon R. Determinants of eating habits among older adults. Prog Nutr 2015;17(4):274-83. [ Links ]
5. Nieuwenhuizen WF, Weenen H, Rigby P, et al. Older adults and patients in need of nutritional support: Review of current treatment options and factors influencing nutritional intake. Clin Nutr 2010;29:160-9. [ Links ]
6. Gopinath B, Russel J, Flood VM, et al. Adherence to dietary guidelines positively affects quality of life and functional status of older adults. J Acad Nutr Diet 2014;114:220-9. [ Links ]
7. Anderson AL, Harris TB, Tyla vs. ky FA, et al. Dietary patterns and survival in older adults. J Am Diet Assoc 2011;111:84-91. [ Links ]
8. Holmes S. Nutrition and eating difficulties in hospitalised older adults. Nurs Stand 2008;22:47-57. [ Links ]
9. Montejano-Lozoya R, Ferrer-Diego RM, Clemente-Marín G, et al. Estudio del riesgo nutricional en adultos mayores autónomos no institucionalizados. Nutr Hosp 2013;28(5):1438-46. [ Links ]
10. Kim Y, Seo S, Kwon O, et al. Comparison of dietary behaviour, food intake, and satisfaction with food-related life between the elderly living in urban and rural areas. Korean J of Nutr 2012;45:252-63. [ Links ]
11. Giacalone D, Wendin K, Kremer S, et al. Health and quality of life in an aging population-food and beyond. Food Qual Prefer 2016;47:166-70. [ Links ]
12. López-Contreras MJ, López MÁ, Canteras M, et al. Identification of different nutritional status groups in institutionalized elderly people by cluster analysis. Nutr Hosp 2014;29(3):602-10. [ Links ]
13. Locher JL, Yoels, WC, Maurer D, et al. Comfort foods: an exploratory journey into the social and emotional significance of food. Food Foodways 2006;13:273-97. [ Links ]
14. Mahadevan M, Hartwell HJ, Feldman CH, et al. Assisted-living elderly and the mealtime experience. J Hum Nutr Diet 2014;27(2):152-61. [ Links ]
15. Lobos G, Grunert KG, Bustamante M, et al. With health and good food, great life! Gender differences and happiness in Chilean rural older adults. Soc Indic Res 2016;127(2):865-85. [ Links ]
16. Moor N, de Graaf PM, Komter A. Family, welfare state generosity and the vulnerability of older adults: A cross-national study. J Aging Stud 2013;27(4):347-57. [ Links ]
17. Von Humboldt S, Leal I, Pimenta F. Sense of coherence, sociodemographic, lifestyle, and health-related factors in older adults' subjective well-being. Int J Gerontol 2015;9:15-9. [ Links ]
18. Tani Y, Kondo N, Takagi D, et al. Combined effects of eating alone and living alone on unhealthy dietary behaviors, obesity and underweight in older Japanese adults: Results of the JAGES. Appetite 2015;95:1-8. [ Links ]
19. Hsieh CM. Age and relative importance of major life domains. J Aging Stud 2015;19(4):503-12. [ Links ]
20. Grunert KG, Dean D, Raats M, et al. A measure of satisfaction with food-related life. Appetite 2007;49(2):486-93. [ Links ]
21. Seo S, Cho M, Kim Y, et al. The relationships among satisfaction with food-related life, depression, isolation, social support, and overall satisfaction of life in elderly South Koreans. J Korean Diet Assoc 2013;19:159-60. [ Links ]
22. Dean M, Grunert KG, Raats M, et al. Food in Later Life Team. The impact of personal resources and their goal relevance on satisfaction with food-related life among the elderly. Appetite 2008;50(2-3):308-15. [ Links ]
23. Schnettler B, Denegri M, Miranda H, et al. Hábitos alimentarios y bienestar subjetivo en estudiantes universitarios del sur de Chile. Nutr Hosp 2013;28(6):2221-8. [ Links ]
24. Guevara PE, Andrade FCD. Socioeconomic and lifestyle factors associated with chronic conditions among older adults in Ecuador. Rev Pan de Salud Publica 2015;38(3):226-32. [ Links ]
25. Diener E, Emmons RA, Larsen RJ, et al. The satisfaction with life scale. J Pers Assess 1985;49:71-5. [ Links ]
26. Hennessy C, Moriarty D, Zack M, et al. Measuring health-related quality of life for public health surveillance. Public Health Rep 1994;109:665-72. [ Links ]
27. Burroughs JE, Rindfleisch A. Materialism and well-being: A conflicting values perspective. J Consum Res 2002;29:348-70. [ Links ]
28. Lévy J-P, Varela J. Modelización con estructuras de covarianzas en ciencias sociales: temas esenciales, avanzados y aportaciones especiales. Madrid: Netbiblo; 2006. [ Links ]
29. Clench-Aas J, Bang R, Dalgard O, et al. Dimensionality and measurement invariance in the Satisfaction with Life Scale in Norway. Qual Life Res 2011;20:1307-17. [ Links ]
30. Agrawal J, Murthy P, Philip M, et al. Socio-demographic correlates of subjective well-being in urban India. Soc Indic Res 2011;101(3):419-34. [ Links ]
31. Diener E, Suh EM, Lucas RE, et al. Subjective well-being: Three decades of research. Psychol Bull 1999;125:276-02. [ Links ]
32. Steptoe A, Deaton A, Stone A. Psychological well-being, health and ageing. Lancet 2015;385:640-8. [ Links ]
33. Enkvist Å, Ekström H, Elmståhl S. What factors affect life satisfaction (LS) among the oldest-old? Arch Gerontol Geriatr 2012;54:140-5. [ Links ]
34. Reyes B, Rosero-Bixby L, Koivumaa-Honkanen H. Effects of self-rated health and self-rated economic situation on depressed mood via life satisfaction among older adults in Costa Rica. J Aging Health 2016;28(2):225-43. [ Links ]
35. Salud en altura. Alimentación del adulto mayor en Ecuador. Retrieved from: http://www.saluddealtura.com/todo-publico-salud/salud-nutricion-familia/nutricion/alimentacion-adulto-mayor/. [ Links ]
![]() Correspondence:
Correspondence:
Berta Schnettler Morales.
Universidad de La Frontera.
Casilla 54-D.
Francisco Salazar, 1145.
Temuco, Chile
e-mail: berta.schnettler@ufrontera.cl
Received: 12/05/2016
Accepted: 22/09/2016
