


 Custom services
 English (pdf)
 Article in xml format
 Article references
 Send this article by e-mail
 Cited by SciELO
  Cited by Google
  Similars in
SciELO
Similars in
SciELO  Similars in Google
 Permalink
INTRODUCTION
The global prevalence of obesity has increased to the point of representing a worldwide epidemic such that in 2015, approximately 2.3 billion people are considered overweight and 700 million are considered obese 1,2, corresponding to a 75% increase over ten years. In Europe 3, the prevalence of obesity has increased three-fold over the last two decades, and excess weight and obesity have also increased significantly in Brazil with 50.8% of all Brazilians considered overweight and 17.5% as obese 4. In the United States, more than 97 million people in the United States are overweight or obese (approximately 50% of the population) and this number continues to increase 5. Yet, it is still unclear how to best detect excess body fat and classify people as overweight or obese in terms of body composition. Such indices are essential for the assessment of nutritional status in a population since an early diagnosis of obesity would permit the adoption of some measures for the prevention of comorbidities associated with obesity such as type 2 diabetes mellitus and cardiovascular diseases. Therefore, the focus of this study was to compare various indices of body mass and body composition in a sample of adults in Brazil.
The body mass index (BMI), proposed by Quetelet in 1835, has been adopted worldwide as a tool for the classification of obesity by the World Health Organization since 1997. However, today we know that the BMI has important limitations, being a relatively weak indicator of body fat which does not discriminate the location of adiposity 6. In order to overcome the limitations of the BMI, other indices have been currently proposed such as the BAI (body adiposity index), BAIFels (Body Adiposity Index for the Fels Longitudinal Study sample) and BMIfat (BMI corrected for fat mass). In 2011, Mialich et al. formulated the BMIfat, which proved to be able to overcome the limitations of the BMI by including weight, height and percent fat mass in its calculation 7. The index, which expanded the diagnostic capacity of the classical BMI, was later tested in a sample to 500 Brazilian individuals 8.
The body adiposity index (BAI) was created by Bergman et al. (2011) for Mexican-American individuals and its variables are hip circumference and height 9. However, some authors who tested the use of the BAI suggested that it overestimates body fat in men and underestimates it in women. Thus, Johnson et al. in 2012 adjusted the BAI in a study of 626 European-American adults and created the BAIFels 10. Since these new indices have only recently appeared in the literature, further comparative studies are needed to determine which one best reflects and diagnoses adiposity in a given population. Thus, the objective of the present study was to compare these indices in the Brazilian population, an original and fundamental proposal in order to assess the behavior, diagnostic acuity, possible limitations and refinement of each method.
MATERIALS AND METHODS
SUBJECTS
Participants in this study included 501 adults of both genders (female/male = 387/114), consisting of patients and their accompanying persons, employees of the University Hospital, Ribeirao Preto Medical School, University of São Paulo (USP), and university students enrolled in the undergraduate courses of USP on the Ribeirao Preto campus. Exclusion criteria were age of less than 17 years, subjects with amputated or immobilized limbs, unable to walk, bedridden, having edema and/or ascites and receiving intravenous hydration, procedures that would impair the measurements. Also excluded were individuals wearing a heart pacemaker, an aneurysm clip, metal implants of any type (metal wire, plate or screw), and patients isolated from contact. Participation was on a volunteer basis and each individual was evaluated only once during the study by a group of trained examiners. The study was approved by the Research Ethics Committee and all subjects gave written informed consent to participate (Protocol nº 1955/2010).
ANTHROPOMETRIC ASSESSMENT
Each subject underwent standard anthropometric measurements such as weight, height and arm, waist and hip circumference and tested for body composition by biolelectrical impedance (BAI) in triplicate by the same examiner. Weight was measured with a BC-558 Ironman Segmental Body Composition Monitor electronic scale (Tanita Corp., Tokyo, Japan), with maximum capacity of 150 kg and precision of 0.01 kg, with the subjects barefoot, wearing light clothing and no accessories. Height was measured with a 2 meter anthropometer, with the subject standing erect and barefoot, with his neck and head aligned with the trunk 11. The circumferences were measured with an inextensible metric tape with 0.1 cm divisions according to the anatomic points standardized by Lohman et al. (1988) 12.
ASSESSMENT OF BODY COMPOSITION
The BC-558 Ironman Segmental Body Composition Monitor (Tanita Corp., Tokyo, Japan) was used to assess body composition (fat mass, fat-free mass and body water). For the exam the subjects were barefoot and wore light clothing and care was taken to certify that their heels were correctly aligned with the electrodes of the measuring platform. The subjects were required to have fasted for at least 5 hours, not to have practiced vigorous physical activity during the last 12 hours, to have urinated 30 minutes before the beginning of the exam and to have abstained from alcoholic or caffeine-containing drinks for 24 hours before the exam. During the exam, the subjects held with their hands retractable levers that acted together with the foot electrodes forming a 90 ºC angle between the base of the electrode and the rod connecting it to the equipment. After this measurement, which lasted approximately 30 seconds, the display automatically showed the final result of the assessment of body composition.
ADIPOSITY INDICES
The body mass index (BMI) was determined as the ratio between current weight in kg and height in meters squared, i.e., BMI = weight/height2 6. Nutritional status was classified according to the cut-off points and the classification proposed by the WHO (WHO, 1998) as follows: BMI of less than 18.49 kg/m2, undernutrition; BMI between 18.5 and 24.9 kg/m2, normal weight; BMI between 25.0 and 29.9 kg/m2, overweight, BMI between 30.0 and 34.9 kg/m2, grade I obesity, BMI between 35.0 and 39.9 kg/m2, grade II obesity, and BMI above 40.0 kg/m2, grade III obesity. BMIfat (BMI adjusted for fat mass) proposed by Mialich et al. (2011) was calculated by the following equation: [(3 weight + 4 fat mass)/height], with weight as kg, fat mass as percentage (%), and height as meters (m). The ranges proposed by Mialich et al. (2014) were considered for the classification of nutritional status based on this adiposity index, as follows: 1.35 to 1.65, nutritional risk for undernutrition; > 1.65 to ≤ 2.0, normal weight, and > 2.0 obesity. The BAI, proposed by Bergman et al. (2011), was obtained from the ratio of hip circumference in cm to height in meters elevated to 1.5 minus 18: BAI = [(hip circumference)/((height)1.5) - 18]. The BAIFels (Body Adiposity Index for the Fels Longitudinal Study sample) developed by Johnson et al. (2012) was obtained using the BAI formula although with height elevated to 1.4 and the ratio product multiplied by 1.26, minus 32.85: [1.26 × (hip circumference)/height1.4) - 32.85]. The values proposed by the WHO were considered for both the BAI and BAIFels for the classification of obesity, i.e., 25% for men and 35% for women 13.
STATISTICAL ANALYSIS
Data are reported as mean and standard deviation and were compared by the Student t-test. Sensitivity, specificity, and predictive values with their respective 95%CI were calculated for the analysis of the diagnostic performance of the adiposity indices (BMI, BMIfat, BAI and BAIFels), and receiver operating characteristic (ROC) curves were constructed for the detection of the areas under the curve. The analyses were carried out using the SAS software version 9, with the level of significance set at p < 0.05.
RESULTS
The study was conducted on 501 volunteers, 114 (23%) males and 387 (77%) females. Mean age was 46.94 ± 14.22 years for men and 48.05 ± 14.40 years for women. Both weight and height values were significantly higher in men, i.e. 79.5 ± 16.14 kg and 172.86 ± 7.6 cm vs. 70.42 ± 16.62 kg and 159.0 ± 7.35 cm in women. As expected, mean fat-free mass (FFM) and total body water (TBW) were higher in men, with FFM values of 58.35 ± 9.45 kg for men and 42.34 ± 6.21 kg for women (p < 0.0001) and TBW values of 56.35 ± 6.15% for men and 47.56 ± 5.9 for women (p < 0.0001). In contrast, fat mass (FM) was higher in women, i.e., 35.14 ± 8.27% vs. 21.57 ± 7.3% for men. Except for age, BMI, arm circumference and waist circumference, all other variables differed significantly between men and women (p < 0.05). All of these data are presented in table I.
Table I Anthropometric and body composition characterization of the sample studied

BMI: body mass index; FFM: fat-free mass, FM: fat mass, TBW: total body water, AC: arm circumference, WC: waist circumference, HC: hip circumference.
*Data are reported as mean ± standard deviation and the p value was calculated by the Student t-test, with p < 0.05 indicating a significant difference between genders.
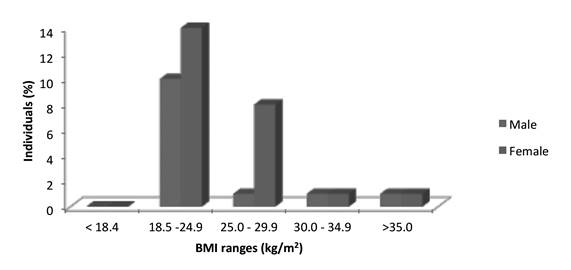
Regarding BMI, most individuals (about 33.33%) were classified as being of normal weight, approximately 3% as undernourished, 32.5% as overweight, 18.3% as grade I obese, and 12.4% as grade II obese. Data analysis according to gender revealed that males predominated in the overweight range, whereas females predominated in the more severe cases of obesity, as shown in figure 1.
The mean values for the adiposity indices were 27.47 ± 5.92 kg/m2 for BMI, 2.13 ± 0.49 for BMIfat, 31.60 ± 6.5% for BAI, and 32.74 ± 8.27% for BAIFels. When stratified according to gender, the mean values for men and women were 26.5 ± 4.5 kg/m2 and 27.76 ± 6.25 kg/m2 for BMI, 1.87 ± 0.38 and 2.21 ± 0.49 for BMIfat, 25.93 ± 4.4% and 33.27 ± 6.09% for BAI, and 25.62 ± 5.80% and 34.83 ± 7.9% for BAIFels, respectively.
Analysis of the mean values obtained after the calculation of the adiposity indices and considering their respective classification of nutritional status showed that both genders were classified as overweight by the BMI, men were classified as obese and women as normal weight by the BAI and BAIFels, and men were classified as normal weight and women as obese by the BMIfat, as shown in table II.
Table II Comparison of the values obtained by calculating the adiposity indices and their respective classifications of nutritional status according to gender
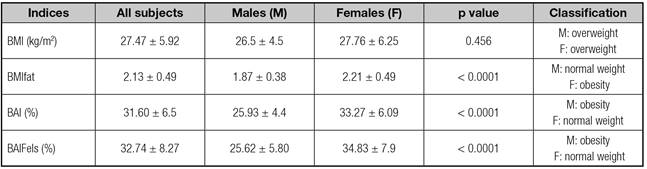
BMI: body mass index, BMIfat: body mass index adjusted for fat mass; BAI: body adiposity index; BMIfat: body mass index adjusted for fat mass; BAIFels: adiposity Index for the Fels Longitudinal Study sample; M: males, F: females.
*Data are reported as mean ± standard deviation and the p value was calculated by the Student t-test, with p < 0.05 indicating a significant difference between genders.
Comparison of the capacity for inclusion of the individuals of the present sample according to the cut-off points stipulated for each adiposity index for the classification of nutritional status, i.e., normal weight and excess weight, showed that normal weight of < 24.9 kg/m2 and excess weight above 25.0 kg/m2 were used for the BMI, while the values for BMIfat were > 1.65 and ≤ 2.0 for normal weight and more than 2.0 for excess weight. Finally, for BAI, BAIFels and FM determined by BIA we adopted the criterion proposed by the WHO (≥ 25% for men and ≥ 35% for women). The results showed that, according to the BMI, 29.0% of the males studied were of normal weight and 22.0% showed excess weight, while 33.3% of the women were of normal weight and 30.0% showed excess weight. The BMIfat classified 40.3% of the men as being of normal weight and 34.0% as having excess weight and 21.7% of the women as being of normal weight and 65.0% as having excess weight. The BAI classified 47.7% of the men as being of normal weight and 62.3% as having excess weight, and 65.6% of the women as being of normal weight and 34.4% as having excess weight. The BAIFels classified 44.7% of the men as being of normal weight and 55.3% as having excess weight and 56.0% of the women as being of normal weight and 44.0% as having excess weight. Finally, the BIA classified 64.0% of the men as being of normal weight and 36.0% as having excess weight and 53.0% of the women as being of normal weight and 47.0% as having excess weight. Table III lists these data in absolute values and as percentage of individuals classified as being of normal weight or as having excess weight for each adiposity index assessed.
Table III Classification of nutritional status according to adiposity indices and fat mass obtained by bioelectrical impedance

BMI: body mass index; BMIfat: body mass index adjusted for fat mass; BAI: body adiposity index; BAIFels: adiposity Index for the Fels Longitudinal Study sample; BIA: bioelectrical impedance; FM: fat mass; M: male; F: female.
Correlations between the adiposity indices and some of the anthropometric variables studied, including FFM and FM obtained by BIA and presented in table IV. BMI and BMIfat had a high correlation with weight (r = 0.86, p < 0.001 for BMI; r = 0.78, p < 0.001 for BMIfat), with waist circumference (r = 0.87, p < 0.001 for BMI; r = 0.84, p < 0.001 for BMIfat) and FM (r = 0.71, p < 0.001 for BMI; r = 0.89, p < 0.001 for BMIfat). All indices showed a low and inverse correlation with stature, while BAI (r = 0.98, p < 0.001) and BAIFels (r = 0.98, p < 0.001), as expected, showed high correlation coefficients with hip circumference and low coefficients with FM (r = 0.24, p < 0.001 for both indices).
Table IV Pearson correlations of the adiposity indices (BMI, BMIfat, BAI, BAIFels) with the variables weight (kg), height (cm), waist circumference (cm), hip circumference (cm), fat-free mass (kg), and fat mass (%)

BMI: body mass index; BMIfat: body mass index adjusted for fat mass; BAI: body adiposity index; BAIFels: adiposity Index for the Fels Longitudinal Study sample; WC: waist circumference; HC: hip circumference; FFM: fat-free mass; FM: fat mass.
Analysis of the ROC curves provides a description of discriminatory capacity of each index regarding the classification of obesity based on body fat (%) obtained by BIA. The area under the curve (AUC) for BMIfat was greater than that of all other indices for both men (93.1%) and women (97.8%) (Table V). The sequence of the more satisfactory AUC values was for BMI, BAIFels and BAI and was maintained for both genders. The ROC curves demonstrated that the cut-off point for BMI was 27.5 for men (BMI95% 76.3-91.1%), with 68.3% sensitivity and 86.3% specificity. Among women, the cut-off point for BMI was 27.0 (BMI95% 91.1-95.7%), with 83.3% sensitivity and 87.5% specificity. The cut-off point for BMIfat was 1.83 for men (BMI95% 88.7-97.5%), with 90.2% sensitivity and 84.9% specificity. Among women, the cut-off point for BMIfat was 2.18 (BMI95% 96.7-98.9%), with 90.6% sensitivity and 94.0% specificity. For the BAI, the cut-off point for men was 27.3 (BMI95% 69.7-87.6%), with 68.3% sensitivity and 84.9% specificity. Among women, the cut-off point for BAI was 32.89 (BMI95% 84.6-91.2%), with 75.4% sensitivity and 84.8% specificity. Finally, the cut-off point for BAIFels was 27.7 for men (BMI95% 70.7-88.2%), with 68.3% sensitivity and 84.9% specificity. Among women, the cut-off point for BAIFels was 34.4 (BMI95% 85.4-91.7%), with 74.9% sensitivity and 86.4% specificity.
Table V ROC curve analysis for the adiposity indices (BMI, BMIfat, BAI and BAIFels), area under the curve (AUC), standard error, sensitivity, specificity, confidence interval (95% CI), and cut-off point for each index for males and females, respectively

BMI: body mass index; BMIfat: body mass index adjusted for fat mass; BAI: body adiposity index; BAIFels: adiposity Index for the Fels Longitudinal Study sample.
DISCUSSION
In view of the global panorama marked by high rates of overweight/obesity in the population, it is essential the use of indices that measure and classify individuals in relation to their body composition for the early diagnosis of this overweight. Thus, this study proposes a comparison between the use of adiposity indices for the diagnosis of overweight, and the BMIfat highlighted with better correlation with the prediction of body fat, while BAI could not overcome the limitations of BMI this sample.
Our results for the distribution of individuals according to BMI ranges are compatible with data reported in the 2008-2009 Family Budget Survey (POF in the Portuguese acronym) which showed that overweight is greater among men and obesity among women, especially in cases of marked excess weight 14. When we compared the BMI to the remaining indices we observed that this was the tool that least included obese individuals in both genders, with a greater inclusion of females. These results confirm and reinforce the fact that the BMI has limitations due to its low diagnostic power for obesity. In this respect, some authors are already trying to refine this index by questioning the cut-off points used to classify obesity, even showing a tendency to reduce these points in different ethnic groups 15,16, including the Brazilian population 7,8.
López et al. (2012) detected similar strong correlation coefficients between BMI and body fat (r = 0.74; p < 0.001), weight (0.85; p < 0.001) and waist circumference (r = 0.85; p < 0.001) in a study conducted on 3200 Spanish individuals. In the same study, López et al. (2012) reported the correlations between BAI and height (r = -0.58; p < 0.001), weight (r = 0.22; p < 0.001) and waist circumference. The same tendency to a low and inverse correlation between BAI and height (r = -0.19; p < 0.001) and low correlation coefficients between BAI and weight (r = 0.12; p = 0.006) and waist circumference (r = 0.18; p < 0.001) were observed in the present study 17.
The results of the relationship between the adiposity indices (BMI, BMIfat, BAI and BAIFels) and body fat (%) determined by BIA and the ability to discriminate individuals with a high or low fat percentage of this study agree with data reported by others 17,19. López et al. (2012) reported AUC values of 0.920 and 0.877 for BMI and BAI, respectively, in Spanish women 17. In a study conducted on 302 Chinese men and women, Zhao et al. (2013) reported AUC values of 0.900 and 0.893 for BMI and BAI in women. In a study conducted on 2950 Korean women 18, Sung et al. (2014) detected AUC values of 0.908 and 0.868 for BMI and BAI, respectively 19. Considering male subjects, these studies also reported similar AUC values, i.e., 0.837 and 0.787 in the present study, 0.894 and 0.823 in the study by López et al. (2012), and 0.920 and 0.899 in the study by Zhao et al. (2013) for BMI and BAI, respectively 17,18.
The ROC curves also provide suggestions of cut-off points for these adiposity indices showing a tendency to reduce these values and other studies also reported similar results, Zhao et al. (2013) suggested similar values for IMC, i.e. 26.89 (89.7% sensitivity and 80.7% specificity) and 27.67 (77.6% sensitivity and 89.7% specificity) for men and women, respectively (18). López et al. (2012) reporting cut-off points of 27.0 for the BAI (69% sensitivity and 79% specificity) and of 32.0 (79% sensitivity and 86% specificity), and Zhao et al. (2013) reporting 27.8 (87.2% sensitivity and 81.7% specificity) and 36.0 (76.1% sensitivity and 90.8% specificity), both for men and women, respectively 17,18.
The BMIfat and BAIFels indices were included in the present study, with BMIfat showing the highest AUC values, 0.931 and 0.978, while BAIFels values were 0.795 and 0.886 for men and women, respectively. Previous studies were strictly limited to evaluation of the relationship between BMI and BAI only 10,17,20. The main findings of the present study are:
- Analysis by Pearson correlation showed that the correlation coefficients of BMIfat and BMI with total body fat were higher than those of BAI and BAIFels with body fat.
- ROC curve analysis showed that the AUC for BMIfat was greater than that of the remaining indices, suggesting that the discriminatory capacity of BMIfat is superior to that of the other indices studied.
When BMI and BAI are considered exclusively, it can be seen that the BMI yielded more satisfactory results for the prediction of body fat. Some investigators have observed that the BMI had a similar or better diagnostic capacity than the BAI for the estimate of adiposity 17,20-24, while others have reported controversial findings 10,25,26,27. The present study does not support the findings of Bergman et al. (2011) who stated that the BAI is superior to the BMI for the estimate of body fat. In addition to the possible effect of the different samples sizes of the various studies, the discrepancy among results may be due to two major differences: first, differences between the methods adopted for the assessment of body composition may influence the BMI/BAI ratio and its corresponding body weight value. Bergman et al. (2011) used DXA, while López et al. (2012) and the present study adopted the BIA method, Geliebter et al. (2013) used plethysmography, and Zhao et al. (2013) used anthropometry (skin folds). Second, different ethnic groups were evaluated in these validation studies and it has been reported that obesity and body composition differ between these groups 28.
Among the limitations of the present study, we point out that caution is recommended in extrapolating these results to different ethnic groups since the sample of the Brazilian population studied here is not representative of the general population despite the significant miscegenation of the Brazilian population, characterized by wide ethnic and racial diversity.
Also, the use of biolelectrical impedance for the assessment of body fat has been considered a valid alternative such as easy application, absence of radiation and a relatively low cost and this method has been validated against reference methods 29. Previous studies have shown that impedance bioelectrical can be used as a reference measure of adiposity and results obtained are similar to the ones obtained using DXA as standard measure 17,30,31. In addition to the technical ones, biolelectrical impedance and DXA show other important differences: bioelectrical impedance is absolutely harmless and is much cheaper than DXA and it can be a viable alternative for the measurement of fat mass, especially in large populations.
In conclusion, the present findings suggest that BMIfat is the index best related to the prediction of body fat, whereas the BAI, despite its great repercussions in the scientific literature, did not overcome the limitations of the BMI. The different behavior of the indices between men and women may suggest a different capacity to discriminate individuals with greater or lower percentages of body fat. Future studies by our group will seek to expand this work by adopting gold standard methods such as the DXA. Finally, it is necessary to extend the investigation of the validity of adiposity indices to various ethnic groups in order to facilitate the introduction of still poorly explored indices such as the BMIfat, BAI and BAIFels in clinical practice and in research as predictors of morbidity and mortality.

