


 Custom services
 English (pdf)
 Article in xml format
 Article references
 Send this article by e-mail
 Cited by SciELO
  Cited by Google
  Similars in
SciELO
Similars in
SciELO  Similars in Google
 Permalink
INTRODUCTION
Carotenoids are natural pigments widely distributed in nature, and esential to the human body, which depends on diet to obtain them. They exert a variety of functions and physiological actions, the most widely known of which is the provitamin A activity of some of them (mostly β-carotene, α-carotene and β-cryptoxanthin) 1,2. Moreover, carotenoids posess other important activities relevant for human health as antioxidants, enhancing the immune system, and photoprotection of structures such as epitelial and ocular tissues 3. The non-provitamin A carotenoids most frequently studied in terms of the relationship between diet and health are lutein, zeaxanthin and lycopene. Together with the provitamin A carotenoids and other bioactive compounds, they are partly responsible for the protective role in human health that is associated with the consumption of fruits and vegetables 3,4. Lutein and zeaxanthin are concentrated in retina and protect the photoreceptor cell layer from light damage by filtering blue light and acting as scavengers of radical oxygen species 5. High levels of carotenoids in the intake or in tissues are generally associated with a reduction in the risk of several chronic diseases such as cardiovascular, age-related macular degeneration, among others 3,6. Some carotenoids accumulate in certain tissues, such as lutein and zeaxanthin in retina 6 or lycopene in prostate 7, where they can carry out specific actions 8,9. The increase in the number of human studies involving these compounds in recent decades 3,10 highlights the importance of the knowledge of the contents of individual carotenoids in foods and in human tissues.
Vitamin A is also obtained through the diet, either as preformed vitamin A (retinol) in animal products or as provitamin A carotenoids 2. Vitamin A is involved in the visual system, maintenance of epitelial integrity and immunitiy, among other roles and its deficienty is the leading cause of preventable blindness in children and increases the risk of disease and death from severe infections. Vitamin A deficiency has been identified by means of biochemical and dietary markers as a public health problem especially in lower income countries 11. In Dominican Republic, it is identified as one of the micronutrient deficiences 12 mainly from data surveys on vitamin A status and intake in children and in pregnant women and nursing mothers 12,13. However, there is limited information on vitamin status or intake in the Dominican population and, to our knowledge, the most recent study is that resulting from a household budget survey (2006-2007) that showed a moderate consumption of vitamin A, which is more concerning in poorer populations 14. That report supplied information on vitamin A intake as a whole, but not about its individual components (retinol and individual provitamin A carotenoids), an aspect that is of great interest for issuing dietary recommendations in the public health area to avoid their deficiency.
On the other hand, an important percentage of the adult population in the Dominican Republic is overweight (55%) or obese (22%) 15. Adipose tissue is an important site of retinol 16 and carotenoid 17 storage, and obesity can modify the status of these compounds (e.g. of lutein and zeaxanthin) 18. On the other hand, there is evidence suggesting that deficiences of some micronutrients are related to obesity and fat deposition 19 and some of them may increase the risk of the latter and thus, of obesity and related diseases 20. In particular, in the Caribbean region, a high body mass index and low fruit and vegetable intake are important risk factors for the global burden of disease 21.
The aim of this study was to assess the individual components of vitamin A intake (retinol, α-carotene, β-carotene and β-cryptoxanthin) and that of other relevant dietary carotenoids, such as lutein, zeaxanthin and lycopene, in overweight and obese inhabitants of the Dominican Republic, from the diet as a whole, from the intake of fruits and vegetables, as the major contributors to their dietary intake, and from foods plants grouped according to color.
SUBJECTS
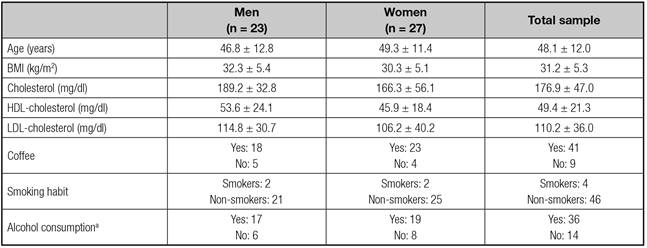
Fifty subjects (23 men and 27 women), ranging in age between 22-69 years old were selected from upper middle class patients who asked for dietary assessment to reduce body weight. Their overall body mass index (BMI) was 31.2 ± 5.3 kg/m2. There were 25 overweight individual (BMI: 25-29.9 kg/m2) and 25 obese patients (BMI: > 30 kg/m2; four of the latter had a BMI between 40-42 kg/m2). Some patients required medication for hypertension (n = 13) and hyperlipemia (n = 6). The characteristics of the subjects are shown in table I. The physical activity of most of the patients was of light or moderate intensity (12 men, 17 women and 8 men, 9 women, respectively); it was vigorous in only four patients (3 men). Ethics approval was considered no required as the dietary intake assessment is widely used in the clinical practice. All 50 gave their written informed consent after receiving oral information about the study.
DIETARY INTAKE ASSESSMENT
Recent dietary intake was evaluated using three 24 h diet recalls, one of which coincided with a weekend or holiday, carried out within a period of 7 to 10 days. Although dietary assessment was focused on individual carotenoid intake, general information about the frequency of intake of fruits (raw, cooked, in syrup), vegetables (raw, garnish, main course), legumes, fish, eggs and oils, was obtained by means of a food frequency questionnaire. For the first recall, the participants underwent a face-to-face encounter with a specialized interviewer, the same person who, subsequently, performed the other two recalls by telephone or chat (to supply images). The amounts consumed were estimated from the weights of the portions described by the patients (in most cases by means of images), of the raw or cooked food depending on how it was to be consumed. The amounts of cooked pasta, rice and legumes were transformed into raw weight utilizing established conversion factors, dividing by 4 the amounts of legumes and rice and by 5 that of pasta 22. On the basis of this information, we calculated food intake in grams/day, which served as the basis for the determination of nutrients intake. The data on the foods and amounts consumed were introduced into two different software applications, one to calculate
preformed retinol, macronutrients (carbohydrates, proteins, lipids), cholesterol, saturated fatty acids (SFA), monounsaturated and poliinsaturated fatty acids (MUFA, PUFA) and energy intake (DIAL(r)) 23, with data from a food composition table widely used in Spain 22 and, the other, a specific software application for the assessment of carotenoid intakes 24 that includes a carotenoid database developed by our group 25, that enables us to assess the carotenoid intake from foods grouped according to their color (white/yellow, green and red/ orange). The carotenoid database used comprises information on the major dietary carotenoids present in foods, with data generated entirely by high-performance liquid chromatography (HPLC) 25-27 using an analytical procedure that is considered to be highly acceptable 28. The food groups included in the software are: fruit and vegetables, oils and fats, snacks, nonalcoholic beverages, milk and dairy products, eggs and egg products, sauces, herbs and spices. However, some of the foods consumed during the study by Dominican participants were similar but not equal to those included in the carotenoid database used. In those cases, the carotenoid composition was considered to be that of similar foods included in the carotenoid database. The assumptions made for carotenoid intake calculations were as follows (the name in the carotenoid database in brackets): tomato bugalú o barcelo (Canary island and salad tomato -mean value), ají cubanela (green pepper), lechosa (papaya), guandul or arvejas (peas), vainitas (green beans), sweet lemon (lemon), chinola (passion fruit), toronja (rose grapefruit), auyama (round and oblong shape pumpkin), guineo or guineíto (Canary Island banana) and plátano (plantain or cooking plantain; carotenoid data from Enrique Murillo, University of Panamá, unpublished data: 884 µg β-carotene/100 g, 626 µg α-carotene/100 g and 95 µg lutein/100 g), lettuce repollada (lettuce type iceberg), lettuce romana and sweet lettuce (romaine /leaf type lettuce).
The food contribution to the vitamin A intake (µg/day) is expressed as retinol equivalents (RE) = retinol + (β-carotene/6) + (α-carotene/12) + (β-cryptoxanthin/12) 22,29 and as retinol activity equivalents (RAE) = retinol + (β-carotene/12) + (α-carotene/24) + (β-cryptoxanthin/24) 2.
STATISTICAL ANALYSIS
Data are expressed as the mean and standard deviation (for characteristics of subjects and macronutrients and energy intake) or standard error (for carotenoids and vitamin A intake), median and 95% confidence interval. The normal distribution of the data from the whole diet was assessed (Kolmogorov-Smirnov test) and individual carotenoid intake did not follow a normal distribution (except for α-carotene), nor did retinol intake in men. To compare results according sex, Student's t-test was used to compare macronutrients and energy intake and the Willcoxon test was used for carotenoid and cholesterol dietary intakes. SPSS v.22 (SPSS Inc., Chicago, IL, USA) software package was used for all statistical calculations.
RESULTS
The subjects included in this study showed no significant sex-related differences in their age, blood lipids, smoking habit, alcohol and coffee consumption or level of physical activity (Table I). Table II shows the concentrations of protein, carbohydrates and fiber, fat and saturated fatty acids (SFA), monounsaturated fatty and polyunsaturated fatty acids (MUFA, PUFA) and dietary cholesterol and energy intake of the sample as a whole and grouped according to sex, expressed as the mean and standard deviation. The energy, protein, fat and cholesterol intake were higher in men than in women. The contribution of carbohydrates, proteins and fat to the energy intake was 35.7%, 19.9% and 38.5%, respectively (the contribution of energy and alcoholic drinks and infusions were not assessed). The PUFA intake was lower than that of MUFA and SFA, in both sexes, and represented 5.75% of the fat intake, and those of MUFA and SFA represented 14.4% and 14%, respectively.
Table II Dietary intake of macronutrients and energy expressed as mean ± standard deviation
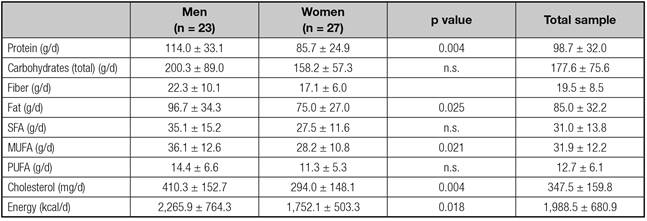
MUFA: monounsaturated fatty acids; PUFA: polyunsaturated fatty acids; SFA: saturated fatty acids. n.s: no significant difference.
The fruits most frequently consumed were lechosa (papaya), guineo (banana), pineapple and apple (red and green). The highest rate of consumption was between two and five times per week (24 out of 50 subjects). Ten subjects had a fruit consumption of 1 per week or less, and two subjects did not eat fruit. Among the vegetables: lettuce, tomato, onion and rocket were those most widely-consumed as raw items, with a maximun consumption of 1-2 times/day (24 out of 50 subjects; two participants ate no cooked vegetables); 20 subjects ate raw vegetables 2-5 times/week and 6 subjects had them once a week or less. Those consumed after cooking processes included broccoli, eggplant, carrot, green pepper, cauliflower and vainitas (green beans), with a consumption of 1-2 times/day (11 subjects), 2-4 times/week (28 subjects) and once a week or lower (11 subjects; and 4 participants ate no cooked vegetables). Egg consumption was of interest because of its contribution to lutein and zeaxanthin intake and eggs were eaten 2-6 times/week (29 out of 50 subjects) and once a week or less (16 subjects). Olive oil was the most frequently used oil for salads and, for cooking, the variety of oils employed was greater (olive, soya, canola and corn).
Regarding other foods in the diet of these subjects, there was a low consumption of fish (the highest consumption being once a week or less) (32 subjects, 13 of them never eat fish), and only 17 subjects preferred it 2-3 times/week. Salmon, gilthead bream, grouper, chillo (sea bream) and tuna were the most widely-consumed. Instead, legumes, mainly ckickpeas, guandules (peas), beans (red, white, black) and lentils were those most frequently eaten, with a consumption between 2-6 times/week in 32 subjects and only 11 subjects consumed them less than once per week.
The intake of the carotenoids: α-carotene, β-carotene, β-cryptoxanthin, lycopene, lutein and zeaxanthin and, that of preformed retinol and the vitamin A intake, expressed as retinol equivalents (RE) and retinol activity equivalents (RAE), are shown in table III. In this table, the lutein and zexanthin rows provide intake data of these two carotenids when they were determined separately (97 out of 124 foods included in the database used), and the lutein-zeaxanthin row shows their joint value as obtained from the literature (see database in reference 25); consequently, in some cases, the value for lutein plus zeaxanthin did not coincide with the sum of the concentration of each. The row for total lutein and zeaxanthin reports the total lutein and zeaxanthin intake. There were no significant differences in the intake of provitamin A carotenoids (α-carotene, β-carotene, β-cryptoxanthin) or non-provitamin A carotenoids (lycopene, lutein and zeaxanthin) between sexes, from total diet. Retinol intake was higher in men than in women but it did not reach statistical significance (p = 0.064).
Table III Dietary intake of carotenoids, retinol and vitamin A (μg/day) from total diet expressed as mean ± standard error, (median) and [95% confidence interval]

The dietary vitamin A intake in this group of subjects was supplied by preformed retinol in 40% and by provitamin A carotenoids in 60%. Fruits contributed less to the vitamin A intake than vegetables (19.2% and 39.2%, respectively). The total carotenoid intake in this subjects was 6,363.2 µg/day (mean), with something more than half being provitamin A carotenoids (3,570.4 µg/day, 56.1% of the total carotenoid intake). Of the provitamin A carotenoids, that consumed most widely was β-carotene (74.3%); the contribution of α-carotene and β-cryptoxanthin was quite lower (19.6% and 6%, respectively). The mean dietary intake of non-provitamin A carotenoids was 2,792.9 µg/day, which represented almost half of the total carotenoid intake (43.9%) and was supplied by lycopene and lutein plus zeaxanthin in similar percentages (52.3% and 47.7%, respectively).
Table IV shows the dietary intake of the individual carotenoids provided by fruits and vegetables, as major contributors to that ingestion, as well as that supplied from foods of plant origin grouped according their color (white-yellow, red-orange, green). Lutein, zeaxanthin, β-carotene and lycopene were mainly supplied by vegetables, and α-carotene and β-cryptoxanthin by fruits. Vegetables suppled 83.9% of lutein and 72.5% of zeaxanthin, and fruit provided 9.9% of lutein and 3.9% of zeaxanthin consumed in the total diet. Vegetables supplied 79.2% and 68.2% of total dietary lycopene and β-carotene intake. Fruits were greater contributors than vegetables to the dietary intake of α-carotene (60.2%) and β-cryptoxanthin (18.4%). Orange juice (natural and commercial) was the major contributor to the dietary β-criptoxanthin intake (72.2%).
Table IV Dietary intake of carotenoids from fruits and vegetables, and including other foods of plant origin grouped according to their color, expressed in μg/day. Data reported as mean ± standard error, (median), [95% CI]

Different superscript letters within rows means significant differences (p = 0,000 for all except p = 0,019 for α-carotene) in the fruits and vegetables group and in the foods of plants origin grouped according to their colors (p < 0.05, most of them p = 0.000).
Carotenoid intakes from food of plan origin, including fruits and vegetables, as well as others supplied by oils and fats, nonalcoholic beverages, milk and dairy products, eggs and sauces among others, are shown in table IV, grouped according to their color. Lutein intake was supplied mainly by foods of green color and, to a lesser extent, by those of white/yellow and red/orange color. Zeaxanthin was supplied in greater amounts by red/orange foods than by green or white/yellow. Red/orange foods were the only contributors to lycopene intake (some fruits like watermelon and rose grapefruit, vegetables like raw tomato, tomate sauces and juices). α-carotene intake came mainly from white/yellow foods and red/orange, with green foods being minor contributors. Greater contributors to β-carotene and β-criptoxhantin were red/orange foods, as compated to those white/yellow or green.
DISCUSSION
To our knowledge, the data on individual carotenoid intake presented in this study in overweight/obese subjects are the first data on carotenoid intake in the Dominican Republic. Although the contribution of provitamin A carotenoids is taken into account in studies assessing vitamin A intake in several population groups, mainly children and pregnant /nursing women, but with no information on the individual components 30,31.
The dietary intake of proteins and carbohydrates in the overweight and obese subjects included in this study widely exceeds the dietary reference intakes, mainly for proteins (96%, on average, for men and women) and, to a lesser extent for carbohydrates (37%, on average, for men and women) 32. When these patients went to consult their physician, they had limited their carbohydrate consumption to reduce weight, since that is the popular bilief to achieve this objective. They were also far from the acceptable macronutrient distribution range for fat intake, with a SFA contribution to the dietary energy intake higher than the 10% recommendation 32. In contrast, they met the dietary reference intakes for PUFA and nearly for fiber 32. A high percentage of energy from total dietary fat was also described by Saito et al. 33 in Dominican hospital workers of characteristics similar to those of the present study. The vitamin A intake in our subjects did not meet the recommended intake expressed in RAE (900 and 700 μg/d for men and women, respectively) (RDA in reference 2) and is in agreement with a recent analysis of dietary sufficiency in the Dominican Republic, based on the Survey of household income and expenses, that concluded it to be moderately inadequate for vitamin A, in all socioeconomic groups 14, although it is important to point out that, in this report, the contribution of provitamin A carotenoids to vitamin A intake was calculated in a manner not utilized by the World Health Organization (WHO)/Food and Agriculture Organization of the United nations (FAO) or the Institute of Medicine (USA) 2,29, since they do not consider carotenoid contribution in the bases of their chemical structure and/or bioavailability, but depending on the type of food; thus provitamin A carotenoids supplied by fruits and plant roots are divided by 12, and those provided by leafy green vegetables by 24. Therefore, that supplied by β-carotene is underestimated. -carotene and lutein are widely distributed in foods, from leafy green vegetables (e.g. cabbage, spinach and different varieties of lettuce), and whose importance will depend on the amount of these foods present in the diet.
In this study, vitamin A is supplied in a higher percentage by foods from plant sources (59%) than from animal sources (41%). These percentages are quite different from those obtained in the previously mentioned national survey, in which, more than 80% of vitamin A intake came from foods of plant origin (mainly fruits from the Musaceae family, due to their higher consumption and also, to the high content of α- and β-carotene content of plantain) and, the rest is supplied by foods from animal origin (mainly eggs and milk) and ready-to-eat foods 14. This difference can be attributed to the socioeconomic level of the participants, since those in the present study were from upper middle class and those in the national survey were representative of the population and, as the socioeconomic level increases, the availability of total vitamin A is greater, and the larger the proportion of vitamin A from animal sources, something that occurs in all developed countries (e.g. in Spain, 58% of animal origen) 34.
Fruits and vegetables, major sources of carotenoids and of provitamin A intake among populations 3, and in this study, vegetables make a higher contribution to vitamin A intake than fruits (37.7% vs. 18.5%), as is also observed in the Spanish (32.9% and 4.4% from vegetables and fruits, respectively) 34 and Brazilian populations (70.3% and 21.5% from vegetables and fruits, respectively) 35. Guineos (bananas) (Cavendish and Gross Michell) and plantain (Musa paradisiaca) were widely consumed, the first is mainly consumed raw and the second cooked. According to a report by Menchú et al. 14, bananas and plantain represent approximately 35% of the vitamin A intake, provided by fruits, regardless of the socioeconomic status. On the other hand, subjects included in the present study did not meet the Dietary Guidelines for Dominican Republic 36 for fruits (2-3 portions of fruits/day) and less than half of the sample met the recommended intake for vegetables (2 portions of vegetables/day), the maximm consumption for fruits was 2-5 times fruits/week and for vegetables, 1-2 times/day.
Of the provitamin A carotenoids, that for which the diet included most was β-carotene, with a consumption that is nearly four times higher than that of α-carotene; the latter is consumed in amounts that triplicate that of β-cryptoxanthin. The mean intake of α-carotene and β-carotene in this group of Dominican patients was much greater than that of the Spanish population (269.2 and 1458.9 μg/day, respectively) 34, and that observed in the United States (USA) (451 and 2,500 μg/d, respectively) 37. However, the consumption of β-cryptoxhantin in those subjects (215 µg/d), is lower than that of the Spanish population (322.4 μg/d) 34, but greater than that of the USA (82 μg/d) (37). β-cryptoxhantin intake from fruit and vegetables in these subjects is lower than that in the Brazilian population (59,8 vs. 126,2 µg/d), and that of α-carotene and β-carotene in this study (699,7 and 2538,8 μg/d, respectively), is much higher than that in the Brazilian population (162.6 and 917.5 μg/d, respectively) 35. The amount of β-carotene present in the total diet of these subjects represents more than 2.5 times the amount consumed of the other two provitamin-A carotenoids, as occurred in the Spanish 34. In this study, β-carotene is provided mainly by vegetables (68.1%); however, α-carotene and β-cryptoxanthin are mainly supplied by fruits (60.2% and 72%, respectively), orange juice being the major contributor to the β-cryptoxanthin intake. The greater contribution of α-carotene from fruits is due to the frequent consumption of foods with a high content, like the banana (guineo) and the avocado. However, in other populations with differerent dietary patterns, for example, the Spanish, α-carotene is mainly provided by vegetables (e.g. in Spain, 94.8%), although vegetables are also the major providers of β-carotene (84.5%) 34.
Concerning, non-provitamin A carotenoids, vegetables are the major contributors to the intake of lutein (83.9%), zeaxanthin (72.5%) and lycopene (79.2%). The dietary intake of lycopene in this study is quite lower than that reported in the populations from Spain (1,462 vs. 3,056 μg/d) 38 and from the USA (1,462 vs. 5,279 μg/d) 37. The total dietary intake of lutein and zeaxanthin is similar to that found in the Spanish population (1,331 vs. 1,235 μg/d) (38) and somewhat less than that reported in the USA (1,331 vs. 1,734 μg/d) (37). The intake of these carotenoids from the consumption of fruit and vegetables, with that in Brazilian population differs regarding lutein and lycopene, and are higher in this study than in the Brazilians (915.9 vs. 776 μg lutein/d and 1,419 vs. 656 μg lycopene/d), and is similar to that of zeaxanthin (52.3 vs. 56.9 μg/d, this study vs. the Brazilians, respectively) 35. There are no dietary reference intakes for any of the non-provitamin A carotenoids, but there are some suggestions of intake based on the decreased risk of some chronic diseases (i.e. age-related macular degeneration), mainly observed in epidemiological studies, as is, for instance, the recommendation of 6 mg lutein/day 8. This level is much higher than the lutein intake observed in this study.
Finally, as fruit and vegetables show a broad range of color (lycopene associated with red-colored foods, provitamin carotenoids with orange-colored foods and lutein and zeaxanthin with dark-green-colored foods), each of which is associated with different phytochemical profile and, thus, with different biological activities 39. Moreover, as the classification of fruit and vegetables according to the color of their edible portion is becoming increasingly common in recent years, especially for the establishment of public health dietary recommendations 40, we grouped the foods according to their color (white/yellow, green and red/ orange). The red /orange and white/ yellow fruit and vegetables were the major contributors to the provitamin A intake from fruit and vegetables in these subjects, and were much higher than that supplied by green-colored foods. In the Spanish population, provitamin A carotenoids are also supplied by red/orange fruit and vegetables, followed by green produce, with white/yellow foods being those that contributed the least to dietary intake 34, a difference that is due to the greater contribution of guineo (or banana) and plantain in the Dominican subjects. This also occurs in the Spanish population, in whom green fruit and vegetables are the main source of lutein plus zeaxanthin and, zeaxanthin is supplied mainly by red/orange fruit and vegetables 38.
Although, to determine the contribution of fruits and vegetables to the intake of each of the provitamin A carotenoids in the Dominican diet, it would be necessary to increase the sample size, because the subjects included in this study do not constitute a representative sample and because the dietary carotenoid intake did not show a homogeneus distribution. However, the data presented here is of great interest, since they are the first individualized data on carotenoid intake in Dominican subjects, and they contribute to improving the understanding of the relationship between diet and health. In short, the diet of these overweight/obese Dominican subjects, from the upper middle class, complied with the recommended vitamin A intake 2 when expressed as RE, but would be somewhat low when expressed as RAE, and were supplied in larger amounts by foods from plant rather than animal sources (59% vs. 41%, respectively), and mostly by red/orange and white/yellow foods. Vegetables were the major contributors to the non-provitamin A carotenoids and to the β-carotene intake, and fruits the major contributors to the intake of α-carotene and β-cryptoxanthin.

