


 Servicios personalizados
 Inglés (pdf)
 Articulo en XML
 Referencias del artículo
 Enviar articulo por email
 Citado por SciELO
  Citado por Google
  Similares en
SciELO
Similares en
SciELO  Similares en Google
 Permalink
INTRODUCTION
Prevalence of overweight and obesity in European children ranges between 10 and 40 percent among European adolescents 1, while obesity is currently considered as the fifth leading risk for global deaths 2. Aside genetics, inadequate lifestyle factors like unhealthy dietary habits and/or insufficient physical activity are the main attributable causes of both overweight and obesity 3. Childhood obesity has been shown to be accompanied by low micronutrient intake and micronutrient deficiencies 4. For instance, obesity has been related to low iron intake in children and adolescents in a study developed in Israel 5, where obese children and adolescents showed a higher prevalence of iron deficiency or even iron deficiency anemia than non-obese.
The body mass index (BMI) is the most widely used height-normalized index for the screening of excess body fat, also in adolescents, but it can be criticized since it does not discriminate between lean- and fat-mass 6. Measurement of skinfolds thickness allows an estimation of subcutaneous adipose tissue deposition and, thus, the use of the fat mass index (FMI = kg fat mass/m2) instead of the BMI for classifying obesity status in children 6. Obesity is often associated with hyperinsulinism and insulin resistance, which over time can develop into in glucose intolerance, impaired β-cell function and diabetes mellitus type 2 7.
Vitamin B12 is a crucial nutrient present in animal products 8. Its main roles are linked with the cognitive function, bone health, and deoxyribonucleic acid (DNA)-replication during periods of rapid growth and development like childhood and adolescence 9) (10. An optimal vitamin B12 status during early life stages is essential in preventing future health risks like anemia 9. Besides, vitamin B12 deficiency contributes to hyperhomocysteinemia, which is an independent risk factor for atherosclerotic disease 11. Sub-clinical deficiencies of vitamin B12 status are not uncommon during adolescence and in high risk population groups like vegans or vegetarians, elderly or low-resource people 12.
Low vitamin B12 status can be due to gut malabsorption syndromes, pernicious anemia 13, or secondary malabsorption produced by metformin therapy, an insulin sensitizer used for the treatment of type 2 diabetes and insulin resistance in adolescents 14) (15.
A recent paper based on the HELENA study reported levels of B-related vitamins, such as B6, folate and B12 16, in which 2% of studied adolescents had low plasma vitamin B12 and 5% had low holotranscobalamin (HoloTC) concentrations. Besides, low concentrations of both plasma folate (PF) and red blood cells (RBC-folate) were identified in 10% of the HELENA adolescents, and low pyridoxal-phosphate (PLP) concentrations were also identified in 5% of them.
A recent Australian study with obese adolescents 13 called for investigation of the associations between vitamin B12 status and insulin sensitivity, including also dietary intakes. Consequently, this study aims to assess whether adolescents with higher body mass index (BMI) or fat mass index (FMI), in combination with higher insulin sensitivity (high Homeostatic Model Assessment [HOMA] index) had also lower B-vitamins concentrations.
To our knowledge, this is the first study in European adolescents assessing the association between B-vitamins intake and concentrations and insulin sensitivity, considering indicators of body composition like BMI or FMI.
METHODS AND MATERIALS
The multicenter and cross-sectional study Healthy Lifestyle in Europe by Nutrition in Adolescence (HELENA-CSS) recruited adolescents aged 12.5-17.5 years, from ten cities from nine European countries: Athens and Heraklion, in Greece; Dortmund, in Germany; Ghent, in Belgium; Lille, in France; Pécs, in Hungary; Rome, in Italy; Stockholm, in Sweden; Vienna, in Austria; and Zaragoza, in Spain. The purpose of the study was to provide complete and reliable information about the nutritional status of European adolescents 17. Inclusion criteria were: not participating simultaneously in another clinical trial and being free of any acute infection occurring < one week before inclusion 18. The total number of participants was 3,528, with an average participation rate of 67%, which can be considered as acceptable for such a demanding epidemiological study 19. In one third of the sample in each study center (1,076 adolescents), blood drawing was obtained. Participants from Heraklion and Pécs (7% of the total sample) did not provide comparable dietary data. For the purposes of this analysis, 615 adolescents were included, having complete data on BMI, skinfold thickness to calculate FMI, maternal education, vitamin B6, folate and vitamin B12 intakes and biomarkers, and having the HOMA index for insulin sensitivity or resistance excluding also outliers (for biochemical measurements, outliers were considered when values were ± four standard deviations from the mean). Further details on the HELENA sampling procedures, pilot study and reliability of the data have been published elsewhere 19. Informed consent was obtained from all participants and their parents, and the protocol was approved by the Human Research Review Committees of the corresponding centers 20.
ASSESSMENT OF VITAMIN B6, FOLATE, VITAMIN B12 AND ENERGY INTAKES
Vitamin and energy intakes were assessed using the computerized 24-hour recall, self-administered HELENA-Dietary Assessment Tool (HELENA-DIAT), adapted for European adolescents from the Young Adolescents' Nutrition Assessment on Computer (YANA-C) software 21. The adolescents completed the 24-hour recalls twice in a fortnight period. Trained staff were present during completion 21. Obtained data was linked to the German Food Code and Nutrient Data Base (BLS [Bundeslebensmittelschlüssel], version II.3.1, 2005), with 12,000 coded foods, and with up to 158 nutrient data points available for each food item 21. When traditional or local foods were not available in the BLS table, recipes were composed using foods from the BLS as ingredients. The Multiple Source Method (MSM) 22 was applied to calculate usual nutrient intakes removing the effect of day-to-day within-person variation and random error in the two recalls. B-vitamins diet densities were calculated as follows: (amount of B-vitamin intake per 1,000 kcal of diet/recommendation of the corresponding B-vitamin intake based on the Institute of Medicine recommendations) *100. Recommendations for vitamin B6 intakes are 1,300 µg in males and 1,200 µg in females; for folate, 400 µg in males and females; and for vitamin B12 2.4 µg in both sexes 9.
ASSESSMENT OF VITAMIN B6, FOLATE AND VITAMIN B12 BIOMARKERS CONCENTRATIONS
In schools, early in the morning, and in fasting status, 30 ml of blood were drawn according to a standardized blood collection protocol by a certified phlebotomist. More details on sample transport and quality assurance can be found elsewhere 23. For the measurement of pyridoxal 5'phosphate (PLP), biomarker of vitamin B6, ethylene diamine tetraacetic acid (EDTA) whole blood was centrifuged at 3,500 g for 15 min. The supernatants were stored at -80 °C until analyzed. PLP was measured by high performance liquid chromatography (HPLC) (Varian Deutschland GmbH, Darmstadt, Germany; coefficient of variation [CV] = 1%) with a modified method of Kimura et al. 16) (24.
For the measurement of plasma folate and plasma vitamin B12, heparinized tubes were collected, placed immediately on ice, and centrifuged within 30 min (3,500 g for 15 min). The supernatant fluid was transported at a stable temperature of 4-7 °C to the central laboratory at the University of Bonn (IEL-Institut fuer Ernährungs [und Lebensmittelwissebschaften], Germany) and stored at 80 °C until assayed. After measuring hematocrit in situ, EDTA whole blood was used for the red blood cell folate (RBC-folate) analysis. EDTA whole blood was diluted 1:5 with freshly prepared 0.1% ascorbic acid for cell lysis and incubated for 60 min in the dark before storage at 80 °C. Plasma and RBC-folate and plasma vitamin B12 were measured by means of a competitive immunoassay using the Immunolite 2000 analyzer (DPC Biermann GmbH, Bad Nauheim, Germany) (CV for plasma folate = 5.4%, RBC folate = 10.7%, cobalamin = 5.0%) 23. Sera for measuring holotranscobalamin (HoloTC) were obtained by centrifuging blood collected in evacuated tubes without anticoagulant at 3,500 g for 15 min within one hour. Once send to the central laboratory, sera were aliquoted and stored at 80 °C until transport in dry ice to the biochemical lab at the Universidad Politécnica de Madrid for analysis (laboratory number 242 of the Laboratory Network of the Region of Madrid). HoloTC was measured by microparticle enzyme immunoassay (Active B12 Axis-Shield Ltd., Dundee, Scotland, UK) with the use of AxSym (Abbot Diagnostics, Abbott Park, IL, USA) (CV = 5.1%) 25.
Glucose was measured using enzymatic methods (Dade Behring, Schwalbach, Germany). Insulin levels were measured using an Immulite 200 analyzer (DPC Bierman GmbH, Bad Nauheim, Germany). The homeostasis model assessment (HOMA) calculation was used as a measurement of insulin resistance (glycaemia X insulin/22.5) 26.
CONFOUNDERS
Maternal education was used as proxy of socioeconomic status, obtained via self-administered questionnaire completed by the adolescents and expressed as: elementary, lower secondary, higher secondary or tertiary education. This variable was one of the most related socioeconomic factors associated with the studied vitamins 27. Total energy intake in kcal/d assessed with the 24 hours' dietary recalls software HELENA-DIAT was also used as a covariate in the analyses.
ANTHROPOMETRY
Anthropometry battery measurements were assessed following standardized and strictly controlled procedures previously described 28. Weight was measured in underwear and without shoes with an electronic scale (Type SECA 861) to the nearest 0.05 kg, and height was measured barefoot in the Frankfort plane with a telescopic height measuring instrument (Type SECA 225) to the nearest 0.1 cm. Body weight and height, together with subscapular and tricipital skinfold thicknesses, were measured in triplicate. BMI was calculated using the Quetelet formula (kg/m2). The body fat percentage was calculated using the Slaughter's equation 29, and thereafter the fat mass index (FMI) was calculated by dividing fat mass by height squared (m2).
STATISTICAL ANALYSIS
The Statistical Package for Social Sciences version 20.0 (SPSS Inc., Chicago, IL, USA) was used to analyze the data. All analyses were sex-specific. Descriptive data are presented as means and standard deviations (SD). Z-scores of BMI and FMI, and HOMA considering age and sex were used in the analyses. The Mann-Whitney test for non-parametric variables was applied to examine differences between two predefined groups, i.e., above or under the median of the z-scores for BMI, FMI, and HOMA. Thereafter, obtained categories were combined to create four subsequent groups to analyze intakes and statuses of the vitamins: low BMI (or FMI) - low HOMA (the most favorable group in terms of body composition and insulin sensitivity); low BMI (or FMI) - high HOMA; high BMI (or FMI) - low HOMA; and, finally, high BMI (or FMI) - high HOMA (the less favorable group). The Kruskal-Wallis test was applied to look at the differences in B-vitamin intakes and biomarkers among groups, with a Mann-Whitney test approach to contrast values 2 x 2. Finally, maternal education and total energy intakes were included in the analysis of covariance (ANCOVA) as covariates. All statistical tests and corresponding p values were two-sided, and p < 0.05 was the cut-off to consider a result as statistically significant.
RESULTS
In the whole HELENA sample males represented 45%, and this percentage is significantly lower than in our analysis, where males represented the 47% (p = 0.004). In terms of maternal education, included males and females showed significantly higher maternal education levels than those who were excluded (data not shown) (p < 0.001). Males included in the dietary analysis had significantly lower energy intake (p = 0.001) than those excluded; no significant differences were observed in females. There was no statistically significant difference in biomarkers of all three vitamins between the samples included and excluded (based on the inclusion criteria and required data availability).
Table I presents the main characteristics of the sample, by sex. FMI and HOMA were significantly higher in females than in males whilst total energy intake was lower (p < 0.05). Table II presents adolescents' B-vitamins intakes and biomarkers by the corresponding groups based on the median z-scores of variables of interest (BMI, FMI, and HOMA). Adolescents with low BMI, HOMA and FMI z-scores consumed more B-vitamins than those with high BMI, HOMA and FMI z-scores, except in the case of males with low HOMA, who had lower folate intakes. Considering biomarkers, adolescents with lower BMI, FMI and HOMA showed higher B-vitamins levels, except in the case of males belonging to the low HOMA group, who had lower RBC-folate concentrations than their counterparts in the higher HOMA group (p < 0.05).
Table I Characteristics of the participants by sex

BMI: Body mass index; FMI: Fat mass index; HOMA: Homeostasis Model Assessment; ME: Maternal education. B-vitamins diet densities were calculated as follows: (amount of B-vitamin intake per 1,000 kcal of diet/recommendation of the corresponding B-vitamin intake based on the Institute of Medicine recommendations) *100. Recommendations for vitamin B6 intakes are 1,300 µg for males and 1,200 µg for females; for folate, 400 µg in males and females; and for vitamin B12, 2.4 µg in both sexes. p-values in bold are the only significant ones, based either in Mann-Whitney test or t-test* at 0.05 level two-sided.
Table II B-vitamin intakes and concentrations and the groups established by the medians of the sex-specific z-scores of body mass index, fat mass index and Homeostasis Model Assessment index stratified by sex

BMI: Body mass index; FMI: Fat mass index; HOMA: Homeostasis Model Assessment; PLP: Pyridoxal phosphate; PF: Plasma folate; RBC-folate: Red blood cell folate; HoloTC: Holotranscobalamin; SD: Standard deviation. B-vitamins diet densities were calculated as follows: (amount of B-vitamin intake per 100 kcal of diet/recommendation of the corresponding B-vitamin intake based on the Institute of Medicine recommendations) *100. Recommendations for vitamin B6 intakes are 1,300 µg for males and 1,200 µg for females; for folate, 400 µg in males and females; and for vitamin B12, 2.4 µg in both sexes. p-value based on Mann-Whitney non-parametric test. Statistical significance at 0.05 two-sided level. ^Sex-specific z-scores of BMI, FMI and HOMA were adjusted by age.
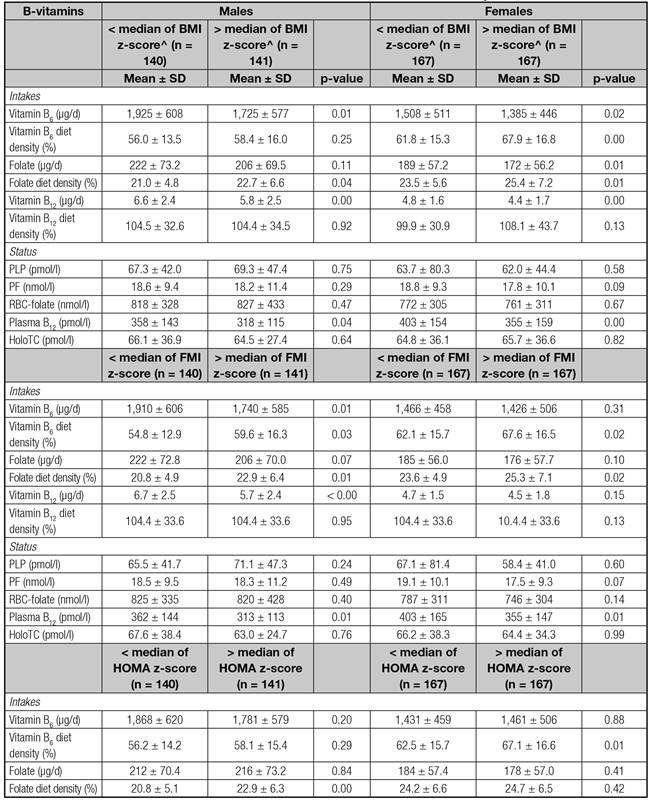
Table III shows the differences in B-vitamins both in intakes and concentrations among the groups defined by the subsequent categories of < median and > median of BMI, FMI, and HOMA z-scores considered in combination, without any additional adjustment. All in all, results showed that adolescents belonging to the less favorable groups (high BMI-or FMI-/high HOMA) had lower B-vitamins intake and concentrations, and also lower total energy intakes. However, when an analysis of the covariance was performed to introduce in the model the covariates of education of the mother and total energy intake, most of the statistically significant differences among groups disappeared.
Table III Differences of B-vitamin intakes and biomarkers concentrations by resulting combination groups between z-scores of body mass index and fat mass index against z-scores of insulin resistance (HOMA) index


BMI: Body mass index; HOMA: Homeostasis Model Assessment; FMI: Fat mass index; PLP: Pyridoxal phosphate; PF: Plasma folate; RBC-folate: Red blood cell folate; HoloTC: Holotranscobalamin; SD: Standard deviation. p-value based on Kruskal-Wallis non-parametric test. Statistical significance was established at 0.05 two-sided level. Superscripts letters represent those groups with statistical significant differences. Post hoc comparisons between groups have been established based on Mann-Whitney test. Statistical significance critical value established at 0.0167 two-sided level (resulting from dividing 0.05/3 comparisons with the reference category of "low BMI (or FMI)-low HOMA" which represents the more favorable option).
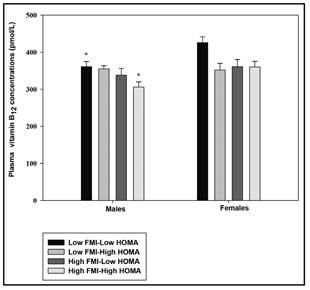
Table IV shows similarly, the adjusted results of the table II (by energy intakes, and maternal education). In females, vitamin B6 intakes were higher in the high BMI/high HOMA group than in the high BMI/low HOMA group (p < 0.05). Similarly, the high FMI/high HOMA group vitamin B6 intakes were higher than in the low FMI/low HOMA group. Plasma vitamin B12 in males were significantly lower in the high FMI/high HOMA than in the low FMI/low HOMA group, keeping also significant their trends throughout the groups, which can be observed also for females (p < 0.05). These trends can be followed in figure 1.
Table IV Adjusted estimates of B-vitamin intakes and biomarker status by combination of body mass index, fat mass index and Homeostasis Model Assessment index
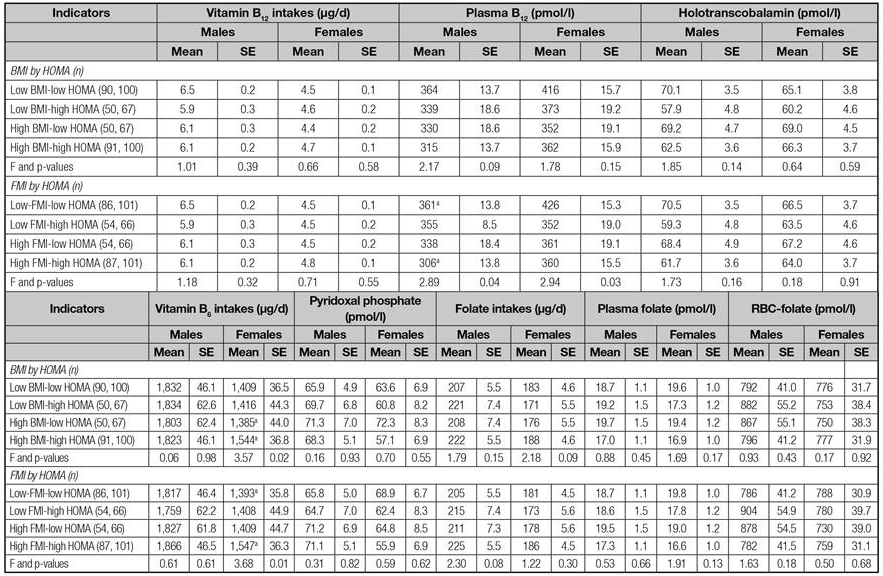
RBC-folate: Red blood cell folate; SE: Standard error; n.s.: Not significant. Significant differences (p < 0.05) between groups are indicated by the same superscripts letters. F tests the effect of the model.
DISCUSSION
To the authors' knowledge, this is the first study to examine the association between B-vitamin intakes and the corresponding biomarker concentrations and insulin resistance according to markers of body composition such as body mass index and fat mass index in European adolescents. The results suggest an association between higher adiposity together with higher insulin sensitivity and plasma vitamin B12 concentrations, showing the lowest vitamin B12 plasma concentrations in those adolescents with higher levels of adiposity combined with higher HOMA insulin sensitivity. Three B-vitamins intake and status corresponding to vitamin B6, folate and vitamin B12 have been investigated in this study, and we have obtained several differences in them in different groups constituted by the combinations between BMI, FMI and HOMA categories. However, intake of vitamin B6 and plasma vitamin B12 was the only for which a difference was found for categories of the mentioned groups when education of the mother and energy intake was taken into account.The prevalence of insufficient vitamin B12 biomarker levels in this sample of European adolescents is low (5% based on HoloTC and 2% based on serum B12) 30, and corresponds approximately to the prevalence of inadequate vitamin B12 intakes reported previously (2.9% in males and 6.0% in females) 8 in a larger sample of the same adolescents. In other studies performed in Australia and Canada, the percentage of adolescents identified with low or borderline B12 status was higher than the one reported in our European adolescents (respectively, 32.1% in obese adolescents in the study from Australia 13, or 13.7% in all children and adolescents and 20.4% only in obese children and adolescents reported in the Canadian survey (31) using the same cut-points as in the Australian study). However, these percentages of low vitamin B12 status refer exclusively to overweight/obese adolescents, and this could be the cause of such big differences with ours.
In our sample, 23.3% 32 of the adolescents were classified as overweight or obese. Even with these differences in rates of overweight/obesity and deficiency or not of vitamin B12 between our study and the Australian study 13, our results confirm the association between lower levels of vitamin B12 and higher HOMA and FMI. Besides, this negative association between vitamin B12 plasma levels and values of insulin sensitivity and body composition markers are likely reproducible for other micronutrients (total carotenoids, alpha-carotene, beta-carotene, beta-cryptoxanthin, lutein/zeaxanthin, lycopene, vitamin E, vitamin C, selenium, vitamin A, vitamin D, folate, vitamin B12, and RBC-folate), as reported in a study of US adults 33.
There are no previous studies investigating the same associations in a similar population group. Nevertheless, previous studies 4) (13) (31 focused on obese adolescents or wide general population groups have also found that higher BMI z-scores were associated with lower vitamin B12 concentrations, with no significant gender effect.
There are several mechanisms which might explain this observation. For instance, adolescents have increased nutrient requirements secondary to increased growth and body size 34. Another reason is that adolescents with high BMI are thought to have diets with low micronutrient density. In our study, we found lower B-vitamins intake in adolescents with higher BMI while they have higher B-vitamins density diets. This can be explained by the fact that in the HELENA study, adolescents with higher BMI reported lower total energy diets likely affected by underreporting 35. Another reason could be that obese adolescents may have repeated short-term restrictive diets 34; this could be the case in our study 35, because adolescents with high BMI and high FMI were those with lower total energy intakes.
There were several differences between groups constituted by the combination of body composition markers and HOMA insulin sensitivity in terms of B-vitamins biomarkers concentrations. However, only adolescents belonging to the most favorable group in terms of combination between FMI and HOMA (lower FMI combined with lower HOMA) have higher plasma vitamin B12 concentrations, as it had been already shown by another study 13. However, the previous study did not include the analyses of B-vitamins dietary intake, as it has being shown in our study. This fact cannot be explained by higher vitamin B12 intakes but it might be due to lower vitamin B12 density diets in comparison to those adolescents belonging to the less favorable combination groups, as shown in table II, likely resulting from the restrictive diets or underreporting behaviors previously mentioned. Besides, while we have obtained statistically significant differences for vitamin B6 intake regarding BMI and FMI based on the median categories combined with the categories of HOMA, this was not the case for vitamin B12. This is of lots of interest owing to the fact that plasma vitamin B12 is supposed to reflect changes in day-to-day diet rather than HoloTC, which is more efficient in predicting long-term diet changes 9, for which no difference among categories has been found.
Given that there seems not to be a plausible effect of adiposity and insulin resistance on plasma vitamin B12 concentrations, linked to vitamin B12 intake, we should consider the hypothesis that low vitamin B12 concentrations could influence insulin resistance. A recent genome-wide analysis 36 suggested that increased DNA methylation is associated with increased BMI in adults, and vitamin B12 is a determinant for DNA methylation.
Also, in a recent review about the transmission of obesity-adiposity and related disorders from the mother to the newborns 37, it is mentioned that in rural areas from India, with mothers consuming mainly vegetarian diets, the most insulin-resistant children were born to mothers who had low vitamin B12 but high folate levels, suggesting that a balance between these two vitamins is essential. This might be a consequence from the fact that folate together with vitamins B12 and B6, among others, regulate maternal 1-carbon metabolism, which influences cellular growth and differentiation by helping synthesis of nucleic acids. However, this explanation is not helpful to understand our results, owing to the differences in the characteristics of the population group and because our sample showed higher prevalence of folate deficiency than the vitamin B12 one 30.
Other study 38 showed the importance of levels of homocysteine in insulin resistance with an improvement of it with a lowering homocysteine by folate + vitamin B12 treatment and a correlation of 0.60 between homocysteine levels and insulin resistance, as was also shown by similar studies.
Our findings might be of particular concern in case of adolescents diagnosed as obese patients because they will be prone to a further decrease in vitamin B12 concentrations if metformin therapy is recommended for the treatment of type 2 diabetes 15. For instance, in adults, vitamin B12 malabsorption was observed in approximately 20% of patients using metformin, and this was associated with a 4-24% decrease of vitamin B12 concentrations 39.
LIMITATIONS AND STRENGTHS
The cross-sectional design of the study represents a limitation owing to the fact that causality cannot be established. The clinical interpretation of our findings is unclear because a very low percentage of adolescents presented inadequate intakes or very low serum concentrations of vitamin B12. However, the observed association between vitamin B12 plasma level and body composition and insulin resistance warns us about the importance of having a healthy nutritional status and elucidates the fact that overweight or obese people cannot get nutritional deficiencies. The use of harmonized and standardized procedures in a large sample of adolescents from Europe 18 should be considered as the main strength of the study, as well as the use of previously validated questionnaires and procedures 18) (19. Besides, the calculation of the usual intake values based on the MSM method to prevent limitations of the 24-h recalls 22, together with the use of widely accepted micronutrient biomarkers, strengthen the reliability of the observations with any other marker or symptom 40.
CONCLUSION
Obesity is not only associated with cardiovascular conditions, cancer, dyslipidemias, etc., but also with micronutrient deficiencies which can lead to serious health problems. Among vitamins B6, folate, and B12, it seems that vitamin B12 is the one most consistently and negatively associated with BMI, FMI, and insulin sensitivity or resistance (HOMA) without discriminating between sexes of European adolescents.
In male and female adolescents with combined higher adiposity measured with fat mass index and higher HOMA insulin sensitivity, low vitamin B12 plasma concentrations were observed. These differences do not seem explained by dietary vitamin B12 intake. Further studies are necessary to elucidate the potential role of low vitamin B12 concentrations in the development of insulin resistance in adolescents in order to identify a plausible biological mechanism.

