


Meu SciELO
 Serviços customizados
Serviços Personalizados
Journal
Artigo
 Inglês (pdf)
 Artigo em XML
 Referências do artigo
 Enviar este artigo por email
Indicadores
-
 Citado por SciELO
 -
 Acessos
Links relacionados
-
 Citado por Google
 -
 Similares em
SciELO
Similares em
SciELO -
 Similares em Google
Compartilhar

 Permalink
Nutrición Hospitalaria
versão On-line ISSN 1699-5198versão impressa ISSN 0212-1611
Nutr. Hosp. vol.34 no.5 Madrid Set./Out. 2017
https://dx.doi.org/10.20960/nh.885
TRABAJO ORIGINAL / Obesidad y síndrome metabólico
Androgen receptor gene polymorphisms and maximal fat oxidation in healthy men. A longitudinal study
Polimorfismo del gen del receptor de andrógenos y oxidación máxima de grasa en hombres sanos. Estudio longitudinal
Jesús Gustavo Ponce González1, Amelia Guadalupe Grau2, Francisco Germán Rodríguez González3,4, Rafael Torres Peralta1,2, David Morales Alamo1,2, Lorena Rodríguez García1, Bonifacio Nicolás Díaz Chico3,4, José Antonio López Calbet1,2 and Cecilia Dorado1,2
Departments of 1Physical Education and 3Biochemistry and Physiology. Universidad de Las Palmas de Gran Canaria. Las Palmas de Gran Canaria, Spain.
2Research Institute of Biomedical and Health Sciences (IUIBS). Universidad de Las Palmas de Gran Canaria. Las Palmas de Gran Canaria, Spain.
4Canary Islands Cancer Research Institute (ICIC). Las Palmas de Gran Canaria, Spain
ABSTRACT
Introduction: Androgens play a major role in fat oxidation; however, the effects of androgens depend, among other factors, on the intrinsic characteristics of the androgen receptor (AR). Lower repetitions of CAG and GGN polymorphism appear to have a protective effect on fat accumulation in the transition from adolescent to mid-twenties. Whether a similar protective effect is present later in life remains unknown. The aims of this study were: a) to evaluate if extreme CAG and GGN repeat polymorphisms of the androgen receptors influence body fat mass, its regional distribution, resting metabolic rate (RMR), maximal fat oxidation capacity (MFO) and serum leptin, free testosterone and osteocalcin in healthy adult men; and b) to determine the longitudinal effects on fat tissue accumulation after 6.4 years of follow-up.
Methods: CAG and GGN repeats length were measured in 319 healthy men (mean ± standard deviation [SD]: 28.3 ± 7.6 years). From these, we selected the subjects with extreme short (CAGS ≤ 19; n = 7) and long (CAGL ≥ 24; n = 10) CAG repeats, and the subjects with short (GGNS ≤ 22; n = 9) and long (GGNL ≥ 25; n = 10) GGN repeats. Body composition was assessed by DXA and serum levels of leptin, free testosterone and osteocalcin by ELISA. After 6.4 years of follow-up, DXA was repeated, and resting metabolic rate (RMR), MFO and VO2max determined by indirect calorimetry.
Results: CAGS and CAGL subjects had similar RMR and accumulated comparable amounts of fat tissue over 6.4 ± 1.0 years of follow-up. However, CAGL had higher MFO and total lean mass than CAGS (p < 0.05). Men with GGNS accumulated greater amount of total fat mass than men with GGNL, particularly in the trunk region seven years later. This concurred with a greater MFO in the GGNL group (p < 0.05), who accumulated less fat mass. Free testosterone was associated with MFO in absolute values (r = 0.45; p < 0.05) and MFO per kg of lower extremity lean mass per height squared (r = 0.35; p < 0.05).
Conclusions: CAG and GGN repeat polymorphisms may influence muscle fat oxidation capacity and may have a role in the accumulation of fat over the years.
Key words: Androgen receptor polymorphism. Fat accumulation. Fat oxidation. Osteocalcin. Testosterone. Leptin.
RESUMEN
Introducción: los andrógenos juegan un papel importante en la oxidación de grasas; sin embargo, el efecto de los andrógenos depende, entre otros factores, de las características intrínsecas del receptor de andrógenos (RA). Un menor número de repeticiones CAG y GGN del RA parecen tener un efecto protector sobre la acumulación de grasa en la transición de la adolescencia hasta la veintena. Se desconoce si adelante en la vida persiste un efecto protector similar. Los objetivos de este estudio fueron: a) evaluar si repeticiones extremas de los polimorfismos CAG y GGN del RA influyen sobre la masa grasa corporal, su distribución regional, la tasa metabólica en reposo (RMR), la máxima oxidación de grasas (MFO) y la concentración sérica de leptina, testosterona libre y osteocalcina en hombres sanos; y b) determinar los efectos longitudinales sobre la acumulación de grasa después de 6.4 años de seguimiento.
Métodos: la longitud de las repeticiones de CAG y GGN fueron medidas en 319 hombres sanos (media ± desviación estándar [SD]: 28,3 ± 7,6 años). De estos, seleccionamos los sujetos con repeticiones del CAG extremas cortas (CAGS ≤ 19; n = 7) y largas (CAGL ≥ 24; n = 10), y los sujetos con repeticiones del GGN extremas cortas (GGNS ≤ 22; n = 9) y largas (GGNL ≥ 25; n = 10). Se evaluaron la composición corporal mediante DXA y los niveles séricos de leptina, testosterona libre y osteocalcina por ELISA. Tras 6.4 años de seguimiento el DXA fue repetido, y la tasa metabólica en reposo (RMR), máxima oxidación de grasas (MFO) y VO2max fueron determinados mediante calorimetría indirecta.
Resultados: los grupos CAGS y CAGL fueron comparables en RMR y cantidad de tejido graso tras 6,4 ± 1,0 años de seguimiento. Sin embargo, el grupo CAGL tuvo mayor MFO y masa libre de grasa que el grupo CAGS (p < 0,05). Los hombres con GGNS acumularon mayor cantidad de masa grasa total que los hombres con GGNL, particularmente en la región del tronco siete años después. Esto concordó con un mayor MFO en el grupo GGNL (p < 0,05), que acumuló menos masa grasa. La testosterona libre se asoció con el MFO en valores absolutos (r = 0,45; p < 0,05) y con MFO expresado por kg de masa libre de grasa de las piernas al cuadrado (r = 0,35; p < 0,05).
Conclusiones: las repeticiones del polimorfismo del CAG y GGN pueden influenciar la capacidad muscular de oxidación de grasas y pueden tener un rol en la acumulación de grasa con los años.
Palabras clave: Polimorfismo del receptor de andrógenos. Acumulación de grasas. Oxidación de grasas. Osteocalcina. Testosterona. Leptina.
Introduction
In most cases, obesity is associated with reduced circulating levels of androgens and osteocalcin, and a high concentration of leptin in plasma (1,2). Osteocalcin is a negative regulator of fat mass and serum leptin (3). Serum osteocalcin levels stimulate testosterone production by acting on the Leydig cells in male transgenic models (4). Polymorphic variants of the androgen receptor (AR) may explain part of the variability in the association of androgens, osteocalcin and leptin with fat mass (5-9). However, no longitudinal study so far has addressed the influence that polymorphic variations of the androgen receptors could have in the accumulation of fat mass in adult men over the years.
The AR gene contains a polyglutamine sequence encoded by CAG repeats and a polyglycine tract (GGN) encoded by (GGT)3GGG(GGT)2(GGC)n. Short CAG repeats are associated with increased AR transactivation activity and stronger transcriptional potential (10), whereas short GGN repeats are associated with increased AR protein content in cell cultures, that may, in turn, enhance the response to androgen stimulation (11).
In boys followed during 14 years from adolescence to adult age, short compared to long CAG was associated with lower accumulation of total body and trunk fat mass, despite a lower resting metabolic rate (RMR) and maximal fat oxidation capacity (MFO). Short GGN repeats were also associated with a lower percentage of body fat compared to long GGN repeats (12). However, the former study did not include hormonal measurements, which are essential to understand the changes in body composition.
GGN polymorphism has been less studied. The association between GGN repeats and body fat is controversial, with studies reporting no association (13) whilst Gustafson et al. (14) concluded that middle-aged and old men who had both a rare GGN (not 17) and short CAG (≤ 23) had higher waist-to-hip ratios than the rest of the population. Recently, it was determined that GGN, but not CAG length, is positively associated with adiposity, leptin and osteocalcin in women (5). The possible influence of AR polymorphism on adiposity in men could have been masked by the fact that most men had AR repeat length polymorphisms close to the population mean. Hence, we hypothesised that the influence of AR polymorphisms on body fat mass, its regional distribution and leptin levels should be more marked in men with extreme GGN and CAG repeat numbers.
Therefore, this study had two main aims. First, to determine if men with short CAG or GGN polymorphisms (< 25 percentile) have greater body fat mass, RMR, MFO and serum concentration of leptin, free testosterone and osteocalcin than men with longer CAG or GGN polymorphisms (> 75 percentile). Second, to ascertain if men with short CAG or GGN polymorphisms accumulate less fat tissue over the years than those with longer CAG or GGN polymorphisms, after accounting for confounding factors like RMR, MFO and physical fitness.
Materials and methods
SUBJECTS
Initially, this study included 319 Caucasian healthy men who participated in a previous cross-sectional study (5). Inclusion criteria were: age ranging from 18 to 60 years, BMI < 35 and participation in sports or another kind of physical activities with a minimum frequency of once per week. Smokers and patients with diabetes or chronic diseases or orthopedic limitations were excluded. Less than 5% of volunteers were excluded, and the main cause of exclusion was volunteering despite smoking and having chronic diseases. Androgen receptor polymorphism was measured in all volunteers. After that, subjects pertaining only to the first or fourth quartile for CAG or GGN repeat numbers were contacted again to participate in a longitudinal design of 6-7 years of follow-up, and half of them (i.e., 38) agreed to participate. The study was performed by the Declaration of Helsinki of 2013 as regards the conduct of clinical research, being approved by the Ethical Committee of the Universidad de Las Palmas de Gran Canaria.
TESTS
The initial tests were carried out on four different days. The first day, subjects reported to the laboratory between 7.30 and 8.30, and a 20 ml blood sample was obtained from an antecubital vein after five minutes supine. On the second day, body composition and jumping performance were determined. The third day was used to assess their running speed and anaerobic capacity. The last day, their VO2max was measured as previously reported (6).
Approximately 6-7 years later, subjects reported back to the laboratory after an overnight fast for the measurement of body composition by DXA, RMR, MFO, and their VO2max by indirect calorimetry (12), and physical activity using the Minnesota Leisure Time Physical Activity Questionnaire (15). Subjects were requested to refrain from non-habitual exercise, caffeine or alcohol drinks for at least 24 hours before the test.
LEPTIN, FREE TESTOSTERONE AND OSTEOCALCIN ASSAYS
Serum leptin (#EZHL-80SK, Linco Research St. Charles, Missouri, USA) and osteocalcin (Nordic Bioscience Diagnostics, Herlev, Denmark) were determined by enzyme-linked immunosorbent assay (ELISA) (ELx800 Universal Microplate Reader, Bioteck Instruments Inc., Vermont, USA). The sensitivity of the assays was: 0.05 ng/ml for total leptin and 0.5 ng/ml for osteocalcin. Intra- and interassay coefficients of variation were 3.8 and 4.4% for leptin, and 6.7 and 6.7% for osteocalcin, respectively.
Serum total testosterone (TT), and sex hormone-binding globulin (SHBG) concentrations were measured by a fully automated two-site, solid-phase, chemiluminescent enzyme immunometric assay (Immulite 2000®, Siemens Healthcare Diagnostics). The intra-assay coefficients of variation were 9.8% and 2.2% respectively, and the inter-assay coefficients of variation were 11.0% and 5.1%. Sensitivity endpoints were settled at 15 ng/dl and 0.02 nmol/. Serum concentrations of free testosterone (FT) were calculated as reported by others (16).
BODY COMPOSITION
Body composition was assessed by dual-energy X-ray absorptiometry (DXA) (QDR-1500, Hologic Corp., Software version 7.10, Waltham, MA) (17).
VERTICAL JUMP PERFORMANCE AND RUNNING SPRINT TESTS
The vertical forces generated during vertical jumps were measured with a force plate (Kistler Quattro Jump, Winterthur, Switzerland) (17). A 30-m sprint, starting in a stationary position, was performed using photocells (General ASDE, Valencia, Spain). The best of three trials was taken as the representative value of the test (17).
ANAEROBIC CAPACITY
An all-out 300-m running test on a 400-m track was used to estimate the anaerobic capacity (17), since the anaerobic metabolic pathways are the main energy suppliers during all-out exercise tests with a duration between 30 and 60 s (18).
MAXIMAL FAT OXIDATION AND VO2max
After overnight fast, resting energy expenditure was measured during 30 minutes in the supine position (Vmax N29; Sensormedics, California, USA). This was followed by an incremental exercise test to determine the MFO (19), and the intensity at which MFO occurred (fat[max]) during leg cycling (20). The test started at 30 watt for five minutes, followed by 30 W increments every three minutes until the RER was > 1.0. After five minutes of recovery, subjects performed an incremental test (30 W/min: 80 rpm) beginning in the last load of the MFO test to determine their VO2max.
CAG AND GGN REPEAT POLYMORPHISMS
CAG and GGN repeat polymorphisms were determined as previously reported. Briefly, DNA was extracted from blood samples (200 ml) using High Pure PCR Template Preparation Kits (Roche Applied Science). To determine the length of the CAG and GGN repeats the corresponding regions located on the exon 1 of the AR gene (Genbank accession no. M27423) were amplified using two pairs of primers whose sequences have been previously reported (5). Fragment separation was performed by automated capillary electrophoresis using an ABI Prism 3100 Genetic Analyzer (Applied Biosystems) and the length was determined with Gene Scan Analysis Software (version 3.7) (Applied Biosystems). Internal standards supplied by the manufacturer were used for quality control.
STATISTICAL ANALYSIS
All variables were checked for normal distribution using the test of Shapiro-Wilk. When necessary, the analysis was done on logarithmically transformed data. The influence of CAG and GGN repeat lengths on body composition, MFO, hormones and VO2max was determined taking CAG and GGN repeat lengths as either continuous variables or as dichotomous variables with allele cut-off thresholds. The relationship between CAG and GGN as continuous variables with body composition, hormones and physical fitness variables was examined using linear regression analysis. The longitudinal study was carried out with subjects belonging to the first (short repeat number) and fourth (long repeat number) quartile of the CAG and GGN number distributions: CAGS (short ≤ 19 repeats; n = 17), CAGL (long ≥ 24 repeats; n = 23), GGNS (short ≤ 22 repeats; n = 13), and GGNL (long ≥ 25 repeats; n = 16). Comparisons between short and long groups were carried out with ANOVA after accounting for age, height, total lean body mass, and VO2max as covariates. Lean mass was corrected for differences in height by dividing muscle mass by height (2,21). Longitudinal effects were assessed with ANOVA for repeated measures after accounting for age, height, total lean body mass, VO2max, starting body fat mass, basal fat oxidation, time elapsed between the two measurements, and MFO as covariates. Stepwise multiple regression analysis was used to determine which variables had the highest predictive value for MFO. p < 0.05 was set as the level of significance, and p < 0.10 was considered as trend toward significance.
Results
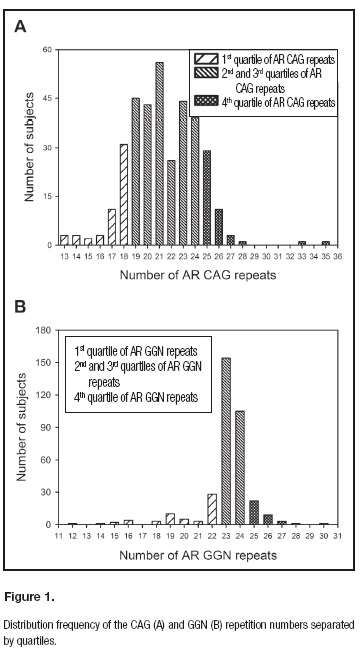
Body composition, RMR, MFO, physical activity and fitness are reported in table I. The distribution of AR allele frequencies for CAG and GGN repeat numbers are illustrated in figure 1. The median CAG repeat length was 21 (range: 13-35), while the GGN median length was 23 (range: 12-28). The median values for short and long groups were 17 and 26 for CAG, and 19 and 25 for the GGN groups, respectively.
CAG AND ADIPOSITY
The subjects in the CAGS and CAGL groups had similar age, height, weight and fat mass (Table I). However, CAGL had higher total and extremities lean mass and VO2max than CAGS even after accounting for age (p < 0.05) (Table I).
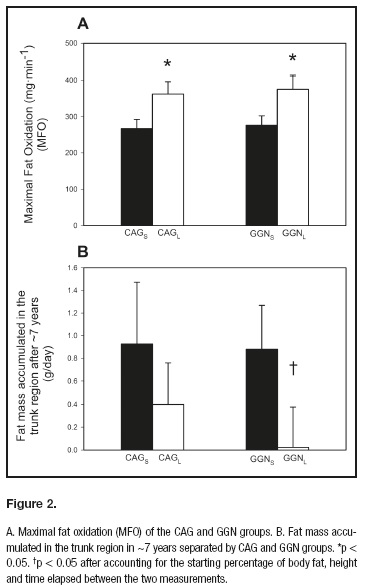
MFO was also higher in CAGL as compared to CAGS (p < 0.05) (Fig. 2A) and showed a trend after accounting for total lean body mass (p = 0.05) or age (p = 0.08). However, this difference in MFO was lost after accounting for VO2max as a covariate (p = 0.90). Likewise, CAGL showed a higher performance in the 300-meter test compared to CAGS (p < 0.05), even after accounting for lean mass and height as covariates. However, this difference was lost after accounting for age or VO2max as covariates (p = 0.28). No significant differences between CAGS and CAGL groups were observed in muscular fitness, as reflected by the jump test, daily energy expenditure (Table I), serum hormone concentration or resting metabolic rate.
Free testosterone tended to be higher in CAGL as compared to CAGS (21.5%, p = 0.06).
GGN AND ADIPOSITY
GGNS and GGNL groups had similar age, body composition and physical fitness (Table I) even after adjusting for age and height (data not shown). Despite similar body composition, MFO in absolute values and normalized per kg of lower extremity lean mass was higher in the GGNL compared to the GGNS group (p < 0.05) (Fig. 2A). This difference in MFO was lost after accounting for VO2max per kg of lower extremity lean mass (p = 0.09). There were no significant differences in VO2max neither RMR between GGN groups, even after accounting for age, height and physical fitness as covariates. The logarithm of leptin levels tended to be higher in GGNS compared to GGNL (39.4%; p = 0.09). No significant differences in the rest of hormone concentration were observed between groups, including free testosterone concentration, which was only 2.2% greater without significance in GGNL compared to GGNS (p = 0.89).
LONGITUDINAL STUDY
Longitudinal data were available for 17 and 19 subjects with extreme values for CAG and GGN genotypes, respectively. Their physical characteristics and body composition changes are depicted in table II. Physical activity measured by questionnaire was similar in both groups.
Body composition and VO2max changed similarly in both groups during the follow-up. The CAGS and CAGL subjects accumulated 3.4 ± 5.1 and 2.0 ± 4.4 kg of whole body fat over 6.4 ± 1.0 years. Despite the fact that CAGS showed a 47% greater fat accumulation per day than CAGL, this difference in fat mass accumulation was not statistically significant (p = 0.49) even after accounting for starting age, change in VO2max, body height, starting body fat mass, basal fat oxidation and MFO as covariates (Fig. 2B). The GGNS and GGNL subjects accumulated 3.2 ± 4.5 and 0.5 ± 4.3 kg of whole body fat over 6.9 ± 1.1 years of follow-up (p = 0.13) (table II). There was a trend for a statistical difference in whole body fat mass accumulation after accounting for the starting percentage of body fat, height, and time elapsed between the two measurements (p = 0.08); the starting percentage of body fat, height, whole body basal fat oxidation, and time elapsed between the two measurements (p = 0.08); but not when adjusted for the starting percentage of body fat, height, MFO (absolute values), and time elapsed between the two measurements (p = 0.11); the starting percentage of body fat, height, MFO (per lean mass of the lower extremities), and time elapsed between the two measurements (p = 0.12), and the starting percentage of body fat, height and whole body basal fat oxidation, the differences (absolute values) in VO2max, and time elapsed between the two measurements (p = 0.25).
The GGNS and GGNL subjects accumulated 2.0 ± 2.7 and 0.3 ± 2.9 kg of fat in the trunk region over 6.9 ± 1.1 years (GGNS vs GGNL: p = 0.19) (table II). This difference was statically significant after accounting for the starting percentage of body fat, height and time elapsed between the two measurements (p = 0.031) (Fig. 2B); the starting percentage of body fat, height, whole body basal fat oxidation and time elapsed between the two measurements (p = 0.042); but not when adjusted for the starting percentage of body fat, height, MFO (absolute values), and time elapsed between the two measurements (p = 0.07); the starting percentage of body fat, height, MFO (per lean mass of the lower extremities), and time elapsed between the two measurements (p = 0.08); and the starting percentage of body fat, height and the difference (absolute values) in VO2max, and time elapsed between the two measurements (p = 0.10).
CORRELATIONS
Leptin was positively correlated with whole body fat (r = 0.56; p = 0.001), while the correlation between osteocalcin and whole body fat was negative (r = -0.41; p = 0.02). Serum total testosterone was inversely correlated with whole body fat (r = -0.37; p = 0.044), fat mass in the trunk region (r = -0.40; p = 0.027) and percentage of body fat (r = -0.45; p = 0.012). Serum free and total testosterone were positively correlated with osteocalcin (r = 0.36, p = 0.046; and r = 0.56, p = 0.001, respectively). Moreover, free testosterone was associated with MFO (absolute values) (r = 0.45; p = 0.012), MFO per kg of lean mass (r = 0.39; p = 0.031), and MFO per kg of lower extremity lean mass (r = 0.37; p = 0.04). The CAG repeat number was positively associated with lean mass (r = 0.34; p = 0.014), lower extremity lean mass per height squared (r = 0.34; p = 0.015), VO2max (absolute values) (r = 0.43; p = 0.001), and MFO (absolute values) (r = 0.29; p = 0.038). The GGN repeat number was associated with VO2max (absolute values) (r = 0.28; p = 0.043), MFO (absolute values) (r = 0.28; p = 0.040) and MFO per kg of lower extremity lean mass per height squared (r = 0.28; p = 0.043).
FACTORS DETERMINING MFO
A stepwise multiple regression model with MFO per kg of lower extremities lean mass as the dependent variable and VO2max (per kg of lower extremity lean mass), the logarithm of age, % of body fat and performance in 300 m as independent variables showed that VO2max (per kg of lean mass of lower extremities) alone explained 39.4% of the variance in MFO (β = 0.63; p < 0.001) (MFO = -0.015 + 0.00018 · VO2max [ml/kg lean mass lower extremities/min]).
When 300 m were added into the second model, it explained 46.4% of the variance in MFO per kg of lower extremities lean mass jointly with VO2max (per kg of lower extremity lean mass) (β = 0.51 and β = 0.29; p < 0.05). The two other variables were excluded from the model as they did not contribute to improve the prediction (MFO = 0.012 + 0.00014 · VO2max [ml/kg lean mass lower extremities] + 0.00041 · performance in 300 m [m/s], r2 = 0.68, p < 0.001; n = 44).
When MFO was expressed in absolute values as dependent variable the logarithm of CAG alone explained 8.6% of the variance in MFO (β = 0.29; p < 0.05) (MFO = -0.513 + 0.635 · logarithm of CAG repeats polymorphism).
In the whole group of subjects, the accumulation of fat tissue (whole body: r = -0.47; n = 23, p = 0.026; and trunk region: r = -0.51, n = 23, p = 0.014) was associated with the changes in VO2max (expressed by kg of lower extremities lean mass). There was no significant relationship between MFO and whole body fat mass accumulation (r = -0.32, p = 0.15, n = 23).
Discussion
This study shows that the CAG repeat polymorphism does not appear to be associated with fat mass in healthy young men, since subjects with short (≤ 19, 1st quartile) and long CAG (> 23, 4th quartile) had similar fat mass and regional distribution of adipose tissue. However, CAGL showed higher total lean mass, as well as lean mass in the extremities, in comparison to CAGS. This finding explained the greater performance in 300 m, VO2max- and MFO in CAGL as compared to CAGS. In concordance, we found an association between MFO and lean mass, which could explain the observed 47% greater fat mass accumulation per day in the CAGS group, had we incurred in a type 2 error. In contrast to our hypothesis, men in the first GGN repeat length quartile (i.e., GGN ≤ 22) tended to accumulate greater total and trunk fat mass during the follow-up period than men in fourth GGN repeat length quartile. Moreover, GGN repeats tended to be negatively associated with the percentage of body fat and leptin levels. This concurs with a greater MFO in the GGNL group compared to GGNS group.
In contrast to our hypothesis, we observed that extreme CAG repeat length was not associated with whole body fat mass, its relative amount or its regional distribution. These results concur with other studies where subjects in the first and fourth quartile for CAG length were compared (22-24). In contrast, an association between the CAG repeat length and the percentage of body fat has been reported by others (8,9). The latter is at odds with the linear relationship reported by Crabbe et al. between CAG number and free testosterone (25), since higher levels of testosterone are usually associated with lower adiposity (26,27). Our study showed a direct association between the length of CAG repeats and free testosterone levels, which may in part explain the lower fat accumulation in CAGL compared to CAGS.
It has been shown that testosterone injections may increase fat oxidation capacity by 27% compared to baseline levels (28). In agreement, our data revealed that CAGL, who had 21.5% higher levels of free testosterone, also had greater MFO than CAGS, as previously reported in boys followed during 15 years from adolescence to adult age (12). This finding is important since it has been shown in men that low levels of testosterone increase the risk of all-cause and cardiovascular mortality, increase fat accumulation, reduced glucose utilization, glycolysis and mitochondrial oxidative phosphorylation (29), which could affect fatty acid oxidation capacity.
In agreement with our results, no association between CAG polymorphism and fat mass was observed in our original cohort composed by 319 physically active men (5). Likewise, no association between CAG repeat number and visceral fat was observed by Nielsen et al. (8). Consistent with our results, no association between CAG length and serum leptin levels have been reported by others (30,31).
As a novelty, we provide evidence with cross-sectional and longitudinal data indicating that the GGN repeat polymorphism may have a role in MFO, body fat mass, and its regional distribution. This study indicates that an extreme GGNL AR polymorphism seems to protect against fat mass accumulation in the trunk in men. This result is supported by the higher MFO per kg of total lean mass found in the GGNL compared to the GGNS group, and by the trend for a positive association between the GGN number with the logarithm of the percentage of body fat, and MFO per kg of lower extremity lean mass. The non-significant small increase in circulating androgen levels (2.2%) could have also contributed to explaining the lower accumulation of fat mass in the GGNL group. In agreement, greater serum concentration of total testosterone and free testosterone has been reported in GGNL than in the GGNS men (32). This also concurs with the association between free testosterone and MFO, as well as between SHBG and the accumulation of trunk fat per day in this study. The difficulty to include all volunteers belonging to quartile 1 and 4 in the follow-up reduced the final sample size, precluding the detection of differences in serum hormones.
In contrast with the present findings, CAGS and GGNS had lower adiposity, fat accumulation than CAGL or GGNL in a longitudinal study from adolescence to adult age (~13 to ~27 years old) (12). Both studies show a beneficial influence of long CAG and GGN repeats on MFO, which could protect against the gain of fat mass over the years. Combining the results from our previous studies is seems that the influence of CAG and GGN polymorphisms on fat mass may be modulated by the circulating concentration of testosterone, which declines 1 percent per year after the age of 30 (33). Likewise, the concentration of testosterone is lower during adolescence, and the impact of AR polymorphism could be different in an internal milieu with lower levels of circulating androgens (34).
It has been reported that the main determinant of MFO is the VO2max (35). Interestingly, our longitudinal data revealed an association between the changes in VO2max and the increase in MFO, indicating that an improvement in VO2max was associated with an increase in MFO and a reduction in whole-body and trunk fat mass, and vice versa. Since our data indicated that the changes in VO2max explained about 22-25% of the fat mass accumulated in the trunk (or whole body), we also examined if the greater accumulation of trunk fat mass observed in the GGNS group could be explained by a greater reduction of VO2max in the GGNS. No statistical differences were observed in VO2max changes over time between GGN groups. However, after accounting for VO2max changes (introduced as a covariate in the model) the observed differences in trunk fat mass accumulation showed only a trend to be statistically significant (p = 0.10), indicating that part of the observed differences in trunk fat mass accumulation between the GGNS and GGNL groups could be explained by the changes in VO2max.
A limitation of this study is the small number of subjects having extreme GGN. Despite this limitation, our conclusions are solid since they derive from the assessment of multiple factors influencing fat mass accumulation and not only from the changes in trunk fat mass. Our results are not masked by differences in lifestyle during the years of follow-up, since all groups showed similar physical activity levels.
In conclusion, the CAG repeat polymorphism seems to have little, if any, influence on leptin, fat mass and its regional distribution in healthy men. However, CAG repeat length was associated with lean mass and maximal fat oxidation capacity. In adults, a long GGN polymorphic variant may protect from fat mass accumulation, particularly in the trunk region. This could be in part explained by the higher MFO of men with the longest GGN repeat polymorphism.
Ethical approval
All procedures performed in studies involving human participants were in accordance with the ethical standards of the institutional and/or national research committee and with the Declaration of Helsinki of 1964 and its later amendments or comparable ethical standards.
References
1. Myers MG, Cowley MA, Munzberg H. Mechanisms of leptin action and leptin resistance. Annu Rev Physiol 2008;70:537-56. [ Links ]
2. Lee SW, Jo HH, Kim MR, You YO, Kim JH. Association between obesity, metabolic risks and serum osteocalcin level in postmenopausal women. Gynecol Endocrinol 2012;28:472-7. [ Links ]
3. Guadalupe-Grau A, Pérez-Gómez J, Olmedillas H, Chavarren J, Dorado C, Santana A, et al. Strength training combined with plyometric jumps in adults: Sex differences in fat-bone axis adaptations. J Appl Physiol 2009;106:1100-11. [ Links ]
4. Oury F, Sumara G, Sumara O, Ferron M, Chang H, Smith CE, et al. Endocrine regulation of male fertility by the skeleton. Cell 2011;144:796-809. [ Links ]
5. Ponce-González JG, Guadalupe-Grau A, Rodríguez-González FG, Dorado C, Olmedillas H, Fuentes T, et al. Androgen receptor gene polymorphisms and the fat-bone axis in young men and women. J Androl 2012;33:644-50. [ Links ]
6. Guadalupe-Grau A, Rodríguez-González FG, Dorado C, Olmedillas H, Fuentes T, Pérez-Gómez J, et al. Androgen receptor gene polymorphisms lean mass and performance in young men. Br J Sports Med 2011;45:95-100. [ Links ]
7. Guadalupe-Grau A, Rodríguez-González FG, Ponce-González JG, Dorado C, Olmedillas H, Fuentes T, et al. Bone mass and the CAG and GGN androgen receptor polymorphisms in young men. PLoS One 2010;5:e11529. [ Links ]
8. Nielsen TL, Hagen C, Wraae K, Bathum L, Larsen R, Brixen K, et al. The impact of the CAG repeat polymorphism of the androgen receptor gene on muscle and adipose tissues in 20-29-year-old Danish men: Odense Androgen Study. Eur J Endocrinol 2010;162:795-804. [ Links ]
9. Zitzmann M, Gromoll J, Von Eckardstein A, Nieschlag E. The CAG repeat polymorphism in the androgen receptor gene modulates body fat mass and serum concentrations of leptin and insulin in men. Diabetologia 2003;46:31-9. [ Links ]
10. Lee DK, Chang C. Endocrine mechanisms of disease. Expression and degradation of androgen receptor: Mechanism and clinical implication. J Clin Endocrinol Metab 2003;88:4043-54. [ Links ]
11. Ding D, Xu L, Menon M, Reddy GP, Barrack ER. Effect of GGC (glycine) repeat length polymorphism in the human androgen receptor on androgen action. Prostate 2005;62:133-9. [ Links ]
12. Ponce-González JG, Rodríguez-García L, Losa-Reyna J, Guadalupe-Grau A, Rodríguez-González FG, Díaz-Chico BN, et al. Androgen receptor gene polymorphism influence fat accumulation: A longitudinal study from adolescence to adult age. Scand J Med Sci Sports 2016;26:1313-20. [ Links ]
13. Skjaerpe PA, Giwercman YL, Giwercman A, Svartberg J. Androgen receptor gene polymorphism and the metabolic syndrome in 60-80 years old Norwegian men. Int J Androl 2010;33:500-6. [ Links ]
14. Gustafson DR, Wen MJ, Koppanati BM. Androgen receptor gene repeats and indices of obesity in older adults. Int J Obes Relat Metab Disord 2003;27:75-81. [ Links ]
15. Elosua R, Marrugat J, Molina L, Pons S, Pujol E. Validation of the Minnesota Leisure Time Physical Activity Questionnaire in Spanish men. The MARATHOM Investigators. Am J Epidemiol 1994;139:1197-209. [ Links ]
16. Vermeulen A, Verdonck L, Kaufman JM. A critical evaluation of simple methods for the estimation of free testosterone in serum. J Clin Endocrinol Metab 1999;84:3666-72. [ Links ]
17. Pérez-Gómez J, Olmedillas H, Delgado-Guerra S, Ara I, Vicente-Rodríguez G, Ortiz RA, et al. Effects of weight lifting training combined with plyometric exercises on physical fitness, body composition, and knee extension velocity during kicking in football. Appl Physiol Nutr Metab 2008;33:501-10. [ Links ]
18. Calbet JA, Chavarren J, Dorado C. Fractional use of anaerobic capacity during a 30- and a 45-s Wingate test. Eur J Appl Physiol Occup Physiol 1997;76:308-13. [ Links ]
19. Frayn KN. Calculation of substrate oxidation rates in vivo from gaseous exchange. J Appl Physiol 1983;55:628-34. [ Links ]
20. Ponce-González JG, Ara I, Larsen S, Guerra B, Calbet JA, Helge JW. Effect of regional muscle location but not adiposity on mitochondrial biogenesis-regulating proteins. Eur J Appl Physiol 2016;116:11-8. [ Links ]
21. Lietzke MH. Relation between weightlifting totals and body weight. Science 1956;124:486-7. [ Links ]
22. Zitzmann M, Brune M, Kornmann B, Gromoll J, Von Eckardstein S, Von Eckardstein A, et al. The CAG repeat polymorphism in the AR gene affects high density lipoprotein cholesterol and arterial vasoreactivity. J Clin Endocrinol Metab 2001;86:4867-73. [ Links ]
23. Goutou M, Sakka C, Stakias N, Stefanidis I, Koukoulis GN. AR CAG repeat length is not associated with serum gonadal steroids and lipid levels in healthy men. Int J Androl 2009;32:616-22. [ Links ]
24. Andersen ML, Guindalini C, Santos-Silva R, Bittencourt LR, Tufik S. Androgen receptor CAG repeat polymorphism is not associated with erectile dysfunction complaints, gonadal steroids, and sleep parameters: Data from a population-based survey. J Androl 2011;32:524-9. [ Links ]
25. Crabbe P, Bogaert V, De Bacquer D, Goemaere S, Zmierczak H, Kaufman JM. Part of the interindividual variation in serum testosterone levels in healthy men reflects differences in androgen sensitivity and feedback set point: Contribution of the androgen receptor polyglutamine tract polymorphism. J Clin Endocrinol Metab 2007;92:3604-10. [ Links ]
26. Mauras N, Hayes V, Welch S, Rini A, Helgeson K, Dokler M, et al. Testosterone deficiency in young men: Marked alterations in whole body protein kinetics, strength, and adiposity. J Clin Endocrinol Metab 1998;83:1886-92. [ Links ]
27. Rolf C, Von Eckardstein S, Koken U, Nieschlag E. Testosterone substitution of hypogonadal men prevents the age-dependent increases in body mass index, body fat and leptin seen in healthy ageing men: Results of a cross-sectional study. Eur J Endocrinol 2002;146:505-11. [ Links ]
28. Gibney J, Wolthers T, Johannsson G, Umpleby AM, Ho KK. Growth hormone and testosterone interact positively to enhance protein and energy metabolism in hypopituitary men. Am J Physiol Endocrinol Metab 2005;289:E266-71. [ Links ]
29. Rao PM, Kelly DM, Jones TH. Testosterone and insulin resistance in the metabolic syndrome and T2DM in men. Nat Rev Endocrinol 2013;9:479-93. [ Links ]
30. Lenz B, Heberlein A, Weinland C, Frieling H, Kornhuber J, Bleich S, et al. Androgen receptor polyglutamine length does not influence serum levels of adipocytokines in alcoholism: A preliminary retrospective analysis. Alcohol Alcohol 2011;46:214-6. [ Links ]
31. González Hernández A, Cabrera de León A, Domínguez Coello S, Almeida González D, Rodríguez Pérez MC, Brito Díaz B, et al. Serum resistin and polymorphisms of androgen receptor GAGn and GGNn and aromatase TTTAn. Obesity (Silver Spring) 2008;16:2107-12. [ Links ]
32. Bogaert V, Vanbillemont G, Taes Y, De Bacquer D, Deschepper E, Van Steen K, et al. Small effect of the androgen receptor gene GGN repeat polymorphism on serum testosterone levels in healthy men. Eur J Endocrinol 2009;161:171-7. [ Links ]
33. Hermann M, Berger P. Hormonal changes in aging men: A therapeutic indication? Exp Gerontol 2001;36:1075-82. [ Links ]
34. Voorhoeve PG, Van Mechelen W, Uitterlinden AG, Delemarre-van de Waal HA, Lamberts SW. Androgen receptor gene CAG repeat polymorphism in longitudinal height and body composition in children and adolescents. Clin Endocrinol (Oxf) 2011;74:732-5. [ Links ]
35. Nordby P, Saltin B, Helge JW. Whole-body fat oxidation determined by graded exercise and indirect calorimetry: A role for muscle oxidative capacity? Scand J Med Sci Sports 2006;16:209-14. [ Links ]
![]() Correspondence:
Correspondence:
Jesús Gustavo Ponce González.
Department of Physical Education.
Universidad de Las Palmas de Gran Canaria.
Campus Universitario de Tafira.
35017 Las Palmas de Gran Canaria, Spain.
e-mail: jesus.ponce.gonzalez@gmail.com
Received: 30/12/2016
Accepted: 04/05/2017

