


My SciELO
 Custom services
Services on Demand
Journal
Article
 English (pdf)
 Article in xml format
 Article references
 Send this article by e-mail
Indicators
-
 Cited by SciELO
 -
 Access statistics
Related links
-
 Cited by Google
 -
 Similars in
SciELO
Similars in
SciELO -
 Similars in Google
Share

 Permalink
Nutrición Hospitalaria
On-line version ISSN 1699-5198Print version ISSN 0212-1611
Nutr. Hosp. vol.34 n.5 Madrid Sep./Oct. 2017
https://dx.doi.org/10.20960/nh.890
TRABAJO ORIGINAL / Valoración nutricional
Combined assessment of nutritional status in patients with peritoneal dialysis using bioelectrical impedance vectors and malnutrition inflammation score
Evaluación combinada del estado de nutrición en pacientes con diálisis peritoneal mediante vectores de impedancia bioeléctrica y puntaje de inflamación y desnutrición
Elia Muñoz-Pérez1, María de los Ángeles Espinosa-Cuevas2, Paola Miranda-Alatriste2, Ricardo Correa-Rotter2 and Ximena Atilano-Carsi2
1Department of Medicine and Nutrition. Division of Health Sciences. Universidad de Guanajuato. Guanajuato, México.
2Department of Nephrology and Mineral Metabolism. Instituto Nacional de Ciencias Médicas y Nutrición Salvador Zubirán. Ciudad de México, México
ABSTRACT
Background and objective: Protein energy wasting (PEW) is a common syndrome in patients with chronic kidney disease, related to changes in hydration status, decreased food intake and inflammation. There are several tools for the assessment and diagnosis of such alterations. Bioimpedance vector analysis (BIVA) assess the state of nutrition and hydration, but not the inflammatory component, while the malnutrition inflammation score (MIS) comprises the inflammatory and nutritional factors, but not the state of hydration. The aim of the study was to determine the concordance between MIS and BIVA to assess nutritional status in peritoneal dialysis patients.
Methods: We studied 50 patients on peritoneal dialysis which underwent bioelectrical impedance measurements with an empty peritoneal cavity, also MIS was applied and biochemical parameters were evaluated.
Results: The prevalence of malnutrition with VIBE and MIS was 38% and 24% respectively. Statistically significant differences in body mass index (BMI) and phase angle between normally nourished and wasted patients by both methods were found. Body composition, biochemical parameters and impedance vectors were not statistically different between normally nourished and wasted patients. Concordance between methods was 0.314 (p = 0.019).
Conclusions: Combined nutritional assessment with MIS and BIVA is necessary for the diagnosis of protein energy wasting syndrome in patients undergoing peritoneal dialysis.
Key words: Protein energy wasting syndrome. Malnutrition. Peritoneal dialysis. Bioelectrical impedance vectors. Malnutrition inflammation score.
RESUMEN
Antecedentes y objetivo: el desgaste energético proteico (DEP) es un síndrome muy común en pacientes con enfermedad renal crónica, en el que están involucrados alteraciones en el estado de hidratación, descenso de ingestión alimentaria e inflamación. Existen diversas herramientas para la evaluación y detección de dichas alteraciones. Los vectores de impedancia bioeléctrica (VIBE) evalúan el estado de nutrición e hidratación, pero no el componente inflamatorio, mientras que el puntaje de inflamación y desnutrición (MIS) comprende los factores inflamatorio y nutricional, pero no el estado de hidratación. El objetivo del estudio fue determinar la concordancia entre MIS y VIBE para evaluar el estado de nutrición en pacientes en diálisis peritoneal.
Material y métodos: se estudió a 50 pacientes en diálisis peritoneal a los cuales se les realizaron mediciones de impedancia bioeléctrica con la cavidad peritoneal vacía, se aplicó el MIS y se evaluaron parámetros bioquímicos.
Resultados: la prevalencia de desnutrición por MIS y VIBE fue del 38% y 24% respectivamente. Se encontraron diferencias estadísticamente significativas en índice de masa corporal (IMC) y ángulo de fase entre pacientes normonutridos y desgastados por ambos métodos. Las variables de composición corporal y bioquímicas entre pacientes normonutridos y desgastados por ambos métodos, así como los vectores de impedancia, no fueron estadísticamente diferentes. Se encontró una concordancia entre métodos de 0,314 (p = 0,019).
Conclusiones: es necesaria la evaluación nutricia combinada con los métodos MIS y VIBE para un pertinente diagnóstico de desgaste energético proteico en pacientes en diálisis peritoneal.
Palabras clave: Síndrome de desgaste energético proteico. Desnutrición. Diálisis peritoneal. Vectores de impedancia bioeléctrica. Puntaje de inflamación y desnutrición.
Introduction
Protein energy wasting (PEW) is a multi-causal syndrome in which the decrease in nutritional intake, the systemic inflammation and alterations in the hydration status are involved. It is usually manifested as weight loss, depletion of muscle and fat reserves and volume overload. It is a common condition in patients with renal replacement therapy with a prevalence between 18 and 75% (1-6).
PEW has been associated with different clinical outcomes such as reduced quality of life, refractory anemia, fragility, sarcopenia, as well as high rates of hospitalization and mortality (1,2,6,7).
The evaluation of the nutrition and hydration status of the patients on dialysis, as well as the timely detection of PEW, are key elements for establishing clinical judgments, dictating diagnoses and designing a correct intervention strategy. There are several tools to evaluate nutritional status in patients on dialysis, however, each of them considers only some of the nutritional indicators that integrate the protein energy wasting syndrome.
The bioelectrical impedance method (BIA) has been extensively used in patients with renal diseases in recent years; however, in the scientific literature it has been shown that in patients with alterations in the hydration status there are biases in the results due to the use of prediction equations to estimate body composition in this methodology (3). Therefore, in patients with fluid retention, as is the case of renal patients, it is preferable to use bioimpedance vector analysis (BIVA) (7-9). In order to perform BIVA, the values ??of resistance (R) and reactance (Xc) are standardized by the patient's height to plot it after in a plane that allows identifying nutrition and hydration status clinically (8). However, this does not permit to know the inflammatory status of the patient. For the interpretation of BIVA, two axes are considered in the graph RXc. The major axis indicates state of hydration, while the minor axis makes reference to corporal tissues. The individual or group vectors located within the ellipses of 50 and 75% indicate a normal body composition, both in tissues and hydration, whereas those located outside the 75% ellipses represent alterations in body composition (10).
Another frequently used tool is the Malnutrition Inflammation Score (MIS), which allows the evaluation of the inflammation and malnutrition status of patients treated with dialysis (11,12). MIS takes some elements of subjective global assessment (SGA) and the malnutrition score in dialysis (MSD) (13) resulting in an instrument with ten items: five related to medical history, two relative to the physical examination, body mass index (BMI) and two corresponding to biochemical parameters. The sum of the score of these parameters places the patient on a scale from 0 to 30, where the higher the score, the higher the severity of wasting (13,14).
Although MIS is a widely used and validated tool (11), which considers the nutritional and inflammatory status, it does not consider the state of hydration as part of the PEW evaluation. On the other hand, BIVA allows to identify the nutritional and hydration status, but not the inflammatory component of it.
Therefore, the objective of the study was to determine the agreement between MIS and BIVA to evaluate the nutritional status in patients on peritoneal dialysis.
Methods
PATIENTS
A cross-sectional study was performed in patients with peritoneal dialysis (PD) of the National Institute of Medical Sciences and Nutrition Salvador Zubirán.
Fifty patients older than 18 years were included. Patients with amputees, metal implants, pacemakers, defibrillators or other biomedical instruments that prevented the correct measurement of bioelectrical impedance were excluded, as well as those who presented acute or critical illness. Patients who were hospitalized on the date of measurement, who did not attend the scheduled appointment or who did not meet the requirements for correct bioelectrical impedance measurement were eliminated (Fig. 1).

Patients were recruited at the renal replacement therapy outpatient consultation of the Nephrology Department at our hospital, as well as in the consultation for the peritoneal balance test between January and August 2015.
All patients who agreed to participate in the study and who signed the informed consent were scheduled for an appointment in which weight, height and bioelectrical impedance were taken; and MIS was applied. Age, diagnosis, time and type of dialysis, as well as biochemical parameters, were extracted from the clinical file.
ANTHROPOMETRIC AND MIOCHEMICAL EVALUATION
Weight was measured with an electronic scale, and height with a standard stadiometer according to international standardized techniques. The BMI was calculated and the cut-off points of the WHO were considered (15). The biochemical parameters considered as nutritional markers necessary for the application of the MIS tool were serum albumin and transferrin or total iron binding capacity. Serum creatinine was also considered as a marker of muscle mass reserve.
BIOELECTRIC IMPEDANCE
A single bioelectrical impedance measurement was performed to all patients with a Body Stat Quadscan 4000 equipment. Patients were fasting for six hours, with the peritoneal cavity empty and without jewelry, coins, glasses or other metallic objects. The patients were placed in supine position with the upper and lower limbs slightly separated from the trunk and each other. The electrodes were placed on the right extremities, current electrodes were placed on the back of the hand and foot near the phalanx-metacarpal and phalangeal-metatarsal joints, and the sensor electrodes were placed in the styloid process of the wrist and between the medial malleolus and lateral ankle. The values ??of resistance, reactance and phase angle were obtained with the Bodystat program.
Bioelectrical impedance vector analysis (BIVA) was used because it has been shown to be superior to conventional BIA in determining the hydration status of renal patients (7-9). This measurement was used to evaluate both, body tissue and the state of hydration of the patients. The standardized resistance and reactance were plotted on the tolerance ellipses of the Mexican population (9). In order to report the results in groups, we followed the methodology proposed by Piccoli et al. (16). Individual R and Xc values ??were transformed to Z score (Z [R] and Z [Xc]) based on the reference intervals of the Mexican population (9), which allows defining a set of tolerance ellipses independent of sex. Group vectors were plotted as the mean and 95% confidence intervals on the Z score. All vectors were obtained using BIVA Software 2002 (17).
Dehydration was considered when the vector was placed at the top and overhydration at the bottom, both outside the 75% ellipses. Vectors in the right quadrants outside the 75% ellipse were considered as tissue depletion or malnutrition, and those in the left quadrants, as excess of body tissues (obesity or increase of muscle mass and fat). The vectors located within the 50 and 75% ellipses were considered as normal (10).
MALNUTRITION INFLAMMATION SCORE
At the end of the impedance measurement, the MIS tool was applied by a single nutritionist in all cases to reduce information bias. The parameters considered by the MIS are:
1. Medical history: change in dry weight, dietary intake, gastrointestinal symptoms, functional capacity and comorbidity according to time on dialysis.
2. Physical exam: loss of fat deposits and lean mass.
3. Body mass index.
4. Biochemical parameters: albumin and transferrin or iron binding capacity (14).
According to the obtained score, two groups were considered: well-nourished patients (score < 5) and malnourished patients (score 6).
STATISTICAL ANALYSIS
Descriptive statistics were performed according to the distribution of the data. Quantitative variables are expressed as means ± standard deviation and qualitative variables, as percentage. For the comparison of means, the Student's t-test was applied, as well as the Hotteling's t2-test for the comparison of the impedance vectors. Finally, Kappa test was used to evaluate the concordance between the diagnosis made by BIVA and MIS.
Statistical package SPSS 16.0 was used for Windows, and in all cases p < 0.05 was considered as significant.
All measurements and data extraction from the clinical file were performed according to ethical standards and the Declaration of Helsinki.
Results
The general characteristics of the population are shown in table I. The distribution by sex was 48% women and 52% men with a mean age of 44.7 ± 17.0 years. The mean time on dialysis was 27.9 ± 25.5 months, being the most prevalent type the continuous ambulatory peritoneal dialysis (CAPD) in 74% of the cases. The most frequent renal disease etiology was unknown (36%), followed by diabetes (32%). The most common comorbidities were systemic arterial hypertension and diabetes mellitus (50% and 30%, respectively).

The mean BMI corresponded to normal weight while the phase angle was decreased. Regarding the biochemical parameters, both serum albumin and total iron binding capacity were found at the lower limit, whereas the creatinine concentration corresponded to an adequate muscular content.
According to the MIS, 38% of the patients (n = 19) presented malnutrition and 62% (n = 31), a normal nutritional status. In contrast, the percentage of malnutrition and normonutrition found by BIVA was 24% (n = 12) and 76% (n = 38) respectively.
Nutritional markers were compared between well-nourished and malnourished patients evaluated by MIS (Table II) and BIVA (Table III). Findings show that when patients were evaluated by MIS there were significant differences in weight, BMI, phase angle and serum albumin, whereas when evaluated by BIVA, differences in weight, BMI, phase angle and impedance were found. In patients with normal nutritional status, by either tool, both weight and BMI were higher as well as phase angle, compared to malnourished patients.
When comparing the patients diagnosed as well-nourished by MIS with those diagnosed as normal nutrition status by BIVA, no statistically significant differences were found in any of the nutritional parameters, both anthropometric and biochemical. No differences were found in patients diagnosed as malnourished with both methods as well.
The mean vectors of the group were plotted on the Z score to evaluate differences between patients diagnosed as well-nourished or malnourished by both methods. No significant differences between groups were found (Fig. 2).

Figure 3 shows the Z-score of the hydration status of the patients. We found that 42% of the population was on dry weight, while 52% had some degree of overhydration, these latter were located at the lower end of the major axis. Only three patients (6%) had dehydration, and were not represented graphically due to the small number of patients in this group (p < 0.0001).

Biochemical parameters were compared between dry weight, overhydrated or dehydrated patients. Serum albumin concentration was the only significant difference found within the three groups, which was lower in the group of patients with excess of body fluid.
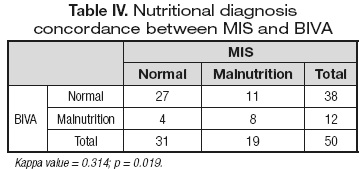
As mentioned above, no significant differences were found between the means of the nutritional parameters or the group vectors. However, this does not mean that both methods diagnosed the same manner; therefore, a concordance analysis of the nutritional diagnosis between the two methods was performed using the Kappa test. The concordance found between methods was 0.314 (p = 0.019), which indicates that it is not good enough even if there is an agreement point (Table IV).
Discussion
Malnutrition is a pathological condition frequently found in patients with alterations in renal function, being more evident in those receiving dialysis. Protein energy wasting has clinical implications that compromise both the patient's life and quality. Due to the complexity and multi-causality of this syndrome, it is important to have tools that allow a pertinent diagnosis, contemplating both the tissues and their hydration, as well as the inflammatory status. Currently, there is no single tool that values ??all these indicators by itself.
In this study we found a prevalence of malnutrition diagnosed by MIS of 38%, considerably lower than that found by Singh et al. (18) in Malaysia and Prasad et al. (19) in India, where the prevalence of malnutrition reached 90% and 74.9%, respectively. However, when considering other studies, the prevalence of malnutrition by MIS in our population is similar to that reported in the literature (20). The prevalence of malnutrition diagnosed by BIVA was 24%, which is lower than that found in other studies with different diagnostic tools (18-21). To our knowledge, there is no other study that has made the diagnosis of malnutrition using impedance vectors, so we cannot know if the prevalence reported here is similar to that of other populations.
The dialysis time of normonutrient patients was on average three months longer than in malnourished patients. Although it was not significantly different, the fact is striking. However, we consider that this small period of time does not condition any clinical differences between the groups.
Serum albumin concentrations (3.7 g/dl) of PD patients in China were very similar to those found in this study (21); however, the creatinine concentrations in our patients were higher than in other populations both Spanish (22) (11.9 vs 8.3 g/dl) and Korean (11.9 vs 8.6 mg/dl), which could indicate differences in body composition, nutritional status and dialysis dose. However, the Kt/V was not determined in our study. In patients under dialysis, the serum creatinine concentration is a reflex of muscle reserves, so we could say that our patients have adequate reserves of muscle.
On the other hand, serum albumin determination is not itself an indicator of nutritional status in dialysis patients due to the probable volume overload. The concentrations found in this study range from 3.5 g/dl in patients malnourished by MIS to 3.8 g/dl in well-nourished patients evaluated by the same tool, so it can be considered as a nutritional indicator despite the overhydration present in 52% of our patients.
Wakamiya et al. (24) found that undernourished PD patients assessed by the geriatric nutritional index had a lower serum albumin concentration compared to well-nourished patients (3.1 vs 3.8 g/dl), which was also found in our study when patients were evaluated by MIS, but not by BIVA. This is evident because the MIS considers albuminemia as a parameter within the evaluation, but not BIVA. On the other hand, hypoalbuminemia may reflect not only an inadequate nutritional status, but also an inflammatory status and/or overhydration, which in turn could cause alterations in the body compartments compatible with the wasting process.
The population in peritoneal dialysis compared to patients on hemodialysis are poorly studied. Among the investigations that evaluate the nutritional status in these patients, the majority used the SGA or nutritional indexes to establish the nutritional diagnosis. There are few studies using MIS to assess the nutritional status of patients with PD. Ho et al. (25) showed that the MIS scale is associated with increased cardiovascular and infectious risk as well as hospital admissions. Due to this latter, it is a tool that should be more used for the nutritional evaluation and diagnosis of patients with PD.
The values ??of R/H, Xc/H and phase angle in our study were very similar to those described by Koh et al. (26) in a group of Malaysian patients, which seems to indicate that the electrical characteristics and, therefore, body composition of this group of patients are similar. However, Demirci et al. (27) in Turkish population, as well as Di-Gioia (22) in Spanish patients, found slightly higher phase angles, which could be due to better nutrition and hydration status. In spite of this, it is important to note that in all the mentioned populations, phase angles are less than 6o, a cut-off point suggested for patients on peritoneal dialysis, which is related to lower mortality (28).
In our population, the low phase angle is related to lower reactance values, which is a reflection of cellularity and the integrity of the latter. Patients with some degree of malnutrition are known to have lower reactance values ??and phase angle.
The extension of the ellipses in the Z score reflects the heterogeneity of data: the larger it is, the greater the dispersion of these. In contrast, more compact ellipses indicate less variability. The ellipses corresponding to the patients identified as well-nourished were more compact, indicating that their body composition is less variable in relation to malnourished patients. The ellipses corresponding to the latter are much larger, reflecting the variability in body composition for the same nutritional diagnosis.
The use of impedance vectors is unusual for the nutritional evaluation of patients on peritoneal dialysis. Up to now there are no studies characterizing the body composition and nutritional status of these by means of impedance vectors; therefore, we cannot know if our results represent common vector patterns among patients with peritoneal dialysis.
The frequency over 50% of patients with overhydration in our study was much higher than that reported by Ventura et al. (29), who considered overhydration as an extracellular water content > 15% measured by conventional impedance, thus finding it present in only 6.6% of patients. On the other hand, our results are similar to those found by Sikorska et al. (30), based on the overhydration index, and Ronco et al. (31), using the excess liters of extracellular water, which found that 44% and 56.4% of the population respectively was overhydrated. Similarly to Hassan et al. (32), our study reported lower concentrations of serum albumin in the group of overhydrated patients compared to those with adequate hydration status. It is important to note that none of the studies mentioned above in relation to the evaluation of the hydration status were performed using impedance vectors, but with extracellular water determinations using conventional impedance, which may lead to inaccurate estimates of body composition due to the abnormal state of hydration presented by patients with chronic kidney disease. The impedance vectors allow to fully identify the hydration status of the patients, which has been widely tested in various studies and clinical conditions (33,34).
In relation to the number of patients diagnosed as well-nourished or malnourished, the greatest agreement between methods is in patients with an adequate nutritional status, whereas this decreases for malnourished patients; however, the kappa value is very low, which indicates a general poor agreement. According to nutritional diagnoses, we consider that BIVA is better for identifying well-nourished patients, whereas MIS is for wasted patients.
There are several possible reasons by which the two tools predict differently the state of nutrition and for which the agreement between methods was not satisfactory. In general, we can say that MIS considers the nutritional status and its inflammatory component, while the BIVA is much more influenced by the state of hydration. On one hand, MIS considers subjective parameters such as gastrointestinal symptoms, appetite, functional capacity and evaluation of the patient's fatty and muscular compartments, which may be influenced both by the patient's perception of well-being/discomfort and by the clinical capacity of the nutritionist or other member of the medical team conducting the evaluation.
Other important point that needs to be considered is that MIS assess albumin and body weight (weight loss and BMI) as parameters within the evaluation. Both may be affected not only by nutritional status but also by water overload, which could bias the diagnosis; however, a strength in considering albumin as part of the MIS assessment is that it may be an indirect reflection of the inflammatory process of patients, which has a special influence on the nutritional status and do not contemplate other diagnostic tools. The impedance vectors adequately identify overhydration, which is one of the multiple components involved in the development of wasting; however, its assessment is directly based on the electrical properties of the tissues. The resistance values ??depend on the length and diameter of the human body. It is important to remember that impedance considers the body as a circuit of five cylinders, filled with fluids, connected to each other, through which the electric current flows. Then, resistance depends on the length and diameter of each of the cylinders, being very different for the trunk due to the smaller length and larger diameter. These anatomical peculiarities could partially justify the differences in the nutritional diagnosis made by BIVA. With regards to this latter, Buffa et al. (35) suggest a modification to the impedance vector method using the length and diameter of each limb and trunk when the objective is particularly the estimation of body composition not the determination of hydration. For this latter purpose, the utility of the standard vectors, which we used in this study, is well proven.
Due to the lack of a gold standard to diagnose malnutrition in kidney disease patients, more studies to corroborate the utility of diagnostic tools available in the hospital setting are needed. Because of the high prevalence of malnutrition in subjects with renal impairment and the economic and clinical costs involved, it is necessary to have tools that adequately diagnose patients in order to provide a proper and timely treatment, avoiding thus subsequent complications. According to our results, there is no single tool itself that can diagnose correctly and that contemplates all the aspects involved in the development of wasting. We suggest the simultaneous use of MIS and impedance vectors, since the first allows the identification of wasting process with an important inflammatory component, while the second makes the recognition of states of overhydration, also related to the development of this syndrome, possible.
The limitations of this study are the small sample size as well as the recruitment of patients, which was only done in a dialysis center and is not representative of the entire population in peritoneal dialysis in Mexico. Another limitation was the lack of direct measurement of inflammatory parameters considered as an important component of the protein energy wasting process, which would have helped for a better characterization of the patients. However, in low income countries with limited resources such as ours, in which the determinations of these parameters are not usual in clinical practice, it is useful to have a tool such as MIS that indirectly estimates the involvement of inflammatory processes on the nutritional status of patients.
Our study is the first to use and compare MIS and BIVA for nutritional assessment and diagnosis in this group of patients. We believe that both MIS and impedance vectors are tools that should be used for evaluation and diagnosis of patients with PD.
Conclusion
This study documents the usefulness of performing a combined evaluation with MIS and BIVA methods for a more complete evaluation and pertinent diagnosis of PEW in patients on peritoneal dialysis.
Acknowledgements
We are grateful for the assistance provided by Dagoberto Hernández Acevedo in the translation of this text.
References
1. Fouque D, Kalantar-Zadeh K, Kopple J, et al. A proposed nomenclature and diagnostic criteria for protein-energy wasting in acute and chronic kidney disease. Kidney Int 2008;73(4):391-8. [ Links ]
2. Ikizler TA, Cano NJ, Franch H, et al. Prevention and treatment of protein energy wasting in chronic kidney disease patients: A consensus statement by the International Society of Renal Nutrition and Metabolism. Kidney Int 2013;84(6):1096-107. [ Links ]
3. Mak RH, Ikizler AT, Kovesdy CP, et al. Wasting in chronic kidney disease. J Cachexia Sarcopenia Muscle 2011;2:9-25. [ Links ]
4. Kopple JD. McCollum Award Lecture 1996: Protein-energy malnutrition in maintenance dialysis patients. Am J Clin Nutr 1997;65:1544-57. [ Links ]
5. Ikizler TA. A patient with CKD and poor nutritional status. CJASN 2013;8(12):2174-82. [ Links ]
6. Kalantar-Zadeh K, Ikizler TA, Block G, et al. Malnutrition-inflammation complex syndrome in dialysis patients: Causes and consequences. Am J Kidney Dis 2010;42(5):864-81. [ Links ]
7. Abad S, Sotomayor G, Vega A, et al. The phase angle of the electrical impedance is a predictor of long-term survival in dialysis patients. Nefrología 2011;31(6):670-6. [ Links ]
8. Piccoli A, Rosell LDNJ. Análisis convencional y vectorial de bioimpedancia en la práctica clínica. Nefrología 2002;22(3):228-38. [ Links ]
9. Espinosa-Cuevas MÁ, Rivas-Rodríguez L, González-Medina EC, et al. Vectores de impedancia bioeléctrica para la composición corporal en población mexicana. Rev Invest Clin 2007;59(1):15-24. [ Links ]
10. Piccoli A, Rossi B, Pillon L, et al. A new method for monitoring body fluid variation by bioimpedance analysis: The RXc graph. Kidney Int 1994;46(2):534-9. [ Links ]
11. González-Ortiz AJ, Arce-Santander CV, Vega-Vega O, et al. Assessment of the reliability and consistency of the "malnutrition inflammation score" (MIS) in Mexican adults with chronic kidney disease for diagnosis of protein-energy wasting syndrome (PEW). Nutr Hosp 2014;31(3):1352-8. [ Links ]
12. Riella MC. Nutritional evaluation of patients receiving dialysis for the management of protein-energy wasting: What is old and what is new? J Ren Nutr 2013;23(3):195-8. [ Links ]
13. Kalantar-Zadeh K, Kleiner M, Dunne E, et al. A modified quantitative subjective global assessment of nutrition for dialysis patients. Nephrol Dial Transpl 1999;14:1732-8. [ Links ]
14. Kalantar-Zadeh K, Kopple JD, Block G, et al. Malnutrition Inflammation Score is correlated with morbidity and mortality in maintenance hemodialysis patients. Am J Kidney Dis 2001;38(6):1251-63. [ Links ]
15. Organización Mundial de la Salud. Obesity: Preventing and managing the global epidemic. Ginebra: OMS; 2000. Serie de Informes Técnicos: 894. [ Links ]
16. Piccoli A, Codognotto M, Piasentin P, et al. Combined evaluation of nutrition and hydration in dialysis patients with bioelectrical impedance vector analysis (BIVA). Clin Nutr 2014;33(4):673-7. [ Links ]
17. BIVA Software. BIVA Tolerance file. Department of Medical and Sugical Sciences. Padova, Italy: University of Padova; 2002. [ Links ]
18. Singh G, Siew WC, Karupaiah T, et al. Dialysis Malnutrition and Malnutrition Inflammation Scores: Screening tools for prediction of dialysis-related protein-energy wasting in Malaysia. Asia Pac J Clin Nutr 2016;25(1):26-33. [ Links ]
19. Prasad N, Sinha1 A, Gupta A, et al. Validity of nutrition risk index as a malnutrition screening tool compared with subjective global assessment in end-stage renal disease patients on peritoneal dialysis. Indian J Nephrol 2016;26(1):27-32. [ Links ]
20. Bernardo A, Fonseca I, Rodrigues A, et al. Overweight rather than malnutrition is widely prevalent in peritoneal dialysis patients. Adv Perit Dial 2009;25:119-24. [ Links ]
21. Tsai AC, Wang JY, Chang TL, et al. A comparison of the full Mini Nutritional Assessment, short-form Mini Nutritional Assessment, and Subjective Global Assessment to predict the risk of protein-energy malnutrition in patients on peritoneal dialysis: A cross-sectional study. Int J Nurs Studies 2013;50:83-9. [ Links ]
22. Di-Gioia C, Gallar P, Rodríguez I, et al. Cambios en los parámetros de composición corporal en pacientes en hemodiálisis y diálisis peritoneal. Nefrología 2012;32(1):108-13. [ Links ]
23. Jin H, Shin JY, Lee SH, et al. Abdominal obesity and mortality in continuous ambulatory peritoneal dialysis patients. Electrolyte Blood Press 2015;13:22-9. [ Links ]
24. Wakamiya A, Hiraki K, Hotta C, et al. Poor nutritional status is associated with low physical activity in patients undergoing peritoneal dialysis. Int J Cardiol 2015;187:648-50. [ Links ]
25. Ho LC, Wang HH, Chiang CK, et al. Malnutrition-Inflammation Score independently determined cardiovascular and infection risk in peritoneal dialysis patients. Blood Purif 2010;30:16-24. [ Links ]
26. Koh KH, Wong HS, Go KW, et al. Normalized bioimpedance indices are better predictors of outcome in peritoneal dialysis patients. Perit Dial Int 2011;31(5):574-82. [ Links ]
27. Demirci M, Demirci C, Ozdogan O, et al. Relations between malnutrition-inflammation-atherosclerosis and volume status. The usefulness of bioimpedance analysis in peritoneal dialysis patients. Nephrol Dial Transplant 2011;26:1708-16. [ Links ]
28. Fein P, Gundumalla G, Jorden A, et al. Usefulness of bioelectrical impedance analysis in monitoring nutrition status and survival of peritoneal dialysis patients. Adv Perit Dial 2002;18:195-9. [ Links ]
29. Ventura P, Santos O, Teixeira L, et al. Overhydration prevalence in peritoneal dialysis - A 2 year longitudinal analysis. Nefrología 2015;35(2):189-96. [ Links ]
30. Sikorska D, Pawlaczyk K, Roszak M, et al. Preliminary observations on the association between serum IL-6 and hydration status and cardiovascular risk in patients treated with peritoneal dialysis. Cytokine 2016;85:171-6. [ Links ]
31. Ronco C, Verger C, Crepaldi C, et al. Baseline hydration status in incident peritoneal dialysis patients: The initiative of patient outcomes in dialysis (IPOD-PD study). Nephrol Dial Transplant 2015;30:849-58. [ Links ]
32. Hassan K, Hassan D, Shturman A, et al. The impact of sub-clinical over-hydration on left ventricular mass in peritoneal dialysis patients. Int J Clin Exp Med 2015;8(4):5890-6. [ Links ]
33. Norman K, Stobaüs N, Pirlich M, et al. Bioelectrical phase angle and impedance vector analysis - Clinical relevance and applicability of impedance parameters. Clin Nutr 2012;31:854-61. [ Links ]
34. Bronhara B, Piccoli A, Pereira JC. Fuzzy linguistic model for bioelectrical impedance vector analysis. Clin Nutr 2012;31(5):710-6. [ Links ]
35. Buffa R, Saragat B, Cabras S, et al. Accuracy of specific BIVA for the assessment of body composition in the United States population. PLoS ONE 2103;8(3):e58533. [ Links ]
![]() Correspondence:
Correspondence:
Ximena Atilano Carsi.
Department of Nephrology and Mineral Metabolism.
Instituto Nacional de Ciencias Médicas y Nutrición Salvador Zubirán.
Vasco de Quiroga, 15. Col. Sección XVI. Tlalpan.
14000 Ciudad de México, México.
e-mail: xime1879@hotmail.com
Received: 02/01/2017
Accepted: 04/05/2017

