


Mi SciELO
 Servicios personalizados
Servicios Personalizados
Revista
Articulo
 Inglés (pdf)
 Articulo en XML
 Referencias del artículo
 Enviar articulo por email
Indicadores
-
 Citado por SciELO
 -
 Accesos
Links relacionados
-
 Citado por Google
 -
 Similares en
SciELO
Similares en
SciELO -
 Similares en Google
Compartir

 Permalink
Nutrición Hospitalaria
versión On-line ISSN 1699-5198versión impresa ISSN 0212-1611
Nutr. Hosp. vol.34 no.6 Madrid nov./dic. 2017
https://dx.doi.org/10.20960/nh.1425
Classical and emergent cardiovascular disease risk factors in type 2 diabetics from the Vallecas area (DICARIVA study)
Factores de riesgo cardiovascular clásicos y emergentes en pacientes con diabetes mellitus tipo 2 del área de Vallecas (estudio DICARIVA)
Ángel García-Quismondo1, Francisco Javier del Cañizo2, Juan Dorado3 and Francisco J. Sánchez-Muniz1
1Department of Nutrition and Food Science (Nutrition). Facultad de Farmacia. Universidad Complutense. Madrid, Spain.
2Department of Endocrinology and Nutrition. Hospital Universitario Infanta Leonor. Madrid, Spain.
3Pertica. Valdemoro, Madrid. Spain
Financial support: The manuscript was partially supported by Project AGL 2014-53207-C2-2-R.
Author's contributions: F.J. Sánchez-Muniz is the corresponding author and Guarantor of the paper and has contributed to the study design, data discussion and writing of the paper. Ángel García-Quismondo has contributed to the data acquisition, analysis and discussion and writing of the paper, Francisco Javier del Cañizo has contributed to data acquisition and T2DM diagnosis and Juan Dorado has contributed to data analysis.
ABSTRACT
Background: Type 2 diabetes mellitus (T2DM) is a major independent risk factor for cardiovascular disease (CVD) and a highly prevalent disease with a wide variety of associated metabolic disorders.
Objectives: To describe features and prevalence of altered CVD risk factors in a T2DM population: DIabetes CArdiovascular RIsk of VAllecas (DICARIVA) study.
Patients and methods: 735 adult Spanish patients of the Vallecas area with T2DM from the Infanta Leonor Hospital (Madrid, Spain) were included in the study. Age, disease time-evolution, anthropometric measurements, glycemia, glucated haemoglobin A1c (HbA1c), lipid/lipoprotein profile, total cholesterol/high density lipoprotein cholesterol (HDL-cholesterol), low density lipoprotein cholesterol (LDL-cholesterol)/HDL-cholesterol and triglycerides/HDL-cholesterol ratios, triglycerides-glucose index (TyG), fibrinogen, high sensitivity-c reactive protein (hs-CRP) and microalbuminuria were assessed.
Results: Mean, standard deviations, and percentile distributions were obtained in males, females and the whole T2DM population for classical and emergent CVD risk markers. Obesity was found in 45% of patients, while 60% had high cardiovascular risk according to waist circumference and conicity index. Total and LDL-cholesterol were at desirable and optimum levels, respectively, in 60% of patients. One third showed the conjoint presence of low HDL-cholesterol, high triglycerides and small and dense LDL. Increased levels of hs-CRP, hyperfibrinogenia and microalbuminuria were detected in 40%, 50% and 30% of patients, respectively. Age, body mass index, total cholesterol, hs-CRP and fibrinogen were higher while weight, conicity index, total cholesterol/HDL-cholesterol, LDL-cholesterol/HDL-cholesterol and triglycerides/HDL-cholesterol ratios, and microalbuminuria lower in women. According to TyG values 62% of patients suffered metabolic syndrome.
Conclusions: Altered anthropometric and metabolic CVD risk factors were highly prevalent in the DICARIVA study. The CVD marker cut-off points obtained in some emergent markers seems relevant and would be employed for future early T2DM diagnoses strategy in order to reduce its high morbidity and mortality impact.
Key words: Type 2 diabetes mellitus. Cardiometabolic risk factors. Prevalences.
RESUMEN
Introducción: la diabetes mellitus tipo 2 (DMT2) es una enfermedad crónica con una amplia variedad de desórdenes metabólicos asociados.
Objetivos: describir las características y prevalencias de factores de riesgo cardiovascular alterados en el estudio DIabetes CArdiovascular RIsk of VAllecas (DICARIVA).
Pacientes y métodos: 735 pacientes adultos españoles con DMT2 se incluyeron en el estudio. Se obtuvo información sobre parámetros antropométricos, glucemia, hemoglobina glicosilada A1c (HbA1c), perfil lipídico y lipoproteico, cocientes de riesgo colesterol total/HDL-colesterol, LDL-colesterol/HDL-colesterol, cociente molar triglicéridos/HDL-colesterol, índice triglicéridos-glucosa (TyG), fibrinógeno, proteína C reactiva ultrasensible (hs-CRP) y microalbuminuria.
Resultados: se calculó la media, desviación estándar y percentiles de los factores, clásicos y emergentes relacionados con el riesgo cardiovascular para hombres, mujeres y el total de la población de pacientes con DMT2 estudiados. El 45% de los pacientes tenía obesidad y el 60% riesgo cardiovascular elevado atendiendo al perímetro de cintura y al índice de conicidad. En un 60% de los pacientes, los niveles de colesterol total y LDL-colesterol estaban en valores deseables y óptimos, respectivamente. Sin embargo, un tercio de los pacientes presentó conjuntamente bajos niveles de HDL-colesterol y elevados de triglicéridos y de LDL densas y pequeñas. Se detectaron niveles incrementados de hs-CRP, hiperfibrinogenia y microalbuminuria en 40%, 50% and 30% de los pacientes, respectivamente. Las mujeres tenían más edad, índice de masa corporal, niveles de colesterol total, hs-CRP y fibrinógeno, pero menos peso, índice de conicidad, cociente colesterol total/HDL-colesterol, LDL-colesterol/HDL-colesterol, cociente molar triglicéridos/HDL-colesterol y microalbuminuria que los hombres.
Conclusiones: en el estudio DICARIVA se detectó una elevada prevalencia de niveles alterados de marcadores antropométricos y de factores de riesgo cardiovascular. Los puntos de corte obtenidos en algunos de los factores de riesgo cardiovascular emergentes podrán emplearse en futuras estrategias diagnósticas que permitan reducir la alta morbimortalidad de esta patología.
Palabras clave: Diabetes mellitus tipo 2. Factores de riesgo cardiometabólicos. Prevalencias.
INTRODUCTION
Type 2 diabetes mellitus (T2DM) is the most common form of diabetes (90-95%) (1). It is characterized by chronic hyperglycemia as a consequence of disorders on insulin action and insulin secretion as the predominant feature (1). Cardiovascular disease (CVD) is the leading cause of mortality in the developed countries in spite of the declining trend observed (2). In T2DM patients the risk of death from CVD is 2-5 times higher than in non-diabetic persons (3). In Spain 30% of mortality is due to CVD (2), being DM considered as an independent CVD risk factor (3). A recent study estimated that for every point increase in glycated haemoglobin (HbA1c), the relative risk of CVD increases by 18% (4).
Besides the classic cardiovascular risk factors, others, called emergent factors, like C reactive protein (CRP), microalbuminuria and fibrinogen, have been associated to CVD. Currently, high sensitivity CRP (hs-CRP) is a major index of inflammatory activity and increased hs-CRP levels are found during atherosclerosis development (5). The triglyceride-glucose index (TyG) and the triglyceride/HDL-cholesterol ratio in turn, have been described as insulin resistance indicators (6). A good correlation between TyG and the homeostatic model assessment-insulin resistance (HOMA-IR) has been described (6). Thus, determining insulin resistance is becoming cheaper using TyG instead of the HOMA-IR.
Studies showing association between T2DM and CVD risk factors in a large and uniform population are scarce. Moreover previous cited markers are not usually included in the diagnosis or follow up of T2DM patients. The DICARIVA study was born to evaluate the cardiometabolic risk in a T2DM population, where emergent CVD risk factors, CRP, microalbuminuria, fibrinogen, the triglyceride/HDL-cholesterol and TyG, together with classical CVD risk factors, were included.
The present paper aims to ascertain in a relatively ample sample of male and female T2DM patients: a) levels of classical and emergent CVD risk factors; b) CVD risk factors prevalence; and c) the existing gender differences. Getting all these would permit to design earlier diagnosis strategies and the planning of more accurate treatments in those patients.
METHODS
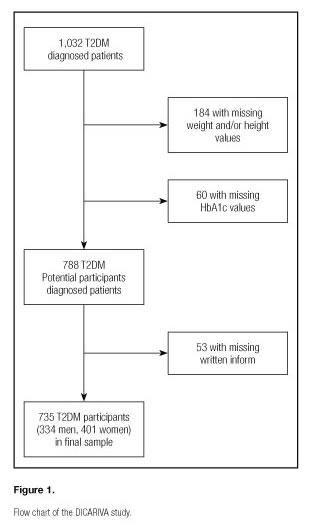
This observational, epidemiological and cross-sectional study was conducted in T2DM patients from the DIabetes CArdiovascular RIsk of VAllecas (DICARIVA) study and diagnosed in the Diabetes and Cardiovascular risk office at the Endocrinology and Nutrition Service of the Infanta Leonor Universitary Hospital in Madrid, Spain. This hospital gives medical support to approximately 350,000 people belonging to two Madrid districts: Puente de Vallecas y Villa de Vallecas. The study sample comprises 735 T2DM patients managed by endocrinologist (334 men and 401 women) out of 1,032 patients from Vallecas area filed in the hospital endocrinology office. A flowchart of study participants of the DICARIVA study is shown in figure 1. Patients included were chosen from the office endocrinology file according to the following inclusion criteria: > 18 years old, written informed consent signed and DMT2 diagnosed. The exclusion criteria were < 18 years old and DMT1 diagnosed. The selection was made within a confidentiality framework in accordance with the Declaration of Helsinki guidelines. Written informed consent was obtained from all patients. Data of age, gender, lipids, lipoprotein-lipids, CVD ratios, systolic and diastolic blood pressures were available in all of them. Patients without any of this data were excluded from the study. As the DICARIVA study is a cross-sectional study the time framework was short (three months).
Anthropometry
Height was obtained using a stadiometer (Holtain© LTD., Dyfed, UK) with patient barefoot and wearing light clothing. The head was adjusted in a way that an imaginary line crossed the auditory canal and the lowest part of the socket (Frankfurt plane). Body weight was obtained using an electronic weighing scale (SECA©alphaGmbH&Co., Igni, France). Body mass index was estimated using the formula body weight (kg)/height (meters) squared. Waist circumference was measured at the midpoint between the lowest rib and the iliac crest using a flexible non-stretch measuring tape (Holtain, Dyfed, UK).
The Conicity Index (Cindex) was estimated using the formula described by Valdez (7).
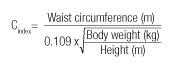
The Cindex has been associated with central obesity, having a theoretically expected range of 1-1.73. The Cindex is based on the estimate volume of the human body constructed to range between the shapes of a cylinder and a double cone assuming a constant body density.
The systolic and diastolic blood pressures were measured according to WHO guidelines (8) by trained personal after 10 minutes patients rest, with a mercury sphygmomanometer (Empire Riester©, Jungingen, Germany).
Laboratory measurements
Blood samples were collected from the antecubital vein after an overnight fast in the laboratory of the Hospital Infanta Leonor. Blood extraction sample was made by trained persons and the serum separated by centrifugation (Orto Arlesa 21; Madrid, Spain) at 3500 rpm for 20 minutes. Biochemical parameters were determined on serum in a Cobas Mira Plus of Roche biochemical autoanalyzer (Basel, Switzerland). Glucose, cholesterol, HDL-cholesterol and triglycerides were determined by enzymatic colorimetric methods (ELITech kits, Salon de Provenze, SEES, France). Low-density lipoprotein- (LDL-) cholesterol was calculated using the Friedewald et al formula (9) except for patients with triglyceride values ≥ 400 mg/dL in those the cLDL-Plus direct method was used (Hitachi 917 Roche Diagnostics©, Basel Switzerland).
Values of HbA1c were obtained by HPLC (Agilent 1100, Agilent technologies, Santa Clara, USA). Microalbuminuria by assessed by immunoturbidimetry (Wiener Laboratory, Rosario, Argentina) while fibrinogen was quantified by the von Clauss method (10) according to the National Committee for Clinical Laboratory Standards procedure. High sensitivity C reactive protein levels were measured by immunoturbidimetry (Wiener Laboratory, Rosario, Argentina).
Finally, the TyG index, as an insulin resistance biomarker, was calculated according to the formula (11):
TyG = Ln [Plasma triglycerides (mg/dL) * Fasting plasma glucose (mg/dL)/2]
Where TyG is the triglyceride-glucose index.
An external quality control was applied following the Spanish Association of Pharmacy Analysts (AEFA) guidelines for clinic laboratories and clinical practice.
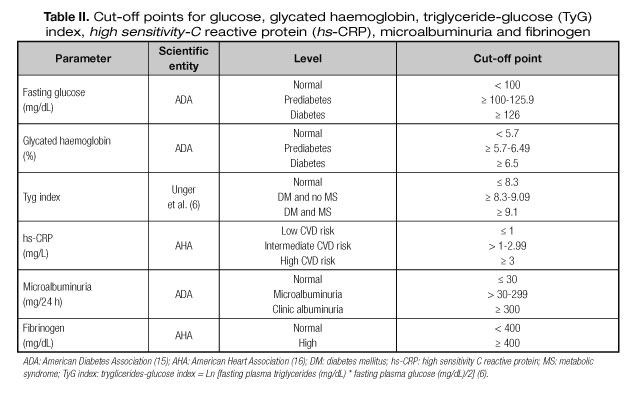
Cut-off points used
Tables I and II show the cut-off points used. These values were taken from consensus statements of different scientific associations (12-16) and the different data groups on anthropometric, biochemical parameters, lipid/lipoprotein profile and blood pressure originated. The adiposity markers were body mass index ≥ 30 kg/m2, waist circumference ≥ 80 cm for women and ≥ 94 cm for men; regarding the Cindex, and due to absence of established cut-off values, a value of > 1.30 (17,18) was adopted. We also selected the value 9.1 for TyG to classify patients with and without metabolic syndrome (6).

Statistical analyses
The sample representability was calculated according to the following formula
![]()
Where:
N = Total population (350,000)
Zα2= 1.962 (when 95% security was considered)
p = Expected prevalence (7% for T2DM = 0.07)
q = 1 - p (1-0.07 = 0.93)
d = accuracy (1.9% = 0.019).
Where n = 690
Thus, the sample of 735 T2DM studied in the Hospital Infanta Leonor can be considered representative of the total known number of T2DM of Vallecas at the level of 95% and for an error less than 1.9% considering a total of 350,000 persons in Vallecas. Similarly, the T2DM male and female populations studied were also representative of the total known number of T2DM males and females of Vallecas at the level of 95% and for an error less than 1.9%.
Data were described as mean ± SD, range, quartiles, and maximum and minimum values. Shapiro-Wilks and Kolmogorov-Smirnov tests were performed to assess normality distributions in all population and studied subgroups. Data groups were compared by the unpaired Student's t test, the Snedecor's F followed by the Student-Newman-Keuls post hoc, the Mann-Witney U test, the Kruskal-Wallis test and the chi-square test as appropriate. Statistical significance was set at p < 0.05 using the SPSS version 22.0 and the SAS version 9.2 statistical software packages.
RESULTS
Table III shows data about disease time-evolution, age and anthropometric data of the T2DM patients. The average disease duration was 11.4 years with lengthier evolution in women (p = 0.03). Twenty-five per cent of volunteers had > 17 years of T2DM evolution. Mean age was 65 years with 25% of patients being older than 75 years. Men were younger, heavier, and taller and showed higher Cindex (all p < 0.0001) but lower body mass index (p < 0.0001).
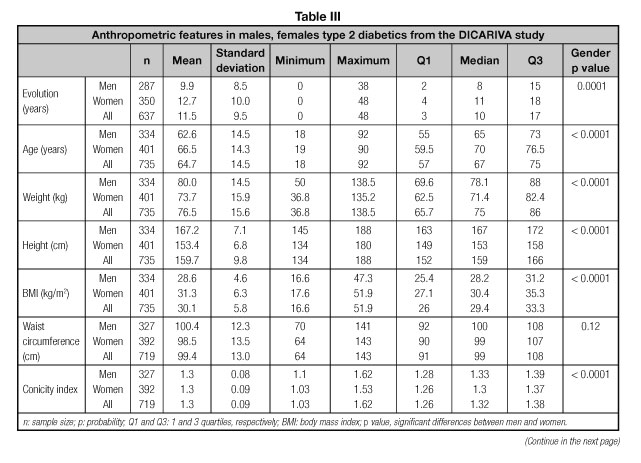

Total and HDL-cholesterol levels were higher (p < 0.0001) in women. Men showed higher triglycerides/HDL-cholesterol (p = 0.0012), total cholesterol/HDL-cholesterol (p < 0.0001) and LDL-cholesterol/HDL-cholesterol ratios (p < 0.0001).
Table IV shows data of blood pressures, fasting glucose, glycated haemoglobin, TyG and other emergent CVD risk factors. Diastolic blood pressure were virtually lower in men (p = 0.082). Higher microalbuminuria (p < 0.0001) but lower hs-CRP (p = 0.0006) and fibrinogen (p < 0.0001) levels were present in men.
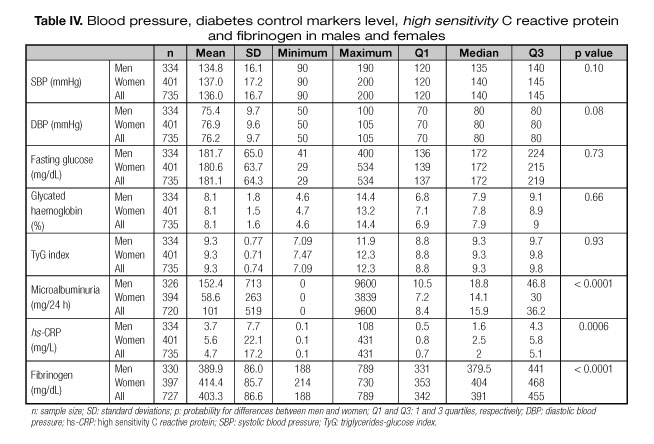
Table V gives information on the T2DM population regarding anthropometric markers classified according to the different scientific Societies criteria and the Cindex. Gender-significant differences were observed for the body mass index, waist circumference and Cindex population distribution (all, p < 0.0001). The obesity/overweight prevalence also shows gender differences (33.5%/45.5% in males vs. 53.9%/28.2% in females). Thirty-three women suffered from morbid and extreme obesity. The prevalence of patients at very-high-CVD risk according to the waist circumference was much higher in women than men (78 vs 40%, respectively). A high prevalence of T2DM patients with ≥ 10 years evolution was found.
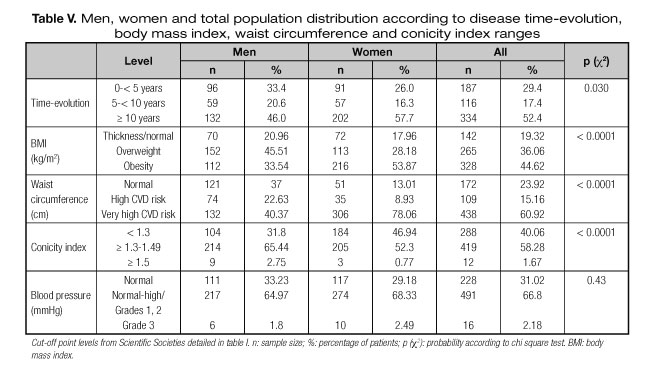
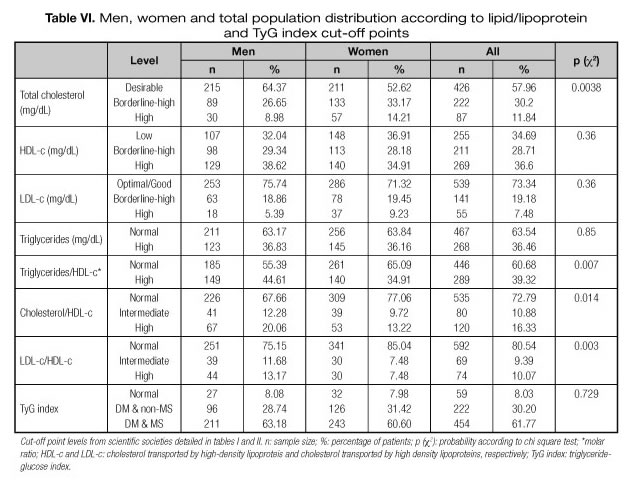
Table VI shows information on the different lipoprotein and diabetes control markers distribution in men and women. The values distribution within the cut-off points for total cholesterol (p = 0.0038), the triglyceride/HDL-cholesterol molar ratio (p = 0.007), the total cholesterol/HDL-cholesterol and LDL-cholesterol/HDL-cholesterol ratios (p = 0.014 and p = 0.003, respectively) were significantly different in both genders, with higher prevalence of elevated levels of these three ratios in males. Gender distribution differences were also observed for microalbuminuria (p = 0.0006), hs-CRP (p = 0.009) and fibrinogen (p = 0.0009), HbA1c being at the borderline for statistical differences (p = 0.058). The prevalence of women at the highest range for hs-CRP and fibrinogen was higher while that of microalbuminuria lower.
More than 90% of DICARIVA study T2DM were treated with oral hypoglycemic drugs and or/insulin and 77% with hypotensive drugs, while 12% received insulin plus biguanides plus statins suggesting polymedication for diabetes treatment and its comorbidities.
DISCUSSION
The broad sample of male and female T2DM patients studied is one of the important strength of the DICARIVA study. Moreover, we collected or measured all the variables directly at the hospital. In addition to disease time-evolution and several classic CVD risk factors, information about emergent CVD risk factors as TyG, microalbuminuria, CRP, fibrinogen was obtained and the prevalence of altered levels in both gender-populations calculated and compared. Due to the information of cut-off points in CVD emergent markers in T2DM is relatively unknown, the Q3 values obtained has relevant importance and can be used in future studies. However, some limitations should be considered, e.g., we did not have direct information on nutritional habits; nonetheless, some measurements tested, such as body mass index, waist circumference, total cholesterol, LDL-cholesterol, are closely related to nutritional habits.
The average time of the T2DM evolution was 11.4 years, four years more than the observed by others (19). This disease time-evolution appeared not associated with higher values of the different markers studied. We do not have any clear hypotheses for those findings, as several aspects can be at work (familiar antecedents, drugs treatment, etc.).
Anthopometric parameters
In agreement with other studies conducted in T2DM patients (19) the anthropometric markers were clearly elevated. Patients showed lower weight, body mass index, waist circumference and height and higher disease evolution time than those included in the Rodriguez Bernardino et al. study (19). Weight, height, and waist circumference were higher in men but body mass index lower (19) and, as Tonding et al. (17) pointed out, lower Cindex was found in females.
According to the waist circumference a similar value distribution was found in both sexes. However, according to their respective cut-points, central obesity, and thus, high CVD risk was more prevalent in women. However this risk would be ameliorated by other factors (e.g., estrogen, genetic, age) and would be assessed in future studies.
According to body mass index, excess of fat mass (overweight and obesity) was present in 80% of the patients, in line with other findings (20), suggesting a cluster of obesity and T2DM. Elevated or very elevated waist circumference values were found in three out of four patients, this prevalence being much higher than that of non-diabetic Spanish population (21) suggesting that most of T2DM patients were at elevated CVD risk, as waist circumference shows a good predictive value for CVD risk. According to the Cindex, the prevalence of patients at elevated CVD risk was larger than that observed by others (17), although the cut-off point selected in the present study (1.3) was slightly higher. A Cindex of 1.18-1.2 has been suggested as a threshold for CVD risk and mortality increase by other investigators (18). If we compare the Cindex with other methods of calculation of abdominal obesity we see that it brings some significant advantages over the most commonly used, waist circumference and body mass index. Regarding the first, conicity index prevents different interpretations according to race or ethnic group concerned and possible errors attributed to "eye of the beholder" (different persons measuring). Regarding the body mass index, it is not as specific as the Cindex rating visceral fat. In addition, some authors attribute to Cindex better discriminating power of coronary risk (18). As Cindex is directly related to abdominal fat distribution and, in turn to CVD risk, the Q3 values obtained in the study (1.39 in men and 1.37 in women) are proposed as cut-off points for future CVD risk in T2DM patients.
Lipid/lipoprotein profile, CVD risk ratios, TyG, and blood pressure
Although triglycerides and the triglycerides/HDL-cholesterol molar ratio showed elevated levels, total and LDL-cholesterol were relatively low both in men and women with 58% and 73% showing desirable or adequate values. The triglycerides/HDL-cholesterol molar ratio is indicative of LDL size and atherogenicity, being a relevant feature of diabetic dyslipemia (22). In T2DM the concentration of small LDL increases in spite of LDL-cholesterol one that remains normal or reduced; it means that LDL-cholesterol values could be misleading because they do not reflect the number of these atherogenic particles (22). In fact in the DICARIVA study, the prevalence of high LDL-cholesterol values was only 7.5%. Due to the relevance of the triglyceride/HDL-cholesterol molar ratio already commented the Q3 values obtained in the study (1.9 in men and 1.7 in women) are proposed as cut-off points for future CVD risk in T2DM patients.
CVD risk is elevated in T2DM (22) due to the presence of the Atherogenic Lipid Triad. The main features of this triad are: high levels of triglycerides, reduced value of HDL-cholesterol and elevated number of small dense and more oxidizable LDL particles (22). In spite of having relative low LDL-cholesterol levels, males presented triglycerides/HDL-cholesterol ratio higher than females suggesting a major CVD risk due to the increased presence of those more atherosclerotic LDL particles. The Atherogenic Lipid Triad was present in 18% of patients; almost 35% had reduced HDL-cholesterol levels, 36% presented hypertriglyceridemia, and 39% had elevated triglycerides/HDL-cholesterol ratio.
The total cholesterol/HDL-cholesterol ratio seems to be a better marker than LDL-cholesterol/HDL-cholesterol ratio, mainly if strong hypertriglyceridemia (> 400 mg/dL) is present and LDL-cholesterol levels have been calculated by Friedewald et al. formula (9). On the other hand, the association of CVD risk to elevated total cholesterol/HDL-cholesterol or LDL-cholesterol/HDL-cholesterol ratio increases dramatically in presence of hipertriglyceridemia (22). Both total cholesterol/HDL-cholesterol and LDL-cholesterol/HDL-cholesterol ratios were similar to those found in other studies (23). Frequently CVD risk ratios are higher in males than in females in diabetic and non-diabetic populations. Hypercholesterolemia but not hypertriglyceridemia was more prevalent in women. Triglycerides levels are elevated during menopause, partially explaining the gender comparable triglyceride levels and prevalences of hypertriglyceridemia found in this study.
Females tended to have higher diastolic blood pressures. Blood pressure levels were, roughly, 4 mmHg lower than in other studies (19). Normal-high/moderate hypertension was found in 66% of patients while 2% presented severe hypertension, suggesting increased CVD risk. Rodríguez Bernardino et al. (19) reported that hypertension was present in 70.8% patients, probably related to the low antihypertensive treatment compliance as was reported in some cross-sectional studies in Spain. According to WHO, hypertension is responsible for, at least, 45% of deaths due to heart disease and 51% of deaths due to stroke (24).
More than 60% men and women presented metabolic syndrome according to the TyG values (6). These results agree with the high prevalence of obesity, hyperglycemia, dyslipemia and blood pressure observed in the DICARIVA study. As TyG has been recognized to be a good insulin resistance marker (11), and no significant differences were found for TyG between male and female, the Q3 values obtained for all studied patients (9.8) is proposed as cut-off points for future CVD risk and insulin resistance in T2DM patients.
Fasting plasma glucose, HbA1c, hs-CRP, microalbuminuria, and fibrinogen
Average fasting plasma glucose and HbA1c levels were far away from optimal values. The prevalence of T2DM patients with HbA1c ≥ 6.5% was 85%, suggesting a bad diabetes control and increased CVD risk (4,25) in a very high percentage of volunteers. HbA1c is considered a better indicator of future CVD event than fasting glycemia (25). Both fasting plasma glucose and HbA1c values were higher than in other studies (17,19), but lower than in other study in which similar disease time-evolution was reported (26).
The prevalence of microalbuminuria in the total population was high (36% in men and 25.4% in women) in line with other studies on T2DM patients (27). According to the HOPE study, global mortality, myocardial infarction, stroke or CVD mortality are higher in diabetic patients showing microalbuminuria (27). Any degree of microalbuminuria, persistent or clinic, has been associated with increased risk of CVD events.
The high prevalence found for elevated hs-CRP levels was in line with almost all scientific literature, although conclusions are not coincident in all of them. In concordance with Bruno et al. (28) hs-CRP levels suggest a higher inflammatory status in women. According to hs-CRP cut-off points two third of patients were at elevated or medium CVD risk (60.5% males and 70.3% females), confirming the association between T2DM and hs-CRP (29). Almost a half of the patients were at elevated CVD risk according to their fibrinogen levels. Higher hyperfibrinogenia in women has been also reported by others (30). The Q3 values obtained in the study for hs-CRP (4.3 mg/L in men and 5.8 mg/L in women) and for fibrinogen (441 mg/dL in men and 468 mg/dL in women) are proposed as cut-off points for future CVD risk in T2DM patients.
As commented, the presence of toxic habits was relatively frequent among the patients, suggesting the need to control and reduce alcohol and tobacco consumption and to increase physical activity in those T2DM patients. The high prevalence of altered markers contrasts with the relatively high drug consumption of these patients as most of them were treated with oral hypoglycemic drugs and or/insulin and with hypotensive drugs. This fact seems paradoxical but, as commented, it suggests low treatment compliance (19). The conjoin treatment with insulin plus biguanides plus statins in one tenth of DICARIVA participants suggests polymedication for diabetes and its comorbidities treatment.
In conclusion most of the classic and emergent CVD risk factors, particularly the Atherogenic Lipidic Triad, were altered in the DICARIVA study suggesting the presence of several metabolic disorders and CVD risk within this diabetic population. Significant differences by gender were found in some of the indicators but not in HbA1c. As the information of cut-off points in CVD emergent markers in T2DM is relatively unknown, the Q3 values obtained for Cindex, TyG, hs-CRP, TG/HDLc molar ratio and fibrinogen are proposed to be included as tools for future studies in T2DM.
Therefore, early diagnoses strategy and T2DM drug treatment compliance follow up, together with lifestyle behavior control are needed to avoid or at least to decrease the high CVD risk found in is population.
REFERENCES
1. Vaidya V, Gangan N, Sheehan J. Impact of cardiovascular complications among patients with Type 2 diabetes mellitus: a systematic review. Pharmacoecon Outcomes Res 2015;15(3):487-97.
2. World Health Organization (WHO). Cardiovascular Disease (CVDs). Available at: www.who.int/mediacentre/factsheets/fs317/ (visited in 2016).
3. Almdal T, Scharling H, Jensen JS. The independent effect of type 2 diabetes mellitus on ischemic heart disease, stroke and death: a population-based study of 13,000 men and women with 20 years of follow-up. Arch Intern Med 2004;164:1422-6.
4. Di Angelantonio E, Gao P, Khan H, Butterworth AS, Wormser D, Kaptoge S, et al. Emerging Risk Factors Collaboration. Glycated hemoglobin measurement and prediction of cardiovascular disease. JAMA 2014;311:1225-33.
5. Kushner I. C-Reactive protein and atherosclerosis. Science 2002;297:520-1.
6. Unger G, Benozzi S, Perruzza F, Pennacchiotti G. Triglycerides and glucose index: a useful indicator of insulin resistance. Endocrinol Nutr 2014;61(10):533-40.
7. Valdez RA. Simple model-based index of abdominal adiposity. J Clin Epidemiol 1991;44:955-6.
8. 1999 World Health Organization-International Society of Hypertension. Guidelines for the management of hypertension: Guidelines Subcommitee. J Hypertens 1999;17:151-83.
9. Friedewald WT, Levy RI, Fredrickson DS. Estimation of the concentration of low-density lipoprotein cholesterol in plasma, without use of the preparative ultracentrifuge. Clin Chem 1972;18:499-502.
10. Von Clauss A. Gerinnungs Physiologische Schnell method zur Bestimmung des Fibrinogens. Acta Haematol 1957;17:237-46.
11. Guerrero-Romero F, Simental-Mendia LE, González-Ortiz M, Martínez-Abundis E, Ramos-Zavala MG, Hernández-González SO, et al. The product of triglycerides and glucose, a simple measure of insulin sensitivity. Comparison with the euglucemic-hyperinsulinemic clamp. J Clin Endocrinol Metab 2010;95:3347-51.
12. Sociedad Española para el Estudio de la Obesidad (SEEDO). Consenso SEEDO'2000 para la evaluación del sobrepeso y la obesidad y el establecimiento de criterios de intervención terapéutica. Med Clin (Barc) 2000;115:587-97.
13. Grundy SM, Cleeman JI, Daniels SR, Donato KA, Eckel RH, Franklin BA, et al. Diagnosis and management of the metabolic syndrome an American Heart Association/National Heart, Lung, and Blood Institute scientific statement. Circulation 2005;112(17):2735-52.
14. Mancia G, Fagard R, Narkiewicz K, Redon J, Zanchetti A, Böhm M, et al. 2013 ESH/ESC guidelines for the management of arterial hypertension: the Task Force for the Management of Arterial Hypertension of the European Society of Hypertension (ESH) and of the European Society of Cardiology (ESC). Blood Pressure 2013;22(4):193-278.
15. American Diabetes Association (ADA). Standards of medical care in diabetes-2015. Diabetes Care 2015;38(Suppl 1):S1-S93.
16. Pearson TA, Mensah GA, Alexander RW, Anderson JL, Cannon RO, Criqui M, et al. Markers of inflammation and cardiovascular disease application to clinical and public health practice: a statement for healthcare professionals from the centers for disease control and prevention and the American Heart Association. Circulation 2003;107(3):499-511.
17. Tonding SF, Silva FM, Antonio JP, Azevedo MJ, Canani LH, Almeida JC. Adiposity markers and risk of coronary heart disease in patients with type 2 diabetes mellitus. Nutrition J 2014;13:124.
18. Almeida RT, Guimaraes de Almeida MM, Araujo TM. Obesidad abdominal y riesgo cardiovascular: Desempeño de indicadores antropométricos en mujeres. Arq Bras Cardiol 2009;92(5):362-7.
19. Rodríguez Bernardino A, García Poblavieja P, Reviriego Fernández J, Serrano Ríos M. Prevalencia del síndrome metabólico y grado de concordancia en su diagnóstico en pacientes con diabetes mellitus tipo 2 en España. Endocrinol Nutr 2010;57(2):60-70.
20. López de la Torre M, Bellido D, Vidal J, Soto A, García K, Hernández-Mijares A. Distribución de la circunferencia de cintura y de la relación circunferencia de cintura respecto a la talla según la categoría del índice de masa corporal en los pacientes atendidos en las consultas de endocrinología y nutrición. Endocrinol Nutr 2010;57(10):479-85.
21. Rodríguez-Rodríguez E, López-Plaza B, López-Sobaler AM, Ortega RM. Grupo de Investigación UCM920030. Prevalencia de sobrepeso y obesidad en adultos españoles. Nutr Hosp 2011;26(2):355-63.
22. Carmena R. Dyslipemia in type 2 Diabetes Mellitus. In: Type 2 diabetes mellitus. Serrano Ríos M, Gutiérrez Fuentes JA, editors. Amsterdam: Elsevier; 2010. pp. 219-30.
23. Vasan RS, Larson MG, Leip EP, Evans JC, O'Donell CJ, Kannel WB, et al. Impact of high-normal blood pressure on the risk of the cardiovascular disease. N Engl J Med 2001;341:1291-7.
24. Causes of Death (online database). World Health Organization. Geneva; 2008. Avalilable at: http://www.who.int/healthinfo/global_burden_disease/cod_2008_sources_methods.pdf
25. DECODE Study Group, on behalf of the European Diabetes Epidemiology Group. Glucose tolerance and cardiovascular mortality: comparison of fasting and 2-h diagnostic criteria. Arch Intern Med. 2001;161:397-404.
26. Balkau B, Calvie-Gries F, Freemantle N, Vincent M, Pilorget V, Home PD. Predictors of HbA1c over 4 years in people with type 2 diabetes starting insulin therapies: The CREDIT study. Diabetes Res Clin Pract 2015;108:432-40.
27. Gerstein HC, Mann JF, Yi Q, Zinman B, Dinneen SF, Hoogwerf B, et al; HOPE Study Investigators. Albuminuria and risk of cardiovascular events, death and heart failure in diabetic and non-diabetic individuals. JAMA 2001;286:421-6.
28. Bruno G, Fornengo P, Novelli G, Panero F, Perotto N, Segre O, et al. C-reactive protein and 5-year survival in type 2 diabetes. The Casale Monferrato Study. Diabetes 2009;58:926-33.
29. Del Cañizo FJ, Moreira MN. C-reactive protein in obese patients with type 2 diabetes mellitus and metabolic syndrome. Atherosclerosis 2008;9(1):117.
30. Maresca G, Di Blasio A, Marchioli R, Di Minno G. Measuring plasma fibrinogen to predict stroke and miocardial infarction: an update. Artherioscler Thromb Vasc Biol 1999;19:1368-77.
 Correspondence:
Francisco J. Sánchez-Muniz.
Departamento de Nutrición y Ciencias de los Alimentos (Nutrición).
Facultad de Farmacia.
Universidad Complutense de Madrid. Madrid, Spain.
e-mail: frasan@ucm.es
Received: 13/07/2017
Accepted: 15/10/2017

