


 Serviços customizados
 Inglês (pdf)
 Artigo em XML
 Referências do artigo
 Enviar este artigo por email
 Citado por SciELO
  Citado por Google
  Similares em
SciELO
Similares em
SciELO  Similares em Google
 Permalink
INTRODUCTION
Obesity is characterized by excessive accumulation of body fat 1 and represents a serious public health issue due to its trend of increasing prevalence and the impact it has on society 2. Body mass index (BMI) has been the most frequently used method to define excess body weight; however, it is unable to differentiate between lean mass and fat mass 3 and so central obesity measures have been recently recommended due to a strong association with morbidity and mortality 4) (5) (6.
Abdominal adiposity is defined as the accumulation of intra-abdominal fat and it has been considered as an important risk factor for major chronic non-communicable diseases (NCDs) 7. Although there are sophisticated methods for evaluating abdominal fat, from an epidemiological point of view, the anthropometric indicators are considered for being used in population studies due to their low cost and ease of use 8. Waist circumference, waist-to-hip ratio and waist-to-height ratio are alternative proposals for the detection of abdominal obesity and have been strongly associated with cardiometabolic risk 5. However, even though there is consensus about the importance of measuring such anthropometric measures, epidemiological studies have not been able to demonstrate the measure or index that shows a better association with unhealthy behavioral patterns 7) (9) (10, making it necessary to carry out further studies that compare these indices to verify which one is more associated with behavioral patterns.
Studies in some countries have shown that abdominal adiposity in adults has increased over the past few years 11) (12) (13. This increase is attributed to changes in eating patterns and physical activity, increased stress and endocrine disruptors 14, and socioeconomic factors such as education level, income and occupation 8. Adequate dietary intake of fruits and vegetables and level of leisure physical activity, no smoking and no alcohol consumption has been associated to a lower risk of abdominal obesity 15) (16)(17.
The exploratory factor analysis has been increasingly used since this technique allows to identify the clustering of variables, showing the interrelations among them 18) (19.
However, in nutritional epidemiology, most of the published papers that used this technique have focused on the clustering of foods/nutrients in the definition of dietary patterns 20) (21, rather than on identifying abdominal adiposity risk or protection patterns by clustering behavioral and dietary variables. In addition, some unhealthy behaviors may interact, producing an even greater risk than the individual ones 22.
However, studies that make associations between abdominal adiposity risk or protection factors are rare and inconclusive 23) (24. Therefore, it is of great importance to identify behavioral risk and protection patterns in predicting abdominal obesity so that intervention strategies to prevent and to control this type of worsening may be better targeted, with actions that promote health.
MATERIAL AND METHODS
This work is an epidemiological cross-sectional designed study conducted in the urban area of the city of Viçosa, Brazil, from September 2012 to April 2014. It was carried out by the health and nutrition study group of Viçosa (ESA/Viçosa). Data collection involved two steps: visits to the subjects' residences with the application of a structured questionnaire and anthropometric measurements on the university facilities. The fieldwork flow and all instruments used in the data collection were previously calibrated and tested in a pilot study 25) (26.
The study sample was made up of adults of both sexes; 50.8% were women, from 20 to 59 years old. For sample calculation, the formula for prevalence estimates was used, considering the total number of individuals between 20 and 59 years old living in the urban area of Viçosa, totaling 43,431 people 27, an estimated prevalence of 50% (since this study is part of a thematic research project where other outcomes were analyzed), confidence level of 95%, sampling error of 4.1 percentage points and estimated deff (design effect sampling per cluster) of 1.55. An increase of 20% occurred for losses and refusals, and 10% for control of confusion factors. By using Epi-Info, version 3.5.2(r) 28, calculations evidenced a minimal sample size (n) of 1,137 participants.
The following were considered as exclusion criteria: pregnant women, postpartum women, bedridden individuals or those unable to be measured, and individuals with cognitive/intellectual difficulty or who were not able to answer the questionnaire. Individuals who reported having a previous diagnosis of diabetes or cardiovascular disease were not excluded from this study because the prevalence of these outcomes was considered to be low.
Two-stage cluster sampling was carried out. First, census sectors were randomly selected. After that, a block and a corner were selected, from which fieldwork was started in a clockwise direction. Thirty census sectors were randomly selected from 99 census sectors existing in Viçosa by simple random sampling with no replacement.
The information collected from the questionnaire consisted of social-demographic characteristics, food intake, physical activity level, alcohol consumption and smoking. The questions used in this survey were based on the Surveillance System of Risk and Protective Factors for Non Communicable Diseases through Telephone Interviews (Vigilância de Fatores de Risco e Proteção para Doenças Crônicas por Inquérito Telefônico, VIGITEL) 26, held annually in Brazil. The anthropometric measurements used in this study were performed by measuring the height and the circumferences of waist and hip 29.
The social demographic variables were as follows: age (completed years), education degree in completed years of study (defined as 0-3, 4-7, and ≥ 8 years of schooling) and socioeconomic status, determined by tools of the Brazilian Association of Research Companies 30 and classified into A and B, C and D and E.
The risk behavior indicators for abdominal adiposity included in this study were: smoking, abusive consumption of alcoholic beverages, excessive screen time, consumption of sugar-sweetened beverages at least five times a week, considered regular, and habit of consuming saturated fat source food, such as whole milk, red meat with visible fat and poultry skin.
Smoking was categorized into smokers, former smokers and non-smokers, regardless of the frequency and intensity of using tobacco 31. The abusive consumption of alcohol was considered as present when the intake of at least five shots in a single sitting occurred, based on the reference of the past 30 days for men and at least four for women. The standard was considered as the consumption of half a bottle or a can of beer, a glass of wine or a shot of distilled drink 32. The screen time was evaluated by summing the time the individual spent watching television or using the computer on weekdays and weekends. The cut-off point, indicator of a sedentary behavior, was the sum of the time longer than or equal to four hours a day watching TV or using the computer 33.
Among the behavioral indicators related to protective factors for abdominal adiposity, the following were included: the appropriate level of physical activity in leisure time and regular consumption of fruits, fresh fruit juices, raw salads, cooked vegetables and beans.
The level of physical activity during leisure time was assessed by the specific section of the long version of the International Physical Activity Questionnaire. The cut-off for physical activity practice time longer than or equal to 150 minutes per week to classify individuals as physically active 34 was used. Dietary intake associated with protection for abdominal adiposity was regarded from the report of intake of fruits, fresh fruit juices, vegetables and beans for at least five days a week, which was considered as regular consumption.
Abdominal adiposity was evaluated by means of anthropometric parameters of waist circumference (WC), waist-to-hip ratio (WHR) and waist-to-height ratio (WHER). Waist circumference was measured by using an nonelastic 2-m long measuring tape (Sanny(r), São Paulo, SP, Brazil), the measurement being made at the midpoint between the iliac crest and the last rib. Hip circumference was measured at the most protuberant area of the buttocks, and height was measured by a fixed rod stadiometer (Welmy(r), in wall, Santa Bárbara D'Oeste, SP, Brazil), with a length of 2.5 m and resolution of 0.1 cm.
The cut-offs used were those proposed by Grundy et al. 35 to determine the prevalence of abdominal adiposity based on the evaluation of waist circumference, which considers that men with a WC ≥ 90 cm and women with a WC ≥ 80 cm have central obesity. WHR was determined by the following equation: [WHR = WC/hip circumference (cm)], and the cut-offs used were men with a ratio ≥ 1 and women ≥ 0.85 were considered as having central obesity 36. The cut-offs proposed by Ashwell and Hsieh 37, which consider that values ≥ 0.5 for men and women indicate abdominal adiposity, were used to determine adiposity prevalence from the evaluation of the waist-to-height ratio. Measurements were performed in triplicate by a single evaluator, using the average of the measurements in the analysis.
For the identification of behavioral patterns, the methodology of exploratory factor analysis was applied to the answers obtained from the structured questionnaire. Prior to the calculation of the principal component analysis (PCA), the coefficient of Kaiser-Mayer-Olkin (KMO) and Bartlett's sphericity test were estimated to assess the quality of the correlations among the variables. After that, the factors were extracted by the principal components analysis method, rotated by an orthogonal transformation (varimax), retaining those with eigenvalues > 1.3, defined according to the scree plot graph of the variance for the number of components. The exploratory factor structure was obtained from the indicators that presented factor loadings larger than 0.3, a score was determined for each behavioral pattern using principal components factor analysis, and the patterns were named according to the retained indicators.
The association among the patterns and abdominal obesity anthropometric indicators was analyzed using linear regression models. The WC, WHR and WHER variables presented a symmetric distribution (p > 0.05; Shapiro-Wilk test). The main independent variable was the score of the patterns, those which had a p < 0.20 in the linear regression analysis. The models were adjusted by confounding variables such as gender, age and social economical class. A significance level of 5% was considered in the study.
Quality control of this study was performed by applying, at random, questions of the questionnaire to 10% of the sample by phone calls and double data input. After checking data consistency, analyses were performed in the STATA statistical package, version 13.1, by taking into account the effect of sample design by the "svy" command group, which considered the complex sample design (sampling by clustering in two steps and prior stratification through census sectors). Sample weights, considering gender, age and education, were calculated in order to equalize differences in the social-demographic composition of the sample in relation to the composition of the adult population of the city, according to the 2010 census distribution 27.
The project was submitted and approved by the Ethics Committee, under protocol number 008/12. Participants of the study were requested to sign the terms of free consent, which was explained to them before data collection.
RESULTS
In this study 1,226 interviews were conducted, of which 50.8% were answered by women, 32.7% of the interviewees were 20 to 29 years old, 71.7% reported to have been at school for more than eight years and 64.6% were in middle C social economical class.
The frequencies of variables used as of risk or protection indicators for abdominal adiposity in the principal component analysis are presented in Table I.
Table I Frequency of risk and protective factor for abdominal adiposity in the population, Viçosa, Brazil, 2012-2014
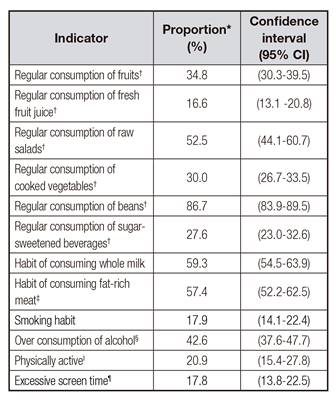
*Proportion weighed by gender, age and schooling. †Consumption of fruit, fresh fruit juice, raw salads and cooked vegetables, beans and sugar-sweetened beverages five or more days a week. ‡Consumption of red meat without removing visible fat or poultry skin from the food. §Consumption of > 5 shots (man) and > 4 shots (woman) in ≥ 1 day in the last 30 days. II Time of physical activity practice longer than or equal to 150 minutes per week. Time spent in front of TV or computer longer than or equal to four hours a day.
For protection indicators, regular consumption of raw salads (53.5%) and regular consumption of beans (86.2%) were reported by the interviewees.
In relation to risk indicators, the habit of consuming whole milk and red meat with visible fat and/or poultry skin was reported by 59.0% and 55.3% of the respondents, respectively.
The values presented in the tests for evaluation of the correlation between the indicators of protection or risk of abdominal adiposity and the adjustment for using factor analysis to identify behavioral patterns were satisfactory for the PCA (KMO = 0.60 and Bartlett's sphericity = 0.000). By means of the exploratory factor analysis, five components were found, two of which had eigenvalues larger than 1.3, explaining 23.78% of the components variation. After orthogonal rotation, two components remained in the correlation matrix, representing a behavioral pattern of risk and one of protection. Of the 12 variables regarded as risk or protection factors for the tested abdominal obesity, those considered to be valid to remain in each component were the indicators with saturation higher than 0.3 (indicated in italics), shown in Table II.
Table II Rotated factor loadings for the first two factors of principal component analysis of the population, Viçosa, Brazil, 2012-2014

Observation: indicators with factor loading larger than or equal to 0.3 are in italics. †Consumption of fruit, fresh fruit juice, raw salads and cooked vegetables, beans and sugar-sweetened beverages five or more days a week. ‡Consumption of red meat without removing visible fat or poultry skin from the food. §Consumption of > 5 shots (man) and > 4 shots (woman) in ≥ 1 day in the last 30 days. Time of physical activity practice longer than or equal to 150 minutes per week. Time spent in front of TV or computer longer than or equal to four hours a day.
The means of waist circumference, waist-to-hip ratio and waist-to-height ratio among men were 87.4 cm (95% CI 85.3-89.5), 0.91 (95% CI 0.89-0.92) and 0.51 (95% CI 0.50-0.53), respectively. Abdominal adiposity evaluated by waist circumference was present in 12.8% (95% CI 9.4-17.1) of the male participants, by means of the waist-to-hip ratio in 25.3% (95% CI 21.0-30.2) and waist-to-height ratio in 44.7% (95% CI 39.4-50.1).
For women, the average of waist circumference was 80.6 cm (95% CI 78.5-82.6), the mean of waist-to-hip ratio was 0.82 (95% CI 0.85-0.88) and the average of waist-to-height ratio was 0.55 (95% CI 0.35-0.56). Abdominal adiposity evaluated by measurement of waist circumference was present in 23.9% of women (95% CI 19.6-28.7), by waist-to-hip ratio in 55.3% (95% CI 49.8-60.5) and by waist-to-height ratio in 29.1% (95% CI 24.6-34.0).
The first behavioral pattern found in the study was termed "Healthy Pattern". It explained 12.58% of the variance and included the regular consumption of fruits, fresh fruit juices, raw and cooked vegetables and the appropriate level of physical activity.
The second behavioral pattern was characterized by the habit of smoking, and by the consumption of alcohol and fat-rich meats (red meat with visible fat and/or poultry skin). This pattern was identified as "Risk Pattern" and presented a variance of 11.20%.
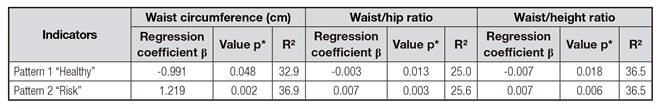
Table III shows the association between the two behavioral patterns found in abdominal adiposity, determined by waist circumference and by the indices of waist-to-hip ratio and waist-to-height ratio.
Negative associations among the "healthy" protection pattern and waist circumference, wait-to-hip ratio and waist-to-height ratio were found, showing that the increment in the consumption of fruits, fresh fruit juices, raw or cooked vegetables and the appropriate level of physical activity were associated with the reduction in abdominal adiposity in this population. Contrary to that, the pattern termed "risk" was positively associated with abdominal adiposity. In addition, the multiple linear regression analysis showed that the association between risk and protection patterns and the parameters of abdominal adiposity were better explained by the waist-to-height ratio and waist circumference since they presented 36.5% and 32.9% of the variability explained for the "healthy" pattern and 36.5% and 36.9% of the variability explained for the "risk" pattern.
DISCUSSION
This study investigated the clustering of risk factors and the association between risk and protection behavioral patterns with abdominal adiposity indicators among adult individuals of Viçosa, using the method of exploratory factor analysis. Two patterns were established, one of which is considered as a protection factor for abdominal adiposity, where variables of healthy food consumption, such as raw salads or cooked vegetables, fruits, fresh fruit juices and physical activity, were included. The second pattern identified was considered as risky because it grouped variables considered to be risk factors such as smoking, abusive alcohol consumption and the habit of consuming fat-rich meats.
Physical inactivity, smoking, alcohol drinking and inappropriate diet, regarded as the main risk factors, have been analyzed each in several studies. However, this way of analyzing may be inefficient, since, according to Hofstetter et al.6, risk behaviors do not occur in isolation. Furthermore, populations simultaneously presenting risk behavior factors are more likely to present major non-communicable chronic diseases than individuals with only one risk factor 38. Therefore, using statistical techniques to reduce variables into clusters with similar profiles is recommended to assist in obtaining knowledge of possible associations of risk behaviors or health protection among them.
Once the analyses were adjusted, the "healthy" pattern was found to be negatively associated with abdominal adiposity. Similar to what was found in this study, McNaughton et al. 39, when using the exploratory factor analysis, found that the dietary pattern characterized by high consumption of fruits and vegetables was inversely associated with body mass index, blood pressure and waist circumference. Neumann et al. 40, when using the same statistical technique, found that the termed "modern" dietary pattern, made up of fat-free dairy products, seafood, fresh fruit juices and fruit was inversely associated with risk factors for cardiovascular diseases, and the waist-to-hip ratio measure was among these evaluated variables. Ribeiro et al. 41, when describing the frequency of fruit and vegetable consumption of adults living in the city of São Paulo, São Paulo state, found a positive correlation between the consumption of these foods and physical activity during leisure time.
Our findings can be explained by the positive and healthy actions of eating habits and lifestyle. The effects of fruits and vegetables on general and central obesity are believed to relate to their soluble fiber content, which is associated with increased satiety, delayed gastric emptying and enhanced insulin sensitivity 42. In relation to the practice of physical activity, the energy expenditure independent of intensity reduces abdominal fat 43.
When evaluating the aggregation of behavioral patterns of British university students, identified by means of cluster analysis, Dodd et al. 44 identified three subgroups, characterized by high prevalence of physical inactivity (70%), inadequacy in the regular consumption of fruits and vegetables (66%) and abusive alcohol consumption (56%). By using the same technique, Costa et al. 22 found the simultaneity of health protective behaviors, such as the occurrence of a proper consumption of fruit and the practice of physical activity during leisure time in 35.5% of men and 33.3% of adult women living in the city of Florianópolis, state of Santa Catarina, Brazil.
The data previously shown illustrate the limitation regarding the comparison of this study with other studies due to variations in the methodology used for determining a standard or a variable clustering, since the identification of standards involving behavioral or anthropometric variables has been frequently carried out by the statistical technique of clustering, which, according to Hofstetter et al. 6, place individuals with similar interrelationships in the same clusters.
The second pattern found in the study, termed "risk", was positively associated with abdominal adiposity. Schuit et al. 45, in a cross-sectional study with European adult subjects, showed that the associations between the consumption of alcohol and smoking are strong especially among individuals with low education degree and income. Furthermore, the influence of smoking and consumption of alcoholic drinks on abdominal fat has been shown in other studies 46) (47 by measurement of the waist circumference as well as waist-to-hip ratio.
A transversal study carried out by Faria et al. 47 with men living in Cuiabá, state of Mato Grosso do Sul, Brazil, found that the means of waist-to-hip ratio indices were higher among smokers and the means of waist circumference and waist-to-height ratio were higher among those who reported higher consumption of alcoholic drinks. Studies have shown a higher prevalence of abdominal obesity in former smokers, a result from the increment in the caloric intake and a reduction in the basal metabolic rate after quitting the addiction 48. Despite being evident, the literature has not been able to determine a relationship between cause and effect in relation to the association between consumption of alcohol drinks and abdominal fat due to the large methodological variation in the frequency analysis and the amount consumed 8.
Smoking, abusive alcohol consumption and the habit of consuming fatty meats (red meat with visible fat and/or chicken with skin) are considered as important risk factors for chronic non-communicable diseases and have been associated with abdominal adiposity. The relation between cigarette smoking and body fat distribution is complex and incompletely understood. Biological mechanisms involving higher levels of cortisol increase lipogenesis, differentiation of adipocytes and deposition of abdominal fat 47. As for the consumption of alcohol, its metabolism may trigger endocrine changes, such as increased cortisol, predisposing to changes in fat distribution. The habit of consuming fat-rich meats is associated with abdominal adiposity because this food group provides excess calories to individuals.
The combination of risk factors such as smoking, alcoholism and inadequate food intake has been investigated in studies in Brazil 22) (31 and worldwide 44) (45. The prevalence of those three risk factors, evaluated by the cluster statistical technique in a Brazilian study, showed that 4.9% of men and 1.9% of women had the occurrence of those factors at the same time 20. The same methodological work proposal in European countries presented prevalence data higher than these, which were 15.3% for men and 14.4% for women.
The identification of risk or protection behavioral patterns for non-communicable chronic diseases was carried out by using the PCA technique in a sample with 108,706 Brazilian adults, participants of the VIGITEL. That investigation showed results similar to those of this present study, where it was found that the behavioral pattern considered risk was defined by smoking, excessive alcohol consumption and regular intake of meat with visible fat 31. Therefore, strategies to control the increase in the prevalence of such risk factors in the population may be directed to these three factors, which have a tendency to aggregate.
The population-based transversal study with 2,732 adults, conducted in Pelotas, state of Rio Grande do Sul, Brazil, to evaluate the prevalence of the combination of behavioral risk factors, showed that the combination of physical inactivity factors and regular consumption of visible meat fat was present in 18.2% of the men and 17.0% of the women in the study. Vilela et al. 21, when evaluating the dietary pattern of adults in Cuiabá, state of Mato Grosso do Sul, Brazil, found a positive association between "Western" eating pattern, characterized by high intake of pasta, fatty meats, sugar-sweetened beverages and sweets, and the increase in the waist circumference and wait-to-hip ratio among women.
The parameters of abdominal adiposity, waist-to-height ratio and waist circumference presented a higher capacity for explaining the behavioral patterns than did waist-to-hip ratio, this is observed since of different found regression coefficients, that can show the superiority tool for discriminating the behavioral patterns. Waist-to-height ratio has a direct regulation with growth and waist circumference, so it minimizes erroneous assessment of health risk in individuals with different heights, which is the greatest advantage of this measure. In addition, this indicator has been considered as a good marker of abdominal obesity related to cardiovascular risk factors. Waist circumference is already recognized as an important and simple indicator of central adiposity and risk for chronic diseases 35.
This is the first population-based study conducted in Viçosa and one of the few works that identifies and explores risk and protection factors by using the statistical technique of principal components and makes associations with abdominal adiposity. Lam et al. 3 mentioned that the measures of central adiposity are more closely associated with cardiovascular risk factors and metabolic diseases than BMI. Furthermore, the body mass index does not consider body fat distribution, which is a limitation since there are suggestions that the metabolic complications of obesity are more closely related to visceral adiposity than to overall adiposity. However, some limitations should be considered. It is noteworthy that this is a cross-sectional study, which prevents the establishment of temporality of associations. Self-reports of risk behaviors tend to be underestimated because of being socially undesirable. In addition, menopausal women were not excluded because they presented lower sample representativity.

