


 Servicios personalizados
 Inglés (pdf)
 Articulo en XML
 Referencias del artículo
 Enviar articulo por email
 Citado por SciELO
  Citado por Google
  Similares en
SciELO
Similares en
SciELO  Similares en Google
 Permalink
INTRODUCTION
Serotonin (5-hydroxytryptamine or 5-HT) is a biogenic amine, synthesized from the essential amino acid L-tryptophan, involved in the regulation of energy balance for its actions in both central nervous system (CNS) and peripheral tissues 1. Central serotonin (5%) suppresses appetite and decreases food intake 2 and hence it influences indirectly body fat, which is an important determinant of insulin resistance and glucose levels 3. However, most of the serotonin (95%) is released into the bloodstream, mainly by intestinal cells, but also by pancreatic β-cells, adipocytes and osteoclasts 4,5. Recent works indicate that peripheral serotonin serves as a secreted hormone to regulate metabolic function in multiple tissues 6,7,8. Specifically, peripheral serotonin modifies glucose metabolism, participating in both glucose homeostasis and hepatic gluconeogenesis in cellular and animal studies 9,10,11,12,13. These effects of peripheral serotonin in metabolism have driven a renewed interest in the study of serotonin, even as a therapeutic molecule for obesity and diabetes treatment 6,7,8.
Childhood obesity is a major public health problem worldwide, with an alarming trend in Europe and in Spain 14. A number of comorbidities are associated with obesity in pediatric population increasing cardiovascular risk 15. However, lifestyle interventions are able to reduce cardiovascular risk factors in obese children 16,17,18,19,20, but there is little information on the role of peripheral serotonin in weight loss interventions. Therefore, our aim was to evaluate plasma serotonin levels after a lifestyle intervention in obese children and its possible association with changes in glucose and adiposity measurements.
METHODS
The NUGENOI study (nutrigenomics and childhood obesity) was conducted by members of the GENOI group (Navarra Study Group of Childhood Obesity) in 2009. NUGENOI, an uncontrolled clinical trial (NCT01329367), is a ten-week intervention study involving 54 obese children and adolescents from Navarra. The weight loss program is based on a moderate caloric restriction together with nutritional education and familial involvement. Children and their parents received personal training in nutritional and physical education throughout the ten-week intervention period 17,18,19,20.
The study followed the ethical standards recognized in the Declaration of Helsinki (Brazil, October 2013), the Rules of Good Clinical Practice (EEC 111/3976/88 July 1990) and the current legislation responsible for regulating clinical research in humans (Royal Decree 561/1993). The project was approved and supervised by the Ethics Committee on Human Research of the University of Navarra (42/2005).
SUBJECTS
In the study, 71 overweight or obese children and adolescents (7-15 years) were recruited at the Pediatric Endocrinology Unit of the Clínica Universidad de Navarra and the Pediatric Department of the Complejo Hospitalario de Navarra, according to the criteria of Cole et al. 21. All of them were Spanish or schooling foreigners for at least one year in Spain. Participants with a major psychiatric illness, significant neurological disease, bulimia nervosa, familial hyperlipidemia or any sort of either major cardiovascular or respiratory complication were excluded.
Fifty-four subjects agreed to participate in the study and signed the informed consent, but only 44 subjects (22 boys and 22 girls) completed the dietary intervention (drop-out rate 18.5%) during two different periods (April-June and September-December, 2010) in order to ease follow-up. They were distributed according to the response based on change in "Standard Deviation Score for Body Mass Index" (BMI-SDS, median equal to 0.5). Thus, the subjects who lost > 0.5 BMI-SDS were considered as high responders (HR; n = 22) and those who lost ≤ 0.5 BMI-SDS, as low responders (LR; n = 22).
DIETARY INTERVENTION
The child accompanied by his/her parent or tutor underwent ten weekly follow-up dietetic consultations for diet monitoring, weight control and nutritional education 17,18,19,20. The adherence to ten weekly individual sessions was 93% in the total population.
The dietary intervention was carried out by a registered dietitian with the support of pediatricians. On the first visit, participants were prescribed an energy restriction dietary program in a range from 10% to 40% depending on the degree of obesity presented 22. Firstly, energy expenditure of the participants was calculated according to the Scholfield equation 23 adapted to age and sex. Nevertheless, diets with an energy intake less than 1,300 kcal/day or greater than 2,200 kcal/day were not prescribed.
The distribution of the energy intake along the day was 20% at breakfast, 5-10% at morning snack, 30-35% at lunch, 10-15% at afternoon snack, and 20-25% at dinner. Daily macronutrient intake was distributed in the following corresponding nutrient-caloric percentages 24: 55% carbohydrates, 30% fat and 15% protein. A semi-quantitative Food Frequency Questionnaire (FFQ) previously validated in Spain 25 containing 132 food items was filled out to evaluate the dietary patterns of the participants. The adherence to the fixed full day dietary plan (five meals) was weekly evaluated during the personal interviews with the registered dietitian.
ANTHROPOMETRIC AND CLINICAL MEASUREMENTS
Anthropometric measurements (body weight, height, BMI, BMI-SDS, fat mass, waist circumference, hip circumference and waist-to-hip ratio) were performed by trained personnel with previously calibrated equipment. Triplicate measures were performed and average was taken as the final value. Subjects were in a large room, barefoot, in his/her underwear and wore an exploration gown. Body weight was determined using a digital scale (TBF-410, Tanita(r), Tokyo, Japan). Height was measured using a stadiometer (Seca(r) 220, Vogel & Halke, Germany). BMI was calculated from weight and height measurements. BMI in childhood is a determinant of BMI in adulthood, and it allows monitoring of overweight or obesity of the child from childhood to adulthood 26. In addition, in pediatric population BMI should be referred to sex and age of each participant, by calculating BMI-standard deviation score (SDS). For each subject, BMI-SDS derives from the difference between his/her own BMI values, age and sex specific cut-points taken from Spanish reference growth charts 27. Waist circumference (WC) and hip circumference (HC) were measured using a non-stretchable measuring tape (type SECA(r) 200). WC was measured as the smallest horizontal girth between the costal margins and the iliac crests at minimal respiration. HC was taken as the greatest circumference at the level of the greater trochanter (the widest portion of the hip) on both sides. Pubertal developmental stage was determined according Tanner stage 28. In addition, the children's body composition was measured using bioelectrical impedance analysis equipment (TBF-410, Tanita(r), Tokyo, Japan).
Measurements were taken before and after the follow-up intervention at the same time of the day, except for the weight and height, which were measured weekly in order to have a rigorous control of weight loss.
BIOCHEMICAL MEASUREMENTS
Blood draws were performed before and after the study. Blood extraction was performed by specialized nurses through a BD Vacutainer(r) system (Becton Dickonson, GB), after overnight fasting. Venous blood samples were obtained on ethylenediaminetetraacetic acid (EDTA) tubes, which were separated in plasma and serum aliquots by centrifugation (3,500 rpm, 4 °C, 15 min). After centrifugation, plasma (10 ml) and serum (5 ml) were stored in three tubes each and frozen at -80 °C. Triglycerides, total cholesterol, cholesterol linked to high-density lipoproteins (HDL-cholesterol), glucose and insulin were determined by enzymatic colorimetric using the Hitachi 911 analyzer (Roche Diagnostics, Basel, Switzerland). The fraction of cholesterol linked to low-density lipoproteins (LDL-cholesterol) was calculated with the Friedewald formula 29. Insulin resistance and insulin sensitivity were calculated according to the homeostasis model assessment of insulin resistance (HOMA-IR = [insulin levels x glucose levels]/405) and quantitative insulin sensitivity check index (QUICKI = 1/[logarithm of insulin levels + logarithm of glucose levels]), respectively.
Determination of serotonin and its metabolite 5-HIAA from plasma was performed by adding 50 µl of 0.4 N perchloric acid containing 0.1% metabisulfite and 1 nM EDTA per 50 µL sample. Then, the sample was centrifuged (13,000 rpm, 2 min) in order to discard the pellet; 75 µl of the supernatant were removed, and perchloric acid (75 µl) was added. After a second centrifugation (13,000 rpm, 2 min), the resulting supernatant were used for determination of serotonin and 5-HIAA.
For serotonin analysis, high performance liquid chromatography (HPLC) was used. The mobile phase consisted of 16% methane and 80% aqueous solution, containing 0.05 M potassium phosphate monobasic (KH2PO4), 0.16 nM octanesulfonic acid (SOS) and 0.1 mM EDTA, and was injected at a flow rate of 1 ml/min and at pH value of 3. Serotonin and 5-HIAA were detected through a Waters(r) 717 plus Autosampler injector (Waters, USA) that injected 40 µl of sample in a reverse-phase column Spherisorb(r) ODS-2 (5 µm, 15 x 0.46 cm, Waters) connected to an amperometric detector DECADE(r) (Antec Leyden, Zoeterwoude, the Netherlands) with a range of 20 amps. In order to quantify both compounds, a specific program for HPLC was used (Empower 2.1.5.4, Waters(r), USA), which compared the area generated by the peak with the standard-reference area (serotonin: 1,000 pg; 5-HIAA: 500 pg).
STATISTICAL ANALYSES
Stata 12.0 for Windows (version 12.0 Texas, USA) was used for statistical analyses. Plasma serotonin levels were log transformed to follow a normal distribution. Paired t tests were used to assess pre and post-intervention variables in participants.
Multiple linear regression analyses were fitted to estimate associations between plasma serotonin levels and blood glucose or anthropometric measures after adjustment for potential confounders (age and sex, or pre-intervention variables).
Values are shown as arithmetic mean (standard deviation/95% confidence interval). The level of statistical significance was p < 0.05.
RESULTS
Forty-four obese children (50% males, aged 7-15 years old) accomplished the ten-week lifestyle intervention. Anthropometric and biochemical variables from obese children (HR and LR groups) are indicated in Table I; HR and LR subjects had similar pre-intervention measurements.
Table I Anthropometric and biochemical variables pre and post lifestyle intervention in obese children according to the response
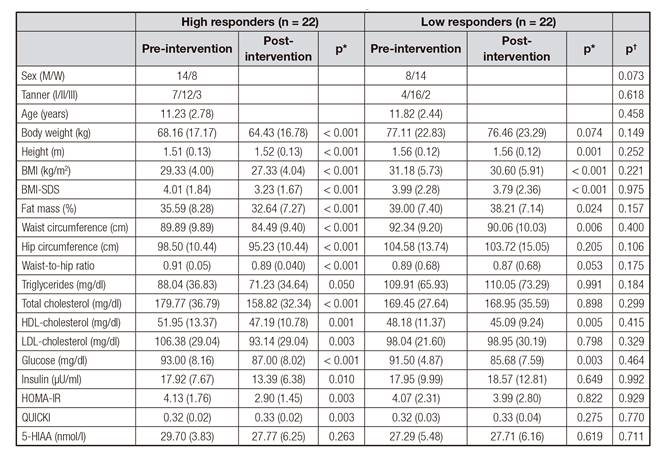
Values are expressed as mean (SD). Tanner I: infant; Tanner II: puberty; Tanner III: adult; BMI: body mass index; BMI-SDS: standard deviation score for BMI; HOMA-IR: homeostasis model assessment for insulin resistance; QUICKI: quantitative insulin sensitivity check index; 5-HIAA: 5-hydroxyindoleacetic acid; p*: p values for the comparison between pre and post-intervention variables in obese children distributed by the response; p†: p values for the comparison of pre-intervention variables between high and low responders.
All obese children (HR and LR groups) showed a significant decrease in adiposity (p < 0.05) after the intervention. Specifically, HR subjects significantly reduced BMI-SDS (19%, p < 0.001), total cholesterol (12%, p < 0.001), LDL cholesterol (12%, p < 0.001), insulin levels (25%, p = 0.010) and HOMA-IR (30%, p = 0.003). Moreover, all subjects (HR and LR groups) had significantly lower BMI-SDS, fat mass, waist circumference and blood glucose levels after the intervention (p < 0.05).
Interestingly, plasma serotonin levels were significantly diminished in both the HR (30% nmol/l, p = 0.002) and LR group (33%, p = 0.026) after the ten-week lifestyle intervention (Fig. 1).

Figure 1 Plasma serotonin levels pre and post-lifestyle intervention in obese children from high (A) and low (B) responder groups. Each dot represents the plasma serotonin level in a subject. The solid horizontal lines indicate the mean values of plasma serotonin pre and post-intervention, respectively. *p < 0.05; **p < 0.01.
Moreover, a significant association between pre-intervention serotonin and glucose levels was found in HR and LR subjects (Fig. 2). Curiously, 22% of the variability in baseline glucose levels is explained by its linear dependence on plasma serotonin. Thus, an increase of 0.05 mg/dl of glucose levels was explained by the increase in one unit of serotonin (nmol/l), after adjusting for potential confounders. The change in plasma serotonin significantly (p < 0.05) predicted the 29% of the variance in changes in glucose levels in the HR group (Fig. 3) in a multiple linear regression after adjustment for baseline glucose levels and age. Post-intervention serotonin and glucose levels were significantly associated in HR and LR subjects (R2 = 0.140, B = 0.055, p = 0.042, data not shown).

Figure 2 Association between pre-intervention serotonin and glucose levels in an obese children population (n = 44). *Multiple linear regression analyses after adjustment for baseline BMI-SDS and age.
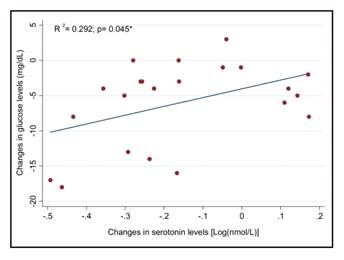
Figure 3 Association between changes in serotonin and glucose levels after a ten-week lifestyle intervention in the HR group (n = 22). *Multiple linear regression adjusted for baseline glucose and age.
Finally, multiple regression models were fitted in order to assess the association between pre and post-intervention serotonin levels and anthropometric measures in the total population (HR and LR groups). Notably, significant associations were found between serotonin levels and body weight (pre-intervention, R2 = 0.452, B = -0.109, p = 0.044; post-intervention, R2 = 0.384, B = -0.174, p = 0.013), BMI (post-intervention, R2 = 0.290, B = -0.048, p = 0.013) and BMI-SDS (pre-intervention, R2 = 0.194, B = -0.026, p = 0.006) (Table II).

DISCUSSION
In the present study a ten-week lifestyle intervention was conducted in obese children and adolescents based on a moderate caloric restriction diet, not to compromise growth and development of the population. Our intervention was able to reduce adiposity indices and some biochemical markers, thus lowering cardiometabolic risk. It is worth mentioning that, from a pediatrician's perspective, it is favorable to have no increase in body weight when treating obese children 30.
Furthermore, Reinehr et al. indicated that an improvement in body composition and cardiometabolic risk can been seen with a 0.2 decrease in BMI-SDS, while greater benefits occurs when losing at least 0.5 BMI-SDS 31. Indeed, in our study, a 0.49 BMI-SDS reduction was obtained together with an improvement in lipid and glucose profiles. We and other researchers have conducted successful programs for childhood obesity including lifestyle modification, moderate caloric reduced diet, nutritional education and family implication 22,32.
The novelty of this study is that plasma serotonin levels were notably decreased after a ten-week lifestyle intervention and they were associated with anthropometric and glucose measurements. Little research work focused on the relationship between serotonin and weight status in human subjects is found in the literature. In normal weight, anorexia nervosa and obese adult subjects, plasma tryptophan levels are diminished after dietary restriction, suggesting that serotonin synthesis could also be reduced 33,34,35,36,37,38. In a similar way, our results indicate that serotonin levels were reduced in obese children following a moderate calorie restricted diet.
Concerning the potential involvement of serotonin levels in glucose metabolism, we observed that plasma serotonin levels were significantly associated with blood glucose in our obese children population. Peripheral serotonin appears to exert its action on different tissues, metabolic pathways and endocrine organs involved in glucose homeostasis, which may explain the contradictory effects reported in the literature 39,40. In healthy subjects, a positive correlation between platelet serotonin and glucose levels was observed before and after an oral load glucose test 41. Furthermore, it has been observed that plasma 5-HIAA was associated with fasting plasma glucose in patients with metabolic syndrome 42,43 and diabetes 44.
As mentioned before, few studies in humans show a relationship between peripheral serotonin and glucose metabolism. However, in animals it is reported that glucose is a stimulator for the release of serotonin into blood in pancreatic β-cells 9,11 and enterochromaffin cells 12. Moreover, in animal hepatocytes, serotonin promotes hepatic gluconeogenesis and decreases glucose uptake, which would result in higher circulating glucose levels 10,13. These preliminary results in animal studies could help to understand the association between circulating serotonin and glucose levels.
The strengths of this study include: first, measurements in young subjects not confounded by chronic obesity-related disorders; second, the overweight/obese subjects achieved weight loss in a short term dietary intervention; and third, a standardized intervention with similar lifestyle recommendations given to a relatively homogenous group. On the other hand, weaknesses of the study are: first, the absence of a normal weight children group; second, the reduced sample size of our population and also that there was no sample available for tryptophan measurement; and third, the different pubertal stage of participants, with an intense growth and endocrine changes which may influence our results. To make this effect lower, each statistical model was adjusted for age and sex.
In summary, we have shown for the first time that plasma serotonin levels were decreased after a lifestyle intervention in obese children, and that they were associated with anthropometric indices (body weight, BMI, BMI-SDS) and blood glucose levels. Nevertheless, further studies are needed to confirm the findings in a larger population, and also to characterize the underlying mechanisms that link serotonin with body weight regulation and energy homeostasis.

