


 Servicios personalizados
 Inglés (pdf)
 Articulo en XML
 Referencias del artículo
 Enviar articulo por email
 Citado por SciELO
  Citado por Google
  Similares en
SciELO
Similares en
SciELO  Similares en Google
 Permalink
INTRODUCTION
Overweight and obesity are defined as abnormal or excessive fat accumulation in adipose tissue and, according to the World Health Organization (WHO) in 2014, it is an escalating epidemic, affecting developed and developing countries 1. Overweight is defined as a body mass index (BMI) between 25 and 30 and obesity, when it is higher than 25 2. Obesity is a complex, multifactorial chronic disease, which is caused by the interaction of genetic and environmental factors, and is associated with increases in all-cause mortality. Moreover, these individuals with obesity may also suffer from social stigmatization and discrimination 3.
Obesity has an increasing tendency in all countries, and the worldwide prevalence of obesity has nearly doubled since 1980 1. In 2014, 39% of adults aged 18 years and older (38% of men and 40% of women) were considered to be overweight or obese. This increment in obesity is associated with an increased risk of cardiovascular disease (CVD), type-2 diabetes, some types of cancer and other health problems 4.
There are several anthropometric methods available to estimate health status, methods to estimate the body fat percentage (BF%) including measurements based on skinfold thickness such as Brozek 5, Heath-Carter 6 and Siri 7 equations, or bioimpedance-based measurements that utilize differences in the electrical transmission capability between water and fat. Other methods are those indexes used as predictors of the cardiovascular risk where the BMI is the principal criterion used to define obesity 1,8,9, but it is also correlated with CVD-related risks, particularly cholesterol plasma levels and high blood pressure in adolescents 10. Other indexes are included in this group which estimate abdominal fat and the consequent CVD risk, such as the weight-height ratio (WHtR), waist circumference (WC), waist-hip ratio (WHR) or conicity index (CI) 11,12.
Given the rising incidence of obesity in the young, there has been growing concern about the accuracy of the different body composition measurement methods 10,13. Studies of population-specific cut-off points are needed, considering variables such as gender, ethnic origin, geographical location and socio-economic status. In addition, studies of novel variables that could enhance the role of anthropometry in health monitoring are needed 14.
University students are at a critical juncture in their lives because they are beginning to be independent. In this population, where prevalence of overweight and obesity is usually low, an early detection is very important to prevent health disorders in adult ages 15,16. But one problem for the early detection is the fact evidenced by some studies which refer differences in overweight and obesity classification depending on the anthropometric method used 17,18.
Knowing the probable disparity of results between the different anthropometric equation and indexes, especially in those cases near overweight, it would be necessary to detect also that group of students close to that status that may be misdiagnosed as healthy depending on the method used, so that they could be warned early about their lifestyle and dietary habits.
Furthermore, in the present study, a new anthropometric index to identify this group of students has been proposed, the normalized weight-adjusted index (NWAI), structured as a sum of components, making the statistical treatment in epidemiological studies easier. Equations with squared variables in the denominator as BMI or other more complex as BF% are not easy to treat statistically, especially with small samples size, so non-parametric analyses should be needed either transformations of data. The NWAI data, due to his linear structure, do not need to be transformed and parametric analyses could be employed whenever possible.
The aim of this study was to compare the employment of different anthropometric methods to detect, in a population of university students with low prevalence of overweight and obesity, those with overweight or with cardiovascular risk associated to body fat mass, including a comparison with the new NWAI.
MATERIAL AND METHODS
STUDY DESIGN, VOLUNTEERS AND ANTHROPOMETRIC MEASUREMENTS
Setting and study design
A cross-sectional study of 505 healthy students of the Degree of Nursery was conducted at the University of Murcia. The sample was composed of 388 females and 117 males aged 18-30 years, with a mean age of 21 ± 4.
Anthropometric measurements and indexes
All measurements were taken on the same visit to the nutrition laboratory of the University of Murcia. The experimental protocol was approved by the local ethics committee at the University of Murcia. The following anthropometric measurements were performed:
Body weight was measured to the nearest 0.1 kg, and body height was measured to the nearest 0.1 cm, using standard medical equipment in subjects wearing light indoor clothing without shoes, jackets or sweaters 19.
BMI was calculated as the body mass divided by height squared (kg/m2)20. Participants were classified according to the WHO 2 standards: underweight was defined as a BMI of < 18.5, normal weight was classified as a BMI of ≥ 18.5 and < 25, overweight was defined as a BMI of ≥ 25 and < 30, and obesity was defined as a BMI of ≥ 30.
The skinfold thickness (biceps, triceps, subscapular, supra-iliac, abdominal, thigh and calf) was measured in triplicate on the dominant side of the body to the nearest 0.2 mm, using a Holtain skinfold caliper.
The WC and hip circumference (HC) were measured in the midway section between the lower edge of the ribs and iliac crest and in the widest portion of the buttocks, using a non-stretchable tape parallel to the floor to an accuracy of 0.1 cm. All measurements were made in duplicate 21. CVD risk was defined as a WC > 80 cm in females and 94 cm in males 2, or when the WHR > 0.8 in women or 0.9 in men 22.
The WHtR was calculated by dividing the WC (cm) by the height (cm), with 0.5 used as a cut-off point in both genders 23.
The CI was calculated by the formula described by Valdez et al. 24 [CI = WC/0.109√(weight/height)], with WC and height measured in m and weight in kg. Cut-off points were established at 1.18 for females and 1.25 for males.
The BF% was calculated using the following equations:
Siri equation: [BF% = 100 x (4.95/D) - 4.5] 7.
Brozek equation: [BF% = 100 x (4.57/D) - 4.142] 25. In the Siri and Brozek equations, D is the human body density, calculated using Durnin and Womersle's formula 26, [D(g/l) = C - (M log X)], where C and M are coefficients dependent of age and gender, and X is the sum of the tricipital, bicipital, supra-iliac and subscapular skinfold thicknesses.
Heath-Carter's equation for men [BF% 0 2.585 + 0.1051 x ∑ X] and for women [BF% = 3.580 + 0.1548 x ∑ X], where is the sum of the tricipital, bicipital, supra-iliac, subscapular, thigh and calf skinfold thicknesses 6.
Bioelectrical impedance analysis (BIA)
BIA measurements of hand-hand impedance (BIA-arm) were obtained using a manual impedanciometer (OMRON BF 300(r), OMRON Matoukasa Co. LTD, Japan), and foot-foot impedance (BIA-leg) was measured with a body composition scale (OMRON BF 400(r), OMRON Matoukasa Co. LTD, Japan). All the measurements were performed in accordance with the manufacturer's instructions.
Normalized weight-adjusted index (NWAI)
The new NWAI was built as a linear regression between weight and height. The NWAI was defined as follows: [(weight/10) - (10 x height) + 10] with weight measured in kg and height in m. The constant +10 approximates the mean of the distribution to zero. Thus, the values of the index can be positive or negative.
Statistical method
A descriptive analysis was conducted to determine the mean and standard deviation. Statistically significant differences were calculated using a Student's t-test. Pearson's bivariate correlation analysis of all the anthropometric methods was then conducted. A k-means cluster analysis was performed to separate the sample into groups according to the variables that influence overweight or obesity. Receiver operating characteristic (ROC) curves were performed to calculate sensitivity, specificity and area under the curve (AUC) and determine the cut-off points for each anthropometric method.
RESULTS AND DISCUSSION
SAMPLE DESCRIPTION
Table I shows the anthropometric data for the male and female students. Several parameters present significant differences between genders (p < 0.05). Weight, height, WC, BMI, WHR, WHtR and CI were higher in men, and triceps, biceps, thigh and calf skinfold thicknesses and BF% for all equations were higher in women. These differences between genders were similar than those reported in studies developed in the University of Basque Country, Spain 17, and in the University of Pernambuco, Brazil 27.
Table I Anthropometric characteristics of the sample (mean ± standard deviation)
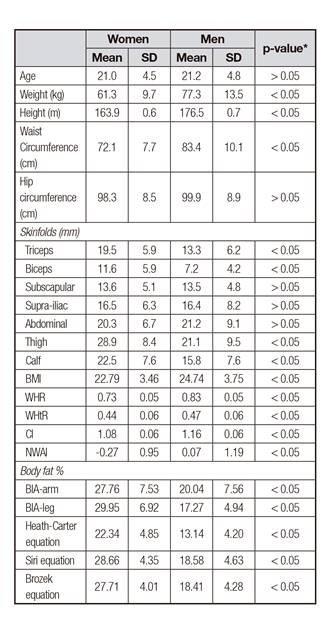
BMI: body mass index; WHR: waist-hip ratio; WHtR: waist-height ratio; CI: conicity index; NWAI: normalized weight-adjusted index; BIA-leg: bioimpedance analysis foot-foot; BIA-arm: bioimpedance analysis hand-hand. *Differences between gender calculated by Student's t-test.
In relation to the NWAI, it also resulted significantly higher in men (p < 0.05). Mean value for women was -0.27 with a range from -0.81 to 4.80; for men, the mean value was 0.07, ranging from -0.47 to 4.40.
The mean value for the anthropometric indexes (BMI, WHtR, WC, WHR and CI) and BF% were in both genders in the range of normality. On the other hand, the values of BIA-leg in women (29.95%) and BIA-arm in men (20.04%) are in the high limit recommended by the SEEDO (Spanish Society for the Study of Obesity) (20-30% for women and 12-20% for men) 28.
Results exert great variability depending on the index or equation used. The mean BF% for men varied from 13.14% using the Heath-Carter equation to 20.04% using the BIA-arms. In women, it varied from 22.34% using the Heath-Carter equation to 29.95% using the BIA-legs. Figure 1 shows the differences between the classifications according to BF% estimation. In women, the proportion of volunteers with higher BF% than recommended (overweight and obesity) varies from 29.4% with the Heath-Carter equation to 78.1% with Siri equation. In the case of men, it ranges from 12.0% with the Heath-Carter equation to 54.0% with the BIA-arm. The cases of volunteers with lower BF% than recommended were very low or inexistent for all methods. Watching BMI, we observe that differences are greater for women, so only 17.9% of females are considered to be overweight or obese. We can see that, in both genders, the Heath-Carter equation provides much lower BF% values than other equations and BIA methods.
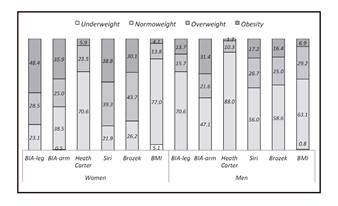
Figure 1 Distribution body fat percentage classification measured with different anthropometric methods (bioimpedance analyses and body fat percentage equation) than SEEDO criteria and body mass index. BIA-leg: bioimpedance analysis foot-foot; BIA-arm: bioimpedance analysis hand-hand; BMI: body mass index.
According to these results, Arroyo et al. 17 found 6.1% of obesity when measured by Siri equation but only 2.5% by BMI, while the proportion of overweight was 9.7% by Siri equation and 17.2% by BMI, and also differences between BF% equations. Mighelli et al. 18 describe that only 29.7% of individuals catalogued as obese by BF% Lohman equation were also identified as obese by BMI, while this value was 44.2% between WC and BMI. In the present study, it has been found that for women, only 10.7% of the individuals catalogued as obese by Siri equation were also by BMI. By Brozek equation this percentage was 13.9%, by Heath-Carter equation the percentage was 40.9% and by WC, it was 71.4%. In the case of men, percentages were 35.0% for Siri, 36.8% for Brozek and 100% for Heath-Carter and WC. These results indicate that Heath-Carter equation and WC index were better correlated with BMI in this population, and the employment of Siri and Brozek equations should be avoided. In addition, these results should be considered as a warning and the anthropometric indexes and equations should be carefully selected depending of the population group. It seems that the Siri and Brozek equations tend to overestimate the percentage of fat. It could be related to the fact that Siri and Brozek equations are based on measurements of skinfolds in trunk and arms, whereas the Heath-Carter equation uses skinfolds of trunk, arms and legs. As the Heath-Carter equation measures body fat in more regions, it may be a better reflection of total adiposity than the Siri and Brozek equations, but it should be evaluated in further studies.
The method that classified a higher percentage of obesity is BIA-leg in women (48.4%) and BIA-arm in men (31.4%). The prediction of BF% using the BIA-arm or BIA-leg measurement assumes that the impedance determined for hand-to-hand or foot-to-foot is representative of the total body composition, but this is not always the case. Variables, such as the length of the limbs or their complexion, can over/underestimate the total BF% 31. Fat distribution also differs between men and women; while men tend to accumulate fat in the abdominal region and arms, women tend to accumulate fat in the hip and legs, so it seems that BIA tended to overestimate BF% when BIA-arm for men and BIA-leg for women were used in the studied population.
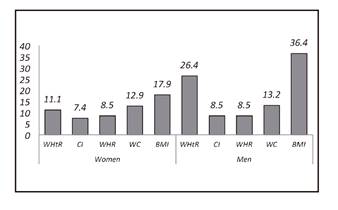
Fig. 2 shows the proportion of volunteers with some cardiovascular risk, associated with the amount and distribution of body fat, estimated with the different anthropometric indexes described. We can see again the great disparity between the different indexes, especially in men. In females, we found from 7.4% by CI up to 17.9% with BMI, whereas for males the range varies from 8.5% measured with CI and WHR to 36.4% by BMI. In the studied population, BMI seems to overestimate cardiovascular risk, which could be related to the fact that it is a young population and BMI does not differentiate between fat and muscular mass, which could introduce a bias in young sportspersons groups.
CORRELATIONS
To assess the results of the NWAI we have made bivariate correlations between all the anthropometric methods used (Table II). NWAI were strongly correlated with all anthropometric methods evaluated (p < 0.05), especially BMI (r = 0.995 for men and r = 0.986 for women), WHtR (r = 0.931 for men and r = 0.871 for women) and WC (r = 0.908 in men and r = 0.802 in women). The correlation found between the Brozek and Siri equations (r = 1.000) for both genders can be explained by the similar methods used to calculate BF% (5,7,26).
Table II Correlations between all anthropometric methods in men (top of table) and women (bottom of table)
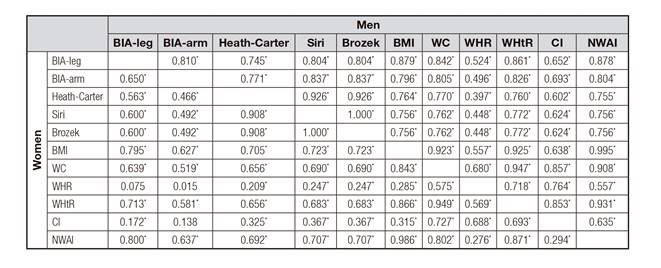
BIA-leg: bioimpedance analysis foot-foot; BIA-arm: bioimpedance analysis hand-hand; BMI: body mass index; WC: waist circumference; WHR: waist-hip ratio; WHtR: waist-height ratio; CI: conicity index; NWAI: normalized weight-adjusted index. *Statistical significant differences at p < 0.05 by r-Pearson correlation.
The correlation level between BMI and WC in our study (r = 0.843 for women and r = 0.923 for men) is similar to those described by Minghelli et al. 18 (r = 0.884), taking into account that they assessed correlation for men and women together. Araujo et al. 11 compared BF% by BIA versus WC, WHtR, IC and BF% by skinfold thickness. The author described the highest correlation between BIA and WC, being 0.698 for women and 0.792 for men; in our study, this correlation was also higher for men by both BIA methods. As in our study, a low correlation between BIA and IC was found in both genders, being much lower for women (0.217 for women and 0.587 for men). We agree with these authors on the fact that, considering the differences found between different anthropometric methods, it is important to compare the same methods when analyzing different investigations.
With these results, it can be expected that some students might be diagnosed as overweight with some anthropometric methods while in others they are in healthy weight. Right the opposite, students with a real status of overweight may be misdiagnosed as healthy weight and, therefore, they would not be warned about the real risk of their life style. It must be also noted that other factors such as physical activity or consumption of tobacco or alcohol increase the risk of cardiovascular disease.
K-MEANS CLUSTER ANALYSIS
The k-means cluster analysis was carried out separately for men and women, using all the variables related to overweight or obesity: weight, height, WC, hip perimeter and all skinfold thicknesses. In relation to all these data, the sample was divided into three groups (Table III).
Table III Groups identified after the k-means cluster analysis and its characteristics (number of cases, mean, standard deviation, minimum and maximum) for all anthropometric methods evaluated

Group 1: students with low values. Group 2: students with values in the middle range. Group 3: students with higher values. BIA leg: bioimpeance foot-foot; BIA arm: bioimpedance hand-hand; BMI: body mass index; WC: waist circumference; WHR: waist-hip ratio; WHtR: waist-height ratio; CI: conicity index; NWAI: normalized weight-adjusted index.
In line with the characteristics of the groups, group 1 represented students with low-mid values, group 2 included students with values in the middle range, and group 3 represented students with higher values, those who were already overweight or obese, but also those considered to be in risk of being overweight based on all variables measured. In the case of women, the distribution was the following: group 1, 188 students (48.4%); group 2, 145 students (37.4%); and group 3, 55 students (14.2%). With regard to men, there were 81 (69.3%), 26 (22.2%) and ten (8.5%) students in groups 1, 2 and 3, respectively.
For example, when analyzing the female group 3, we can observe that it includes 55 students with a mean BMI of 28.97. In this group, the person with lower BMI had 23.53. According to the WHO criteria 2, BMI < 25 is not considered as overweight, but in this particular case this student also had a BF% of 26.18, 33.72 and 32.39 measured by Heath-Carter, Siri and Brozek equations, respectively, which is considered as obesity according to the SEEDO 28 criteria. In the opposite side, watching group 2, the case with highest value for BMI was 28.68. This particular case presented BF% of 22.72, 30.69 and 29.59 measured by the Heath-Carter, Siri and Brozek equations, respectively, that is, lower values than the previous case. The same interpretation can be made with all the anthropometric methods and in both genders.
Obviously, when we want to determine whether a subject is in a situation of overweight or not, or if there is cardiovascular risk or not, we usually use only one simple, accurate, or easy to interpret method, being BMI the most widely used method in clinical practice 32. However, as we have previously seen, making a correct classification depends upon the anthropometric method used.
ROC CURVES
Once the studied population had been divided into three groups, the intention was to determine which anthropometric method was more accurate to define students with probable overweight or excess of fat mass. ROC curves were used to determine the AUC and the cut-off points for all the anthropometric methods evaluated. The AUC is a measure of the degree of accuracy of the method, and in the studied population the accuracy to identify the group of students with overweight or excess of fat mass. The cut-off point is established through sensibility and specificity. Sensitivity refers to the percentage of the population that is correctly identified as having a specific condition, and specificity defines the percentage of healthy people who are correctly identified as not having that condition. Considering that the best cut-off point is that with the highest sensitivity and specificity possible, being inversely correlated, when we study a population with low prevalence of overweight/obesity, as university students, it is more appropriate to establish a cut-off point setting maximum sensibility (1.00) and the highest specificity possible. Thus, we prioritize the diagnosis of all true positives, discarding the highest possible percentage of true negatives (Table IV).
Table IV Cut-off points, sensibility, specificity and the area under the curve for each anthropometric method optimized at maximum sensibility calculated by receiver operating characteristic (ROC) curves

AUC: area under the curve; BIA leg: bioimpedance foot-foot; BIA arm: bioimpedance hand-hand BMI: body mass index; WC: waist circumference; WHR: waist-hip ratio; CI: conicity index; WHtR: waist-height ratio; NWAI: normalized weight-adjusted index.
In the case of women, with the value of BMI ≥ 23.53 we would diagnose 100% of students with overweight and discard 80% who are healthy, being the most effective method for diagnosis. On the other hand, we found that with BIA-leg with a cut-off point of 21.9 BF% we would detected 100% of patients with excess body fat but only 14% of students without excess of BF% would be discarded. The extremely low level of specificity in the case of WHR and CI (0.01 and 0.02, respectively) is remarkable. If we look again at Table III, we can see that in group 3 the minimum and maximum WHR values of the whole sample are included. This means that the student with the lowest WHR value may be probable overweight according to other anthropometric methods, so this index would not be useful in this population. The situation for the CI is similar and coincides with the low correlation between the IC and the WHR with the other anthropometric methods that respond in a more homogeneous way. In the case of men, it has been observed that the best methods are the WC, with a cut of 97.5, followed by Siri and Brozek equations, with 25.36% and 24.67% of body fat respectively, which detect 100% of patients at risk discarding 97% of healthy individuals, in the case of WC, and 94% of those in the case of Siri and Brozek equations.
For women, the cut-off points in the present study are lower than those described in the literature. This makes sense because this work focuses on the prevention of overweight, which may be undiagnosed with a single index. However, the opposite occurs in the case of men. The cut-off points reflected after the analysis of the ROC curves are greater than those described in the bibliography for each specific method. For example, we find that for BMI the cut-off point is 28.38, greater than the value 25 that defines overweight. This situation could be explained because, in young people, females and males tend to take different exercises and sports. In particular, men frequently practice sports that increase their muscular mass, with a consequent rise in weight without increasing fat mass.
In the case of the proposed new index, NWAI, we see that for women with a value of -0.25 we detect 100% of students likely to be overweight or with a cardiovascular risk associated, discarding 69% of healthy women. In the case of men the cut-off point 1.20 is more effective as discards 92% of healthy subjects.
Comparing both genders, there are differences in the cut-off points between men and women. There are significant differences in body composition between men and women, so, as in the previous study of Price et al. 33, the establishment of different cut-off points for both genders should be considered as necessary.
Depending on the anthropometric method used, there can be great differences in the classification of an individual in a situation of overweight/obesity or cardiovascular risk or, conversely, in a healthy situation. Therefore, the option of integrating certain anthropometric variables related to overweight and cardiovascular risk should be considered in order to determine the cut-off points of each anthropometric method with maximum sensitivity, to define when it should be considered that a student may be in a situation of overweight or cardiovascular risk, and if so, recommend complementary tests to confirm or rule out this situation.
WC and WHtR have been reported as good indicators of CVD risk, followed closely by BMI 34, whereas others studies concluded than BMI was the best indicator for blood pressure but not for lipoprotein plasma levels 35,36. The NWAI measures the same variables as BMI. Furthermore, the correlations between the NWAI and BMI, WC and WHtR were very high. To prevent overweight and obesity or cardiovascular risk among university students, specific cut-off points, or even the proposed NWAI, adapted to the characteristics of that population should be applied to enable more accurate anthropometric evaluations. Although the NWAI is not as accurate as BMI in women, it would be convenient to consider its use for ease in performing statistical treatments because of the linear structure of its equation. WC also meets these criteria, so we thought it would be the first choice. In the case of men, the most precise methods are the Siri and Brozek equations, but they require specific material to measure skinfold thickness and the mathematical structure of their equations would make it difficult to treat them statistically if epidemiological studies are required.
The importance of interventions among those aged 18-29 years to prevent obesity has been highlighted 37. In a similar study, Li et al. 38 reported that the largest increment in WC and WHtR occurred at 18-19 years of age. Both studies, as well as the present study, suggest that intervention efforts to prevent obesity should focus on this age range.
CONCLUSION
In this kind of population there is a low prevalence of overweight or obesity, although it is increasing. Moreover, there are also people close to this status that may be misdiagnosed depending on which anthropometric method is used, so that they cannot be properly warned about it. The cut-off points of classical anthropometric equations or indexes are designed to identify people who are already overweight or at cardiovascular risk. In the present study, we try to eliminate this bias and establish cut-offs that cover the different variables related to health risk derived from overweight, with the aim of persuading these subjects in time so that they could make changes in their lifestyle if necessary.
BMI is the best method to detect women with probability of being overweight in the studied population, with a cut-off value of 23.53, while WC is the best method in case of men, with 97.5 cm. The cut-off points for women and men using the NWAI were -0.25 and 1.22, respectively. The NWAI is economical, easy to apply, it does not require trained staff and it is easy to treat statistically. Thus, the NWAI could be a valid alternative to current indexes for the early detection of overweight/obesity in male and female university students.

