


 Servicios personalizados
 Inglés (pdf)
 Articulo en XML
 Referencias del artículo
 Enviar articulo por email
 Citado por SciELO
  Citado por Google
  Similares en
SciELO
Similares en
SciELO  Similares en Google
 Permalink
INTRODUCTION
In Spain, the prevalence of overweight and obesity has substantially grown in the past three decades 1. A large body of evidence has suggested that the relationship between obesity prevalence and obesity-related metabolic disorders has a socioeconomic gradient, in such a way that these disorders affect mostly people with limited resources and racial-ethnic minorities 2. Poor diet is a particular concern when talking about children of a low socioeconomic status (SES), because they eat less fruit and vegetables 3 and more sugar-added food 4. It is evident that the purchase of fruit and vegetables is price sensitive and that their high cost is a barrier to increase intake 5. In order to save money, families limit their spending on food, and tend to consume less healthy but cheaper food, as well as their expenses in relation to recreational physical activities 6.
One dietary factor which has recently been drawing attention is beverage consumption. Beverages are currently providing more calories and a larger percentage of daily energy intake than at any other time in history 7. Some authors have reported that the greatest increase of soft drinks consumption in USA has been observed in children and adolescents from lower SES and minorities 8, noticing also that they consume more soft drinks than their counterparts from high SES 9. Other authors have reported that, in less developed countries, higher levels of maternal education are associated with higher consumption of soft drinks by children, partly because there is no safe water to drink 10. With respect to other beverages, several review studies proved that high-fat dairy consumption within the typical dietary patterns is inversely associated with obesity risk 11,12. Another recent study showed that higher-SES children had higher intakes of water coming from milk 13. In an Australian study, it was found that advantage adolescents who reported greater attachment to family mealtime rules had greater odds of consuming dairy foods frequently 14.
Water consumption is one of most studied questions during the last years. Some authors have proposed that drinking more water could be one method to reduce weight gain since water consumption could replace other caloric beverages and, thereby, reduce the total amount of calories consumed 15. In fact, our study shows that higher consumption of water in children was negatively associated with body mass index (BMI), body fat and other cardiometabolic parameters 16. Moreover, consumption of tap water provides a low cost beverage option and, according to a study carried out in the USA, one in six children does not drink tap water, a figure which is more pronounced among minorities, even in communities where tap water is safe 17. In addition, in some low income countries, like Mexico, the lack of available potable water in households and schools coincides with the increase in soft drinks consumption 18, as it occurs with American children's households, where plain water consumption (bottle and tap) tends to be associated with higher incomes 19. In contrast, no socioeconomic gradient for plain water consumption was observed among French children 20.
Due to controversial results and scant evidence, the aim of the present study was to explore if a relationship can be established between socioeconomic status and beverage consumption in Spanish children.
MATERIAL AND METHODS
STUDY DESIGN AND PARTICIPANTS
This is a cross-sectional analysis of baseline data from a cluster-randomized trial aimed to assess the effectiveness of a physical activity program on prevention of excess weight in children from 20 public schools in the province of Cuenca (Spain) 21. For this report, data from a sub-sample of 182 children (74 girls) aged between nine and eleven in fifth grade of Primary Education, from 20 public primary schools, were used. The study protocol was approved by the Clinical Research Ethics Committee of the Hospital Virgen de la Luz in Cuenca.
ASSESSMENT OF BEVERAGE INTAKES
Beverage consumption of each participant was estimated using the Young Adolescents Nutrition Assessment on Computer (YANA-C), a self-administered computerized 24h dietary recall validated for European adolescents 22. The Spanish version of the YANA-C questionnaire was administered twice a week, once asking about a weekday and the second time, about a weekend day. The YANA-C program was installed in the computer room of each school, where pupils completed the questionnaire in groups. A trained staff member instructed the children on the software and thereafter, pupils completed it autonomously, although two or three staff members were present to provide assistance in case it was required.
Beverages were grouped in nine categories: a) water as a beverage (plain water, bottled water, and water with flavor without sugars added); b) soft drinks (calorically-sweetened soda and sport drinks); c) diet drinks (non-caloric sweetened beverages, diet sodas, or other diet beverages); d) fruit drinks (< 100% fruit juices and others with added sugars); e) 100% fruit juices (natural fruit juices and commercial 100% fruit juices without added sugars); f) skimmed and semi-skimmed milk; g) whole milk; h) milk drinks (beverages derived from milk with or without sugars); and i) other beverages (soya beverages, vegetable juices, coffee, tea, infusions, horchata, cereal drinks, etc.). The last group included various types of beverages consumed sporadically, with the aim of making further analysis. Alcoholic beverages were excluded. Beverage intake was defined as the sum of all these categories.
PARENTAL SOCIOECONOMIC STATUS
Data for parental SES were gathered by using self-reported questions completed by either father or mother about their occupation and education. Paternal and maternal information about their education was classified separately as Primary Education (functionally illiterate, without any studies or not having completed Primary Education), middle education (Primary Education or high school/Secondary Education) and university education (university degree or PhD). Parental occupation was divided into five categories: a) supervisor/manager or freelance with ten employees or more; b) supervisor/manager or freelance with less than ten employees; c) freelance with no staff; d) non-qualified staff and unskilled worker; and e) household chores, unemployed and others. An index of SES was calculated based on the items that referred to the parents' education and parental occupation classifying SES as: lower-lower/middle, middle and middle/upper-upper, according to the scale proposed by the Spanish Society of Epidemiology 23. Information was gathered in three groups to obtain more accurate results as described below: lower-lower/middle, middle, and middle upper-upper.
CARDIORESPIRATORY FITNESS
Cardiorespiratory fitness (CRF) was assessed by the 20-m shuttle run test 24. Participants were required to run between two lines 20 m apart, while keeping pace with audio signals emitted from a pre-recorded compact disc. The running speed started at 8.5 km/h and increased 0.5 km/h each minute. The children were stopped when they could not follow the signal any more. The last half-stage completed was noted as an indicator of their CRF.
ANTHROPOMETRIC AND BODY COMPOSITION VARIABLES
Children were weighed and measured twice whilst wearing light clothing and without shoes, using a calibrated digital scale to the nearest 0.1 kg for weight and a wall mounted stadiometer to the nearest 0.1 cm for height. The mean of this measurements was used to calculate body mass index (BMI) as weight in kilograms divided by the square of the body height in meters (kg m2). Waist circumference (WC) was calculated as the average of two measurements taken with flexible tape at the natural waist (the midpoint between the last rib and the iliac crest). Body fat percentage and fat free mass percentage were estimated using a BC-418 bioimpedance analysis system (Tanita Corp., Tokyo, Japan). The mean of two readings taken in the morning after urination and a 15 min rest, with the child without shoes and fasting. All measurements were obtained at the schools by trained nurses.
STATISTICAL ANALYSIS
The distribution of continuous variables was checked for normality before the analysis. Continuous variables were expressed as mean ± standard deviation for normally distributed continuous data. Categorical variables were expressed as n (%). Normal weight and overweight-obesity were defined according to the BMI cut-offs published for children and adolescents 25. ANOVA models were estimated to test the differences in beverage intake variables by categories of SES (lower-lower/middle, middle, middle/upper-upper), adjusted for age, sex and CRF. The statistical analyses were conducted with the SPSS version 22 (SPSS Inc., Chicago, IL).
RESULTS
We studied 182 subjects with an average age of 10.04 ± 0.46 years, of whom 40.6% were girls. Table I shows anthropometric and body composition variables, socioeconomic characteristics and beverage intakes of the participants. Body fat percentage was higher in girls (p < 0.001), and cardiorespiratory fitness in boys (p < 0.001). Obesity prevalence was higher in boys (p < 0.007), and no sex differences were found with regard to their SES. Girls presented higher amounts in some categories, such as total beverage intake (p = 0.041), water from beverages (p = 0.042), water/kg weight (p = 0.034) and water as a beverage (p = 0.020). Conversely, diet drinks consumption was higher in boys (p = 0.003).
Table I Sex and parental socioeconomic status differences in body composition

Values are means (standard deviations ± SD) and number and proportions (%) for categorical data. BMI: body mass index. and beverage intake
Table II Mean differences between beverage intake and socioeconomic status in children adjusted for age, sex and cardiorespiratory fitness
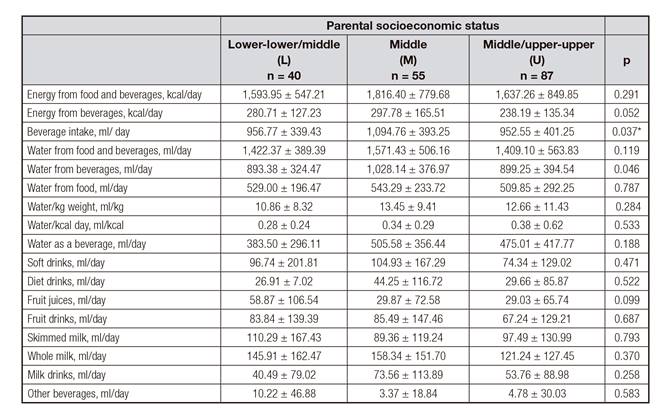
*M > U. Differences between M vs U (p = 0.048).
In Table II, we analyzed beverage intake by SES categories. Energy intake (food and beverages) and energy from beverages were higher in middle status children, although differences were not significant. Also, beverage intake was higher in middle status children (p = 0.037) compared to the upper SES. In most of the water intake categories, there was a higher consumption in middle status children, although it was only significant when referring to water from beverages (p = 0.046). Regarding other beverages categories, middle status children consumed more soft drinks, diet drinks, fruit drinks, whole milk and milk drinks. In contrast, lower and lower-middle status children's consumption of fruit juices and skimmed milk was higher. All of these results did not show any statistical differences.
DISCUSSION
The current study analyzed beverage consumption by sex and SES in schoolchildren living in Cuenca's province. Overall, no differences by SES were observed, except for beverage intake, which is higher in middle status children than in those with an upper status, and consumption of fruit juices and skimmed milk intakes, which were higher in lower SES categories children. Girls drank more water from beverages and boys, more diet drinks.
FLUID INTAKE AND ENERGY FROM BEVERAGES
Nowadays, some studies have paid particular attention to families' socioeconomic gradients and their relationship with dietary habits 26,27,28. A recent study in Europe has shown that fluid intake is higher in middle SES children with significant differences with respect to children with other status 29. Similar data were drawn from our analysis.
Conversely, a study conducted on Mexican population reported that medium and high SES people's energy intake from unhealthy beverages was higher than in low SES 30.
SOFT DRINKS AND SWEETENED BEVERAGES
A recent study in Norway has shown that adolescents from higher SES families consume more fruit and vegetables and less soft drinks and sweets than their counterparts 31. This is in line with our data and those reported by other European studies 9, although in these countries soft drinks are more expensive than in our country and perhaps that is the reason why their consumption is lower than in countries where they are very cheap and easy to purchase. In general, in Europe, as in the ToyBox study 29, lower SES schoolchildren consume more soft drinks than their high SES peers; on the contrary, in Latin America 32, as well as in children from other regions such as Lebanon 13, a higher consumption of soft drinks and sweetened beverages in higher SES schoolchildren has been reported.
PLAIN WATER
According to our data, girls drank higher amounts of water than boys. Moreover, in most water categories, middle SES status children drank higher quantities than children from other status. These data are different than those reported in preschoolers from other European countries, where a lower intake of plain water has been reported in lower SES 29.
FRUIT JUICES
Among our sample, those with low SES consumed more fruit juices than their high and medium status peers. This SES consumption pattern is different from those reported in other countries 13,32. In other analysis carried out on preschoolers, it is described that the consumption of fruit juices is higher in low income families 33, being these data more similar to ours. For example, in the United States it has been reported that children from racial/ethnic minorities and lower income groups 34 consume more 100% fruit juice, possibly because it replaces whole fruit, which is generally more expensive but nutritionally more complete. Moreover, until a few years ago, it existed a popular belief according to which fruit juice consumption was similar to eating a piece of fruit 35. However, this erroneous notion has been discarded, and thus, the current recommendations are to increase the consumption of natural fruits and to reduce the consumption of juices 36,37.
MILK CONSUMPTION
Both in Australia 14 and the USA 38, it has been reported that adolescents from high SES families consumed more dairy foods than their counterparts. Likewise, a similar pattern has been described in Mexico 32. According to the study in Lebanese children, those with a low SES had lower water intakes from milk (unspecified type). Our data confirm these findings, and not many significant differences were found.
LIMITATIONS
This study has some limitations that should be pointed out. First, our study had a cross sectional design, thus observational findings do not allow us to evaluate causal relationships among variables. Second, our sample size lacks enough statistical power to control some potential confounders. Moreover, the assessment of diet in children, either directly or by an adult proxy, has some methodological weaknesses. It has been suggested that 10-year-old children are not able to give valid responses to food frequency questionnaires covering periods longer than one day; however, in our study, the use of pictures in the YANA-C software helped children to remember not only the food eaten during the last 24 hours, but also the portion size.
CONCLUSION
In general, our study did not find a significant relationship between beverages consumption and SES, except for beverages intake and water from beverages categories, which were higher in children from middle-status compared to upper SES children. It is important to emphasize that data were collected before the Spanish economic crisis reached its peak, thus, supposedly, families had not limited their family food spending yet. It is true that most part of less healthy drinks, such as soft drinks and packaged juices, have often very low prices, affordable for people with limited resources. In addition, these products are also easily available to children due to vending machines in schools, hospitals, shopping centers or shops in the streets. For these reasons, the easy access to less healthy drinks should also be controlled for children, and perhaps the installation of free water sources in schools and streets should be considered, since it is shown that it increases their consumption 39. These and other policies can help improve the hydration habits of children in our country independently of socioeconomic status. Future research is needed to identify this complex relation between socioeconomic inequality and eating behaviors', in particular among children.

