


 Servicios personalizados
 Inglés (pdf)
 Articulo en XML
 Referencias del artículo
 Enviar articulo por email
 Citado por SciELO
  Citado por Google
  Similares en
SciELO
Similares en
SciELO  Similares en Google
 Permalink
INTRODUCTION
Promotion of a healthy diet and involvement in physical activity among young people has an important impact on their actual and future lifestyle, health and well-being 1,2,3,4,5. World Health Organization and several health organizations underlines the importance of adopting a varied diet, with daily consumption of food products from different food groups, such as meat or meat alternatives, dairy products, fruits and vegetables and grains 1,2,6,7,8,9,10. Moreover, attention should be paid to the quantity of consumed food products as well as to their quality, since among the same food group there are products which are healthier than others and should be included more frequent in the diet (i.e. low fat dairy products, lean meat such as fish and chicken, dark bread, whole grains, fresh fruits and vegetables) 1,2,9,10. The cooking techniques are also important, being underlined the importance of limiting the adding of sugar, salt and different types of fat in the dishes as well as consumption of processed meat and fried foods 10,11,12,13,,14,15,16.
Food consumption should be divided in three main meals per day plus 1-2 snacks, the starting of a day with a balanced breakfast being very important 1,4,5.
Moreover, the importance of performing physical activity at least half an hour per day among young adults is also emphasised, as well as the benefits of maintaining an appropriate body mass index (BMI) or achieving an appropriate BMI using methods which do not pose threats on health 17.
Nevertheless, several studies in Europe and worldwide underline that there are young people who are not fulfilling several of the recommendations regarding healthy diet and an active lifestyle, the prevalence of the unhealthy behaviours and their determinants varying between countries, but also between different groups from the same country, while different trends across the lifespan or during several periods of time might be also observed 18,19,20,21,22,23,24,25,26).
Several studies underline that healthy or unhealthy dietary, physical activity and weight related behaviours often do not occur in isolation and are correlated with each other in different ways. Moreover, there is also a possible synergetic effect of multiple health behaviors on the risk of chronic conditions and other health outcomes 22,23,24,27.One important area of research which needs further investigation is the relationship and accumulation existing between different dietary patterns, physical activity, body mass index and weight-related behaviours.
Romania has changed the communist regime in 1989 and started socio-economical changes which lead to its admission in European Union in 2017. These changes also had influences on the food products available on the market, cultural and gastronomic exchanges with other countries, marketing of different food products, habits related to obtaining, cooking and serving food. Despite this, there is little information with regard to dietary patterns, physical activity and weight related behaviours as well as their interrelationship among young population from Romania 26,28,29,30,31.
For university students, the university period is characterised by transition into adulthood, increasing independence, autonomy, and responsibility, including living apart from their parents and being the only responsible for choosing, buying and coking their food, deciding the content, the quantity and the moment of their meals and snacks. These results in a shift in composition and quality of the diet and several studies have found that diet quality may worsen during this transition 21,22,23,24,25,32.
Hence, this study focuses on university students from Cluj-Napoca, a big university town situated in the North-West part of Romania and has two main objectives. The first one is to investigate dietary patterns, physical activity, and body mass index and weight-related behaviours among university students, giving a special attention to possible differences between 2003 and 2016 as well as to gender differences at each time point. Second, the study assesses the relationship existing between the investigated issues at both waves.
MATERIAL AND METHODS
STUDY SAMPLE AND PROCEDURE
The study was performed in Cluj-Napoca, an important university town from North-West part of Romania, in 2003 (T1) when limited information with regard to dietary habits, physical activity and weight related behaviours among Romanian youth was available and was repeated in 2016 (T2) in order to have a recent evaluation of the situation. It involved university students randomly chosen from 8 dorms belonging to the 4 main universities of the town. At each wave a number of 80 students (40 girls, respectively 40 boys) living in the selected dorms were randomly chosen from each university, driving to a total sample of 320 students aged 19-24 at each time point. They were informed about the voluntary participation. The refusal rate was low (3.7% in 2003 and 4.7% in 2016) and the students who refused to participate were replaced with students from the same university, living in the same dorm.
The study is part of a research project which received the ethical approval of the Ethic board of University of Medicine and Pharmacy from Cluj-Napoca, Romania.
INSTRUMENT FOR DATA COLLECTION
All students were asked to fill in an anonymous questionnaire, which investigated several socio-demographic characteristics (i.e. age, gender) and a wide range of health related behaviours, including one section focused on nutrition, physical activity and weight related behaviours. Because of the wide range of investigated health risk behaviours and the fact that no instruments for data collection were validated in Romania in 2003, this questionnaire was developed especially for this study based on data from literature and instruments used in other international studies 1,33,34.
The present study is focusing on the following issues: frequency of consumption of several food products, eating breakfast, eating in fast food restaurants more than two times per week, involvement in physical activity, body mass index, body weight management in the moment of the performance of the survey as well as use of several methods for losing weight in the last year.
Frequency of consumption of several food products was assessed through a short food frequency questionnaire (FFQ), which evaluated the frequency of consumption of several food products in the last month (less than once/month, 2-3 times/month, once/week, two times/week, 3-4 times/week, 5-6 times/week, once every day, more times/day). In 2003 the reliability and the validity of the FFQ questionnaire was evaluated. A pilot survey was performed among 40 students. They filled in the FFQ and one month later they filled in the FFQ again. Comparing the frequency of consumption (less than weekly, 1-2 times/week, 3-4 times/week, 5-6 times/week, every day) assessed by the two FFQs, it was found that the Pearson correlation coefficients varied between 0.34 to 0.74 for the main food products. Between the administrations of the two FFQ the students were also asked to fill in a food diary (FD) for three consecutive days (one day during weekend and two days during the week). Frequency of intake of food items from the FFQ was based on weekly frequencies, while data from the FD were based on frequency over three days. Hence, to provide comparable data, the data assessed through FD were converted into a weekly intake. Since the FD included 2 week days the frequency of food assessed by FD during week days was multiplied by five and divided by two, while for the weekend day the frequency of consumption was multiplied by two; the results were then summed up. Comparing the frequency of consumption of the main food items assessed with food diary and the first FFQ there was noticed a range of the Pearson correlation coefficients between 0.31 and 0.67.
Students were also asked how frequent they eat breakfast in the last week (never, 1-3 times/week, 4-6 times/week, every day) and if they have eaten in fast food restaurants more than two times per week (yes vs. no).
The involvement in physical activity was assessed by asking students about number of days in the last week when they were involved in vigorous physical activity (A) and moderate physical activity, including walking (B) as well as how long (how many minutes) was the duration of vigorous activity (C) and moderate activity (D).Similar with other studies, we considered that 30 minutes of vigorous physical activity were equivalent to 60 minutes of moderate physical activity 8,34. The medium number of minutes per day (PA) of moderate physical activity was calculated according with the following formula:
PA = (2(A X C) + (B X D))/7
Height and weight were auto-estimated and declared in the questionnaire by each participant and body mass index (BMI) was calculated using the following formula: BMI = weight / (height x height). Cut-off values for body mass index were considered as follows 8:
The students were also asked what are they currently doing with regard to their weight (losing weight, gaining weight, maintaining their current weight, nothing) as well as if they have used any methods in the last year for losing weight (dieting, sport, vomiting, pills, special tea, sauna/massage).
DATA ANALYSES
The prevalence of the investigated behaviours was calculated and chi2 tests were used to assess differences between the two waves with regard to weekly and daily consumption of several food products, BMI, performing of physical activity, methods used for losing weight.
The factor analysis using the method of principal components with unrotated factor solution was used to recognize major dietary structures according to 24 food products. Similar with other studies, we considered that main dietary structures referred to the factors with Eigenvalues of over 1.5 28. The regression method was used to measure the scores of factors for every pattern and for each person.
Pearson correlation was used to assess the association at each weave between gender and frequency of consumption for different food products, main dietary structures, consumption of breakfast, eating in fast food restaurants more than two times/week, involvement in physical activity, BMI, methods used for losing weight.
Moreover, at each time point Pearson correlation was used also for evaluation of the associations between the main dietary structures, consumption of breakfast, eating in fast food restaurants more than two times/week, involvement in physical activity, BMI, methods used in the last year for losing weight. According to Cohen, strong correlation was considered at r > 0.50, while medium and small correlation was considered at r > 0.30 and r > 0.10, respectively.
Data analysis was performed with SPSS-20 statistics program. Statistical significance is reported at p < 0.05.
RESULTS
DIETARY PATTERNS
Table I presents the frequency of consumption of several food products in 2003 and 2016. It shows that daily consumption of dairy products decreased between T1 and T2 from half of the students to one third of the students, while the percentage of those who consume dairy products less than once per week increased from 5% to 10%.
Table I Dietary patterns

aStatistically significant differences at chi2 tests between the two waves with regard to weekly consumption. bStatistically significant differences chi2 tests between the two waves with regard to daily consumption.
With respect to meat consumption, it is noticed that pork meat, chicken meat, processed meat (ham, salami, sausages) are the most preferred by the study samples, with consumption of processed meat and pork meat being quite similar at T1 and T2, while chicken consumption at least once per week as well as daily increased statistically significant between the two waves. Around half of the students ate beef at least once/week, without significant differences between the two waves, while the consumption of fish at least once/week increased from 20% in 2003 to 37% in 2016. Around 80% of students ate eggs at least once per week and one out of ten students declared daily eggs consumption both at T1 and T2.
The majority of students eat fruits and vegetables at least once per week, but only 20% of them eat fruit every day, while around 13% eat vegetables every day, without to be noticed statistically significant differences between the two waves.
Less than 20% of students eat pulses at least once/week and less than 10% eat soya at least once per week; no statistical differences were noticed between T1 and T2. Half of the students eat seeds at least once per week, while one third consumed different types of nuts at least once per week. Again, no statistical differences were noticed between the two waves.
With regard to the consumption of grains and potatoes we noticed the preference of students for white bread (more than 85% eat at least once a week and around 70% eat it every day) and potatoes (more than 90% eat at least once a week, while around 20% eat every day), while dark bread was consumed at least once per week by one third of the students, with a slightly increased between the two waves. Half of the students eat pasta at least once a week and the percentage remains quite similar between the two waves. Breakfast cereals at least once/week increased from one third of the students to half of them, while the daily consumption increased from 2.5 to almost 10% from T1 to T2.
The majority of students declared consumption of sweets as well as soft drinks at least once a week. At both waves one out of five students declared eating sweets/cakes every day, with no statistically significant difference, while the daily consumption of soft drinks increased from 22.5% to 29.4%.
Half of the students eat chips/snacks at least once/week and around 6% do it every day, without to be noticed statistical differences between the two waves. The consumption of traditional fat similar with fatty bacon at least once per week decreased from 27% to 18% from T1 to T2, while consumption of pizza at least once/week increased from 20% to 40% between the two waves.
The results of the factor analyses reveal three main dietary structures at both waves.
As shown in Table II, factor one describes a varied diet and included at both waves consumption of dairy products, pork and chicken meat, fruits and vegetables, white bread and sweets/cakes. Factor two describes a diet rich in white meat, dietary fibres and varied sources of carbohydrates and comprised of consumption of dairy products, chicken and fish meat, pulses, soya, nuts (only at T1), fruits and vegetables, pasta, rice, cereals. Factor three reveals a diet high in red meat, fat, sugar and included consumption of pork meat, processed meat (ham, salami, sausages),potatoes, seeds, chips/snacks, traditional fat, pizza (only at T2), sweets/cakes as well as soft drinks. The explained variance was 39.2% at T1 and 40.2% at T2.
Table II Main dietary structures-results of factor analysesa

aFactor loadings higher than 0.30 are depicted. bFrequency of consumption was coded as follows (0)-less than once/week, (1)-1-2 times/week, (2)-3-6 times/week, (3)-every day.
On the other hand, eating in fast food increased statistically significant from 8.4% to 19.4% between the two waves, while eating breakfast every day was 26.5% at T1 and 27.5% at T2.
The results of the Person correlation reveal several issues with regard to gender differences regarding dietary patterns. At T1 girls consumed less frequent pork meat (r = -0.181), processed meat (r = -0.218), traditional fat similar with fatty bacon (r = -0.223), chips/snacks (r = -0.120), and more frequent dairy products (r = 0.133) and fruits (r = 0.124), while at T2 girls consumed less frequent pork meat (r = -0.165), pizza (r = -0.170), chips/snacks (r = -0.150), and more frequent white bread (r = 0.126) and fruits (r = 0.120).
Girls had lower scores for factor 3 at both T1 (r = -0.150) and T2 (r = -0211).
On the other side, at both waves girls were less likely than boys to go to fast food restaurants more than two times/week (r = -0.124 at T1 and r = -0.318 at T2) and were more likely than boys to eat breakfast daily at T1(r = 0.201).
PHYSICAL ACTIVITY, BODY MASS INDEX AND WEIGHT RELATED BEHAVIOURS
The average time spent for physical activity per day for the whole sample was 97 minutes (SD = 61) at T1 and 89 minutes (SD = 58) at T2. Table III shows that one out of five students did not perform at least half an hour of physical activity per day, without to be noticed statistically significant differences between the two waves. The percentage of those who perform more than one hour of physical activity per day decreased significantly between the two waves from 45.7% to 35.1%.
Table III BMI, physical activity and weight-related behaviours
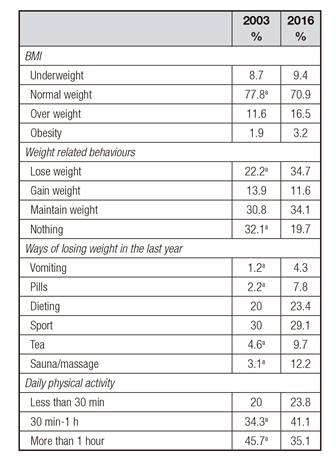
aStatistically significant differences at chi2 test between the two waves.
The mean BMI for the whole sample was 21.7 (SD = 2.7) at T1 and 22.4 (SD = 3.2) at T2. The normal BMI decreased from 77.8% at T1 to 70.9% at T2, while the overweight or obesity increased statistically significant from 13.5% at T1 to 19.7% at T2.
With respect to weight related behaviours, less than one quarter of the students tried to lose weight in 2003, while one third of students declared this at T2. The percentage of those who wanted to gain weight was 13.9% in 2003 and 11.6% in 2016. The methods used in the last year for losing weight were mainly physical activity and dieting, without to be noticed statistically significant differences between the two waves. On the other side, it is noticed a statistically significant increase in the use of vomiting (1.2% vs. 4.3%), pills (2.2% respectively 7.8%), tea (4.6% vs. 9.7%), sauna/massages (3.1% vs. 12.2%).
The results of Person correlation analyses show that at both waves girls were more likely than boys to have a lower BMI (r = -0.228 at T1, r = - 0.201 at T2) and were likely to use in the last year methods for losing weight such as dieting (r = 0.244 at T1, r = 0.184 at T2) and massage (r = 0.242 at T1 and r = 0.162 at T2).Vomiting was more frequent among girls at T2 (r = 0.160).
INTERRELATIONSHIPS BETWEEN DIETARY PATTERNS, PHYSICAL ACTIVITY, BMI AND WEIGHT-RELATED BEHAVIOURS
Table IV presents the association between the main dietary structures and several alimentary habits, involvement in physical activity, BMI and methods used for losing weight in the last year.
Table IV Associations between main dietary structures, alimentary habits, BMI and weight-related behaviours
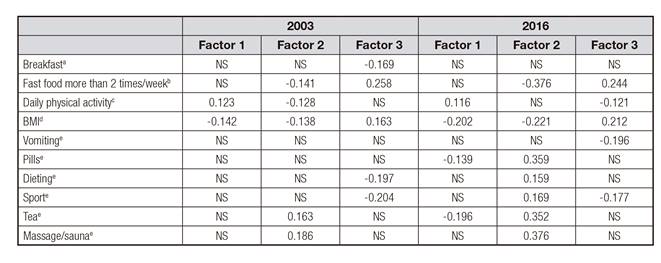
NS: non-significant. aNot eating breakfast every day (0) vs. eating breakfast every day (1). bNot eating in fast food restaurants more than 2 times/week (0) vs. eating in fast food restaurants more than 2 times/week (1). cPerforming daily physical activity less than 30 minutes/day (1), 30 minutes-1 hour/day (2), more than 1 hour (3). dUnderweight (1), normal weight (1), overweight (2), obesity (4). e0-No, 1-Yes.
At both waves, the dietary structure characterised by a diverse diet was positively associated with a higher involvement in physical activity, lower BMI and at T2 it was negatively associated with using in the last year of dieting methods such as pills and tea.
The dietary structure composed of eating white meat, diverse sources of carbohydrates, high fibre content was negatively associated with eating in fast food restaurants more than two times/week (at both waves) and with involvement in physical activity (at T1), but it was positively associated with using of different methods for losing weight such as tea and sauna/massage (at both waves), as well as pills, dieting, sport (at T2).
The last dietary structure described by red meat consumption, high fat and sugar content was positively associated with eating in fast food restaurants more than two times/week and higher BMI at both waves. It was negatively associated with eating breakfast frequently at T1 and less daily physical activity (at T2), as well as with the use of different methods for losing weight like sport (both at T1 and T2), dieting (at T1) and vomiting (at T2).
As shown in Table V, consumption of breakfast every day was inversely associated with eating frequently in fast food restaurants at T1 and with daily involvement in physical activity at T2. Moreover eating at fast food restaurants was associated with lower involvement in physical activity at T2 and higher BMI at T2. Higher involvement in daily physical activity was inversely associated with BMI at both waves. At the same time those with higher BMI were more likely to use vomiting for losing weight.
Table V Associations between alimentary habits, BMI and weight-related behaviours

NS: non-significant. aNot eating breakfast every day (0) vs. eating breakfast every day (1). bNot eating in fast food restaurants more than 2 times/week (0) vs. eating in fast food restaurants more than 2 times/week (1). cPerforming daily physical activity less than 30 minutes/day (1), 30 minutes-1 hour/day (2), more than 1 hour (3). dUnderweight (1), normal weight (1), overweight (2), obesity (4). e0-No, 1-Yes.
There are also several correlations between different methods for losing weight. The strongest correlation was between use of pills, tea and massage/sauna (especially at T2). There were also associations between pills use and dieting, as well as sport and dieting. Vomiting was inversely associated with sport (at T2) and positive associated with consumption of pills, tea (at both waves) and massage (at T1).
DISCUSSION
This study describes dietary patterns, physical activity and weight related behaviours among Romanian university students from one big city situated in North-West Romania. It has three main strengths. The first one is the study sample, since it represents one segment of Romanian population which was not included in national representative studies performed until now. Second, it assesses trends between 2003 and 2016. Thirdly, it investigates several main dietary structures and their relationship with alimentary habits, physical activity, body-mass index and weight related behaviours.
The results underline that daily fruit and vegetable intake remain low, but stable, while milk and dairy products consumption every day decreased in 2016 compared with 2003. Other studies from Romania also underline the insufficient consumption of fruits and vegetables among several age groups 31,36,37,38. Eurostat study shows that two thirds of the Romanian population older than 15 years is not eating fruits and vegetables on daily bases 39.
Processed meat, pork meat, chicken meat and eggs were the most preferred types of meat and alternatives, with daily consumption of chicken meat increasing between the two waves. Fish meat consumption was very low, but its consumption at least once/week increased between two waves. Other studies also underline the preferences for these types of meat and alternatives, including consumption of processed meat products in this area of Romania 29,38. The increase in fish consumption might be the consequence of a better availability as well as educational messages with regard to its health benefits.
With regard to the consumption of grains and potatoes, it is noticed the preference of students for white bread and potatoes, their daily consumption being similar at both time points. Other studies also present similar preferences among different Romanian population groups 29,38. Weekly consumption of dark bread had a slightly increased, while the weekly as well as daily consumption of cereals has significantly increased. This tendency is in accordance with the increase and diversification of the availability of these products on the Romanian market combined with a more intense marketing and advertisement.
Consumption of sweets/cakes has been relatively constant over time, while the soft drinks consumption increased. The weekly consumption of the traditional fatty bacon decreased, but the weekly consumption of pizza increased. Furthermore, the percentage of students who eat in fast food restaurants more than two times/week doubled between the two waves. This is in accordance with the opening and promotion of several fast food restaurants in the last years in Romania.
Eating breakfast every day was low, but similar at both waves. Several studies from Romania shows an inappropriate consumption of breakfast among adolescents and young people as well its tendency to decrease with age 4,5,32.
There were several interesting relationships identified between dietary patterns, physical activity, BMI and weight related behaviours.
The eating patterns were interrelated and the factor analyses revealed three main dietary structures which were similar at both waves. The first one describes a varied diet including dairy products, pork and chicken meat, fruits and vegetables, white bread and sweets/cakes. The second one shows a diet rich in white meat (chicken and fish meat), dietary fibres (pulses, soya, nuts, fruits, vegetables) and varied sources of carbohydrates (pasta, rice, cereals) as well as dairy products. The last one refers to a diet which contains red meat (pork meat, processed meat), fat (chips/snacks, traditional fat, pizza), potatoes, sugar (sweets/cakes as well as soft drinks).
The first dietary structure seems to be protective against overweight and obesity and it is positively associated with higher enrolment in physical activity, while has a negative association with using methods for losing weight such as pills and special tea.
The second dietary factor is also protective for overweight and obesity. Moreover, it has a negative association with eating in fast food restaurants more than two times/week, but it is also negatively associated with daily physical activity (at T1). It is also characterised through an association with a higher preoccupation for using several methods for losing weight such as dieting, sport, pills, tea, and massage.
The last dietary structure is not presenting only a cumulative risk by a combination of red meat, high fat and sugar content, but it is negatively associated with involvement in physical activity, while being positively associated with eating in fast -food restaurants more than 2 times/week. It is associated with a higher BMI, which is not surprising since it contains several patterns which predispose to overweight, but the preoccupation for methods for losing weight seems quite low. Girls had lower scores than boys with respect to this dietary structure.
The study underlines that involvement in physical activity at least 30 minutes per day remained similar, but involvement in more than one hour daily decreased. The overweight or obesity increased significantly between the two waves, as well the preoccupation for losing weight. The unhealthy method for losing weight by induced vomiting increased significantly. Pills use for losing weight has also increased; the availability and marketing of these types of products in Romanian have also increased. Similar with other studies, girls had a lower BMI in comparison with boys, but higher tendency for using methods for losing weight 4,26.
Similar with other studies, higher BMI was associated with lower involvement in physical activity and eating in fasts food restaurants more than two times per week 39. There are also several correlations between different methods for losing weight. The strongest correlation was between use of pills, tea and massage/sauna. Sport was positively associated with dieting and negative associated with vomiting.
This study is subject of several limitations: it has a cross-sectional design and a limited sample of Romanian university students from Cuj-Napoca, it used a short food frequency questionnaire which did not get information regarding quantities, while the weight and height were not measured and rely on students own perception.
In conclusion, the results of the study presents trends in dietary patterns, physical activity and BMI as well as weight related behaviours among Romanian university students, showing several unhealthy habits which should be addressed through educational and policy measures. Moreover, it highlights the existence of several main dietary structures, which seems stable over time and are associated with BMI and various physical activity and weight related behaviours. Future studies should further focus on development, implementation and evaluation of comprehensive programs which address the complex issue of promotion of healthy nutrition, active lifestyle and appropriate management of body weight among Romanian university students.

