


 Serviços customizados
 Inglês (pdf)
 Artigo em XML
 Referências do artigo
 Enviar este artigo por email
 Citado por SciELO
  Citado por Google
  Similares em
SciELO
Similares em
SciELO  Similares em Google
 Permalink
INTRODUCTION
The global prevalence of overweight and obesity in preschool-age children has increased dramatically since 1990, from approximately 4% in 1990 to 7% in 2010 1. Furthermore, obesity was more prevalent in children aged 4-5 years (18.3%) and overweight was more prevalent in children aged 8-9 years (25.5%) 2. This great increase in the incidence of overweight and obesity at early ages results in a high prevalence of metabolic syndrome 3. Consequently, obesity is related to decreasing quality of life 4 and to increased healthcare costs due to associated comorbidities, equivalent to 7% of the gross domestic product in developed countries 5.
During childhood and adolescence, environmental factors are the main causes of obesity, due to the energy imbalance caused by a high-energy intake 6 and/or a low level of physical activity 7. Thus, it is crucial to promote preventive interventions in early childhood to impact on lifestyle and prevent the development of overweight and obesity 7.
Over the past decade, a large body of empirical studies has described the correlates and determinants of physical activity in preschoolers 8,9,10,11. Though several tools exist to estimate physical activity approximately, these tools are not so effective at providing a more accurate determination, whether daily or over a certain period 12. For example, physical activity questionnaires obtain a subjective estimation of physical activity. In this field, accelerometry has been shown to be the most reliable method to record the quantity and level of physical activity that each subject performs in each period 13. Accordingly, accelerometers are considered to be the gold standard for free-living physical activity assessment 14.
A meta-analysis of several studies reporting accelerometry-derived daily physical activity levels of preschool-age children concluded that is necessary to develop physical activity guidelines for this range of age due to the confusion between several different cut-off points applied in the literature 15. Consequently, an equation based on these cut points in preschoolers was created 16.
Furthermore, physical activity levels have been assessed in different ways. Some authors define these levels following cut points using ROC curves over 3-7 minutes performing different physical activities in three different sessions 17. Others have measured physical activity levels in various ways: for three minutes using interclass correlation coefficients to modify Children's Activity Rating Scales, obtaining different cut points for three-, four-, and five-year-old children 18; for 20 minutes using the standard deviation (SD) of the counts and VO2, random-coefficient models and multivariate models for gender, race, age, height, quadratic terms for age and height and interactions between these variables and accelerometry counts, determining moderate-to-vigorous physical activity cut points at 420 counts/15 seconds and vigorous physical activity cut points at 842 counts/15 seconds 19; and for an average of 100 minutes, constructing physical activity cut points by ROC analysis, specifically to determine sedentary behaviors at < 1,100 counts/minute 20. A more recent study determined physical activity cut points for preschoolers during a physical exercise session over four consecutive days (during activity time) using the Children's Activity Rating Scales and ROC curve and the ANOVA and Chi-squared test to determine differences between physical activity cut points, obtaining light physical activity at 373 counts/15 seconds, moderate physical activity at 585 counts/15 seconds and vigorous physical activity at 881 counts/15 seconds 21).
Nevertheless, these physical activity levels have recently been revised. The authors concluded there is a need to unify these cut points to determine the true physical activity of these children through methodological studies to advance the understanding of physical activity in this age group 22. Previous studies have focused on analyzing the amount of time that children spend each day in moderate-to-vigorous physical activity, not their total daily physical activity 23. Thus, physical activity such as playing games or in park areas that does not involve moderate-to-vigorous physical activity is not included in these activity measurements though it could be important in the quantification of total physical activity at the end of the day.
Determining reference values for this population is difficult because the variables that could influence physical activity do not use the same time period to determine cut points, or the same hours per day and the same days per week to analyze the physical activity of the children, even though some authors indicate the need to obtain data for ten hours per day to be considered as a valid day 23. The choice of accelerometer cut points can result in large discrepancies 21. Also, determining true physical activity in children requires recording over more days, with the best option being the analysis of consecutive days 8 and throughout the entire day. For this reason, we examined physical activity in two- to seven-year-old children, 24 hours per day over five consecutive days (three workdays and two weekend days) with the aim of establishing daily reference values without the influence of variables. The hypothesis of this study was that by measuring physical activity during this period accurate physical activity levels of preschool children would be obtained.
MATERIALS AND METHODS
STUDY POPULATION
Rafal is a small town of 3,091 inhabitants in Alicante, Spain. It is situated in a rural area in which most of the population lives off the cultivation of fruits and vegetables and the production of wine. Consequently, access to food representative of the Mediterranean diet, such as fruit and vegetables, is not an issue. The socioeconomic status of the families was medium-low, and 22.5% were children of immigrant parents, mostly of Moroccan origin.
STUDY DESIGN AND PARTICIPANTS
We undertook a cross-sectional observational study with quantitative analysis between September 2014 and June 2015, inviting the entire population of children aged between two and seven years (through their parents), either from the pediatric office at the health center, the school or the two kindergartens in the municipality. The parents of all the children read and signed the consent form. Children were excluded if they had any disease, such as diabetes or Down syndrome, which could result in lack of control with the accelerometer.
A nutritionist took the children to the multipurpose classroom in small groups of four. The children who were measured in the pediatric examination room were accompanied by their parents. Weight and height were recorded with the children in underwear and without shoes. Next, accelerometers were placed on the abdominal area of the participants, and the nutritionist explained that the accelerometer could only be removed to aquatic activities (swimming or bathing). The parents helped during this time to ensure the accelerometers remained in place without interruptions and to record the time the child went to bed and woke up as well as any interruption during this period.
VARIABLES AND MEASUREMENTS
The main outcome variable in this study was 24-hour-per-day physical activity. Physical activity was measured for 120 uninterrupted hours (three workdays and two weekend days) by accelerometer (counts/minute), validated to determinate physical activity in this age range 12,24,25. The data procedure was recorded every 15 epochs to maximize opportunities to more accurately capture the sporadic nature of young children's physical activity 26. A valid day may include at least ten hours per day 23, and a minimum of four consecutive days (three weekdays and one weekend day) were required to include a child 27. Half an hour of consecutive zeros was established as inactivity. To determine non-wear time as aquatic activity or some periods of time that children refuse to wear the accelerometer, these periods of time were compared with parent's reports, as well as sleep time, at night and day 27, which was excluded to calculate the mean of counts/minute of the sample.
Secondary variables were weight status (determined by the body mass index [BMI] Z-score), gender, and age. BMI (kg/m2) was calculated from the weight and height parameters obtained, and the BMI Z-score was calculated in relation to age and gender using the Seinaptraker program 28, based on the Orbegozo Foundation standards 29. Children under five years were classified by BMI Z-score into five subgroups: underweight Z-score < -1, normal-weight Z-score ([-1]-1), risk of overweight Z-score > 1 to ≤ 2, overweight Z-score > 2 to ≤ 3 and obesity Z-score > 3. On the other hand, children over five years were classified by BMI Z-score into four subgroups: underweight Z-score < -1, normal-weight Z-score ([-1]-1), overweight Z-score > 1 to ≤ 2 and obese Z-score > 2, according to World Health Organization (WHO) recommendations 30.
Auxological parameters were measured by two trained nutritionists. Tools used were: Seca(r) weighing-scales (761 Class IIII, accuracy 0.5 kg), a Harpenden stadiometer (Holtain Ltd., Crymych, Dyfed, UK), which accurately determines height within 0.1 cm, and 13 accelerometers (Actigraph(tm) GT1M and ActiLife program).
SAMPLE SIZE
Sample size was calculated to estimate the mean of our main variable, counts per minute (cpm). Since the analysis was carried out in volunteers, sample size was calculated a posteriori. As the sample was selected from the total study population (n = 391) with an expected SD of 170 cpm 31, an accuracy in the determination of the population mean of 23.07 cpm was obtained.
STATISTICAL ANALYSIS
The descriptive analysis was performed through absolute and relative frequencies for qualitative variables, while the mean and SD were used for quantitative variables. The relationship between the main variable and secondary variables was calculated using the t-test, ANOVA and the Pearson correlation coefficient. A linear regression model was constructed with the dependent variable of physical activity (in cpm) and the independent variables of weight status, age and gender, considering possible interactions between them. Non-significant interactions were eliminated from the model. The goodness-of-fit of the model was obtained through ANOVA. The model was used to obtain the SD from all the possible combinations of values (for example, children with childhood obesity). With each of the SD, normal percentiles were computed (x ± SD and x ± 2·SD). For each relevant parameter its associated confidence interval (CI) was calculated. The type I error was set at 5%. IBM SPSS Statistics 24 software was used.
In the ANOVA and normal distribution test and the determination of percentiles of normality for daily physical activity, the BMI groups of risk of overweight and overweight were unified due to the sample size of risk of overweight children.
ETHICAL ISSUES
The study protocol was approved by the Ethics Committee of the University of Alicante prior to initiation (18 March, 2014). The researchers informed the parents about the study, the ethical principles and confidentiality, and written consent was provided by the parents of the participants.
RESULTS
We offered the entire population in this age range (391 children) the opportunity to participate, but 252 of them refused (through their parents) and two children met the exclusion criteria. Thus, the final sample included 136 children (35% of the children in this age range in the municipality).
Table I shows the weight status distribution of the sample of children studied: 25 underweight children (18.4%), 54 with normal weight (39.7%), 12 with risk of overweight (8.8%), 22 overweight (16.2%) and 23 obese (16.8%). Consequently, almost half the sample had excess weight and one in four preschool children was obese. The median age of the participants was 5.7 years (IQ 2.5) and the range of age was 2.4 to 7.3 years. Table I also shows their physical activity as recorded by accelerometer. In the entire sample, the mean was 592 cpm, with a SD of 125 cpm. Concerning gender, weight status group and age, the boys undertook more physical activity, underweight and normal-weight children undertook more physical activity in comparison with the overweight and obese groups, and there were no significant differences by age.
Table I. Descriptive and inferential analysis of physical activity in children aged two to seven years

Cpm: counts per minute; n (%): absolute frequency (relative frequency); N/A: not applicable; r: Pearson correlation coefficient; x ± SD: mean ± standard deviation. *This category of weight status includes only children under five years.
In the multivariate analysis (Table II), the integration of gender and weight status showed significant differences. Specifically, boys had a lower weight status than girls. From the normal distribution analysis, the mean plus two levels of SD for gender and weight status were obtained (Table III). When the number of cpm measured in a child exceeded two SD, above or below, the physical activity level was considered as abnormal. Figure 1 illustrates this distribution. In boys, physical activity decreased as weight status increased. In contrast, the girls in the extreme weight status groups (underweight and obese) undertook greater amounts of physical activity.
Table II. Multivariate analysis of physical activity in children aged two to seven years

B: regression coefficient; CI, confidence interval. *: defined as: 1, underweight; 2, normal weight; 3 and 4, risk of overweight and overweight; and 5, obese. Goodness-of-fit of the model (ANOVA test): F = 6.35, p < 0.001.
Table III. Normal distribution of physical activity (in counts per minute) in children aged two to seven years, considering weight status and gender
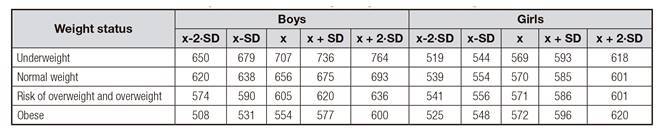
X: mean; SD: standard deviation.

Figure 1. Percentiles for normality for daily physical activity (counts per minute) according to the weight of the child. Thick lines denote mean ± 2 · SD, and continuous lines denote mean ± SD. *The overweight group includes children in risk of overweight and overweight, depending of their range of age.
DISCUSSION
A significant association was found between a higher level of physical activity and a healthier weight status and gender. The multivariate regression model produced curves of normal physical activity values for both genders and considering weight status.
The relationship between physical activity and weight status has been shown in school-age youth 32 and preschool children 9. However, it is difficult to compare physical activity between studies due to the considerable variation of prevalence estimates used to quantify this physical activity 22. A review concluded that a valid day may include at least ten hours per day, eliminating inactive hours in which children were asleep and aquatic activities 23.
In our case, we measured 120 consecutive hours distributed over workdays and weekend days, eliminating an average of ten hours of total inactivity (sleep). The mean physical activity in our sample was approximately 1,000 cpm. This value situates our sample in the light activity category, according to recent studies 19,33,34, and confirms that young children are not achieving an adequate amount of physical activity 27. However, we believe that uninterrupted physical activity measurements afford children and their families more freedom of activity, trying to measure a more accurate physical activity. When only a short period in which children are doing physical exercise is measured, these children could be forced to do more physical activity than they normally would during a day, resulting in a biased measurement. Furthermore, most authors have focused their studies on quantifying the number of minutes that preschool children spend in moderate-to-vigorous physical activity, following public health recommendations 15,16,19,21,26,35. However, a recent review concludes that the decision to select from among various cut points significantly influences the optimal levels of moderate-to-vigorous physical activity for obesity prevention in children 36. Moreover, none of the studies reviewed considered the weight status of preschool children to determine their physical activity levels or to provide physical activity level recommendations to prevent childhood obesity.
We measured total physical activity, which provides more accurate values for physical activity levels in preschool-age children during their normal daily life. Reference values are given by gender and weight status, which provide clinicians with standardized physical activity level values with which to compare their patients. Since we considered total daily physical activity, these values could be a reference, adaptable to the special needs of each group of children depending on their characteristics. According to sex, boys were more active than girls 27 and overweight and obesity groups presented a lower amount of physical activity, especially in the boys. For this reason, activities requiring more effort in these children should be promoted during both school 37 and family time 38. This is of great importance given the epidemiologic problem in countries such as Spain, where the prevalence and incidence of obesity have constituted an alarming situation in the population in this age range during the last decades 39.
The most significant contribution of the study is the reference values obtained according to gender and weight status, which provide clinicians with the standardized daily physical activity levels of preschool-age children. Since we considered the total daily physical activity, these values could be used as a reference and adapted to the special necessities of each child depending on their weight status. In future studies, the use of accelerometers throughout the entire day is recommended to quantify physical activity and to choose an appropriate physical exercise intervention to improve weight status in preschool-age children 7,27,40.
The strength of this study is the evidence shown about the association between the level of daily physical activity in Spanish preschool children, weight status and gender. By monitoring the children 24 hours per day and measuring workdays and weekend days we could obtain a more accurate determination of total physical activity in preschool children. This is of great importance given the need to study the population in this age range and the need for reliable data to quantify the true level of physical activity.
The main limitation of this study is that it was carried out in a small population. Therefore, it is necessary to replicate the study in other communities before the results can be extrapolated to the general population in this age range.

