


 Servicios personalizados
 Inglés (pdf)
 Articulo en XML
 Referencias del artículo
 Enviar articulo por email
 Citado por SciELO
  Citado por Google
  Similares en
SciELO
Similares en
SciELO  Similares en Google
 Permalink
INTRODUCTION
Decreased food intake is a symptom frequently observed in patients with cancer 1. This may be due to a series of metabolic changes originated by or as a consequence of the tumor 2,3,4,5,6, which induces inflammatory response and changes in hypothalamic function directly affecting appetite 7, thus modifying food intake. In addition, antitumor treatment with chemotherapy and/or radiotherapy can induce a series of side effects, further decreasing food intake 1.
In patients with esophageal or esophagogastric junction (OGJ) cancers, food intake impairment is often caused by dysphagia, which is the main symptom related to tumor location 8. Dysphagia is also related to a number of factors such as tumor resection and addition of chemoradiotherapy treatment 9. All these changes can cause relevant weight loss, leading to malnutrition and cancer cachexia as well 6, which may be quite remarkable when tumors affect the gastrointestinal tract (GIT) 10,11.
Between 48% and 80% of patients with GIT cancer report weight loss at the time of diagnosis 11. Unintentional loss of 10% or more independently of time has been considered as an indicator of malnutrition 12.
In addition, malnourished patients presented high risk to develop postoperative complications such as increased infection rate 13 and longer hospital staying, with higher morbidity and mortality 14,15. Earlier detection of the risk of malnutrition, as well as of the main symptoms that may interfere with food intake, allows nutritional interventions to be performed 1 to avoid such complications and to reduce cachexia effects.
Inflammatory markers such as C-reactive protein (CRP) are used to quantify systemic inflammation 1,16,17. Similarly, some scores based on systemic inflammation may be useful in identifying those patients who are at risk for developing cachexia as well as to be used as prognostic and predictive factors of treatment response 2, such as the modified Glasgow Prognostic Score (mGPS) 18 and the neutrophil/lymphocyte ratio (NLR) 2.
There is currently no consensus on the best method for assessing nutritional status in cancer patients 19. Thus, distinct parameters such as anthropometric measurements of weight, percentage of weight loss, body mass index (BMI), laboratory assessment methods such as serum albumin 1, along with tools such as nutrition risk screening (NRS-2002) 20, subjective global assessment (SGA) 21 and patient generated subjective global assessment (PG-SGA) 22 have been often used for this purpose.
Anorexia, defined as loss of appetite 7, can be assessed by numerous specific tools, such as the Functional Assessment of Anorexia/Cachexia Therapy-European Society for Clinical and Metabolism score (FAACT-ESPEN score) or the use of visual analogue scales (VAS) 23.
The VAS is a tool used to translate a subjective sensation into an objective quantitative measure. The VAS for appetite is a 100-mm line in which ends are anchored to "hunger" and "no hunger" 23 or by the phrases "I have no appetite at all" and "my appetite has been very good" 7. These tools are presented to patients who should self-assess their appetite.
The severity of dysphagia is commonly measured in degrees and the scale developed by Atkinson's et al. is the most widely used in patients with esophageal tumors. This scale is divided into five levels based on the possibility of swallowing different textures of food ranging from ability to eat normal foods to complete inability to swallow 24. The internationally well-known guidelines of the National Comprehensive Cancer Network 25 for esophageal and OGJ also recommends to evaluate dysphagia by a methodology similar to that of Atkinson's et al.
Changes in dietary intake, loss of appetite and dysphagia compromise the nutritional status of cancer patients 1. Although these symptoms are relevant to the magnitude of problems affecting GIT cancer, they have been isolated or indirectly assessed when comprising quality of life questionnaires, risk assessment tools or nutritional status.
To our knowledge, there are no other tools that have been particularly developed to assess "food capacity" (eat-ability) as a whole in cancer patients. In addition, many tools used abroad that evaluate appetite or anorexia have not been validated for the Brazilian population and therefore, it may not be possible to compare efficiency and effectiveness of in-country use of these tools.
A more comprehensive way of determining an individual's "eat-ability", i. e., the ability to eat in the broadest sense, remains to be established, considering that ingesting, swallowing and having appetite, if assessed altogether, may provide a tool for determining "food capacity" or "food performance". Therefore, by developing an instrument that allows assessment of "food capacity" particularly weighing each ability itself in patients with cancer of the GIT would be of help as an ancillary parameter in the assessment of the nutritional status, being at the same time, simple, costless and reliable to minor changes as well as feasible to be used by any trained healthcare professional.
MATERIAL AND METHODS
This was a cross-sectional, prospective, nested study to a broader research project aiming to determine different methods of nutritional assessment in outpatients with tumors of the upper gastrointestinal tract, approved by the Ethics Committee of the Hospital de Clínicas de Porto Alegre (HCPA) University Attached Hospital, Southern Brazil (IRB #13-0520), according to the criteria set by the Declaration of Helsinki. This study is based on a convenience sample selected in a consecutive manner and is part of the research line of the Southern Surgical Oncology Research Group (SSORG).
In this study, 41 patients (21 males, 20 females), over 40 years, with a mean age of 59 years, with malignant neoplasms of the upper (esophagus, stomach, pancreas, gallbladder and liver) or lower GIT (colon, rectum), treated at the Department of Surgery, HCPA University Attached Hospital, from October 2013 to June 2016, who consented in writing to participate in the study were included.
Patients with comorbidities such as severe renal failure, liver dysfunction and active infection were excluded. Demographics, clinical and laboratory data were retrieved from electronic patient records at the first outpatient appointment. Serum albumin, C-reactive protein (CRP) and whole blood counts for neutrophil/lymphocyte ratio (NLR) analysis were considered out of normal range when values were lower than < 3.5 g/dl, > 10 mg/l and ≥ 5, respectively.
Anthropometric data, including current weight (kg) and height (m), percentage of unintentional weight loss (%WL) and body mass index (BMI; kg/m²) were also noted. Weight and height were checked using a previously calibrated platform-type Welmy(r) digital scale and measuring ruler. Adult and elderly tables proposed by the World Health Organization (WHO) 26 and Lipschitz 27 were used to classify BMI, respectively.
Adults (from 40 up to 60 years) with BMI ≥ 25 kg/m² and elder patients with BMI > 27 kg/m² were considered as overweight. Adult patients with BMI < 18.5 kg/m² and elder ones with BMI < 22 kg/m² were classified as malnourished. Usual weight (UW) as reported was used to determine the %WL in relation to the current weight (CW) and determined at one, three and six months according to Blackburn et al. 28.
A validated Portuguese version of the Ottery's PG-SGA (1996) was used to determine nutritional status specifically for oncology patients 22. PG-SGA results were classified as A (well nourished), B (moderately malnourished) and C levels (severely malnourished).
Cancer diagnosis, staging and neoadjuvant therapies such as chemo- or radiotherapy when applied were also obtained from patient electronic charts. The classification of the American Joint Committee on Cancer (AJCC) was used to evaluate clinical staging 29.
The evaluation of appetite, food intake and dysphagia was performed separately; later, in an attempt to better determine the role of appetite, ability to ingest and swallow food as a broader food parameter, these abilities were evaluated altogether, generating a weighed scale which was called score of "eat-ability" (SEA).
To assess appetite changes, a visual analogue scale (VAS), adapted from the pain VAS 30 and composed of faces and colors on backward positions to pain VAS, was used. In this scale, 0 to 2 scores were considered as appetite loss; 3 to 7, as moderate appetite; and from 8 to 10 points, as normal appetite.
To determine food intake, a questionnaire-based tool of the Nutrition Day Worldwide 31, consisting of illustrative pictures ranging empty plates and glasses through full plates and glasses, where the patient points out which range better refers to current intake (i. e., 100% for full intake, 75% or more than half, half or up to 50%, 25% or less than half and 0% for nil), was used. Ingestion less than 60% was considered as impaired or poor; between 60% and 75%, as moderate intake; and more than 75%, as normal intake.
The severity of dysphagia was classified according to the recommendations by the National Comprehensive Cancer Network 25 as being grade 0 for no swallowing problems, grade 1 for swallowing of small pieces of solid foods, grade 2 and 3 for swallowing semisolid foods or liquid foods only, respectively, and grade 4for patients unable to swallow.
For food intake, appetite and dysphagia, 0, 1 or 2 points were given according to the severity of the symptoms presented. Zero was assumed to be regular appetite, regular food intake and grade 0or 1 dysphagia; similarly, 1 point was assumed to be moderate appetite, moderate food intake and grade 2 dysphagia; and score 2was used for inappetence, poor or impaired food intake and grade 3 or 4 dysphagia.
The sum of those assigned points was used then to define the levels of eat-ability (0 to 2) as the SEA, in order to define the need for specific nutritional and therapeutic intervention. SEA 0 was considered for full eat-ability, indicating no nutritional intervention required at the time of assessment, but re-assessment on a regular basis during treatment. SEA 1 was considered as moderate or impaired eat-ability, indicating a need of nutritional intervention, while SEA ≥ 2 was considered to be critical eat-ability, indicating that both, specific nutritional and therapeutic approaches are needed.
Deaths were noted from patient records or by telephone contact to family members.
Statistical analyses included Chi-squared and Pearson's tests, with continuity or Fisher's exact correction by Monte Carlo simulation for categorical variables, while the adjusted residue test was applied to test remaining correlations. For quantitative assessment, the Shapiro-Wilk test was used to verify data symmetry. In the case of normal distribution, Student's t test for independent variables or analysis of variance (ANOVA) corrected by Tukey test were used. In case of asymmetry, Mann-Whitney and Kruskal-Wallis tests were applied, respectively.
SEA cut-off level (up to 1 or more than 2) was determined by the receiver operating characteristic (ROC) curve to get discriminatory power to the PG-SGA (B and C nutritional status, respectively). Statistical Package Social Sciences for Windows version 21.0 was used to analyze data, considering a significance level of 5% (p ≤ 0.05).
RESULTS
Of the 41 patients included, 30 (73%) had upper and eleven (27%) had lower GIT tumors. Among the most prevalent tumors, in 15 (37%) cases the primary tumor was located in the esophagus, eleven (27%) in the stomach and in the colon in eight (19%) cases. Most of the patients presented at advanced stages of disease, with 18 (64%) classified as stage IV and seven (25%), as stage IIIa or IIIb. The results of these analyses are described in Table I.
Table I. Characteristics of the sample

n (%): values are presented in number and percentage, unless otherwise shown. *Statistically significant association by the test of residuals adjusted to 5% of significance. †Described by median (25-75 percentiles). Staging was classified according to the American Joint Committee on Cancer (AJCC, 7th ed. 2010).
According to the nutritional status (Table II), three fourths of the patients had some degree of malnutrition, 12 (29%) were moderately malnourished (PG-SGA B) with almost half of them (46%) severely malnourished (PG-SGA C), while BMI showed only 13 (32%) malnourished patients. Similarly, only six (17%) patients had decreased serum albumin levels. Increased weight loss at three and six months prior to the outpatient assessment was observed. However, detailed analyses of weight loss at one, three and six months were not significant (NS).
Regarding inflammatory markers (CRP and NLR), patients with increased CRP levels approximately duplicated the number of patients with altered NLR (74% vs 39%). This analysis is presented in Table II.
Table II. Anthropometric data and inflammatory markers

n (%): values are presented in number (n) and percentage (%), unless otherwise shown. BMI: body mass index; PG-SGA: Patient Generated Subjective Global Assessment; NLR: neutrophil/lymphocyte ratio; CRP: C-reactive protein.
By stratifying upper and lower GIT tumors, statistical significance values were found for BMI (Table II), indicating that patients with upper GIT tumors had decreased mean BMI values when compared to patients with lower GIT tumors (p = 0.001). Malnutrition was more prevalent in patients with malignant neoplasms of upper GIT (n = 12; 40%), while most patients with lower GIT malignancies were overweight (p = 0.003). When evaluated by PG-SGA, 57% of patients with upper GIT tumors were considered as severely malnourished (category C), while only 18% of patients with lower GIT tumors did (NS).
Isolate assessment of dysphagia, appetite or food intake failed to demonstrate eat-ability changes between groups (NS). However, when ranked and analyzed altogether by the SEA, a statistically significant change in food capacity was demonstrated when comparing upper and lower GIT tumors (p = 0.05). This analysis is shown in Table III.
Table III. Data on food capacity and the score of "eat-ability"

n (%): values are presented in number and percentage, unless otherwise shown. *Median (25-75 percentiles).
SEA cut-off points of up to 1 or 2 or more, i. e., moderate and critical food capacity, respectively, were analyzed by the ROC curve to get discriminatory power regarding PG-SGA moderate (B) and severe (C) malnutrition, both, sensitivity and specificity by SEA reached 80% with a 95% CI of 0.48-0.95 and 0.63-0.91, respectively, and an AUC estimated at 0.79 (95% CI: 0.64-0.95; p = 0.006). This analysis is depicted in Figure 1.

Figure 1. SEA cut-off points (1 and ≥ 2) determined by the ROC curve in relation to ASG-PPP (B and C). The sensitivity by SEA was 80% (95% CI: 0.48-0.95). Specificity was 80% (95% CI: 0.63-0.91), with an area under the ROC curve (AUC) of 0.79 (95% CI: 0.64-0.95, p = 0.006).
Patients with a SEA 2 or higher presented a significantly greater weight loss at three (p = 0.001) and six (p < 0.001) months as compared to patients with SEA 0 or 1. Also, all or lower GIT patients with full (SEA 0) and moderate (SEA 1) food capacity had a higher prevalence of overweight, as opposed to those with critical food capacity by the BMI (Table IV).
Table IV. Association of anthropometric data and inflammatory markers by SEA

n (%): values are presented in number and percentage, unless otherwise shown. BMI: body mass index; PG-SGA: Patient Generated Subjective Global Assessment; NLR: neutrophil/lymphocyte ratio; CRP: C-reactive protein. *Statistically significant association by the test of the residuals adjusted to 5% of significance. †,‡Equal figures do not differ by the Tukey test at 5% significance.
Some SEA 0 patients (54.5%) showed moderate malnutrition (PG-SGA B), while those with SEA 1 and SEA > 2 were either well nourished (PG-SGA A) or severely malnourished (PG-SGA C), respectively.
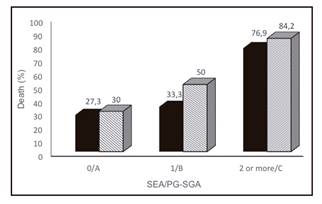
The incidence of deaths was significantly higher in severely malnourished (PG-SGA C) patients and in SEA ≥ 2 (both p = 0.01) as well, as shown in Figure 2.
DISCUSSION
Different parameters have been used to evaluate nutritional status in cancer patients 10. The Consensus of the North American Society of Surgeons and the European Society for Clinical Nutrition and Metabolism suggested serum albumin for assessing nutritional risk in the preoperative period 14,32. However, proper determination of such measure is often difficult because non-nutritional factors involved, such as inflammation 33 and hydration 10, prevent its use as a marker of risk and nutritional status.
Similarly, considering BMI as the only standard pattern to define nutritional status seems unsuitable, since BMI does not take body composition into account, expressing body weight that may lead to misdiagnosing malnutrition 19.
Several tools can be used for risk assessment and nutritional status in clinical practice 19. Although there is no agreement yet 19), PG-SGA, SGA and Minimal Nutrition Assessment (MNA) are the tools frequently used for nutritional assessment of oncological patients 14.
In our study, there was an overall disagreement among nutritional assessment by PG-SGA, BMI or by serum albumin. These findings further support the fact that either BMI or serum albumin alone did not prove to be consistent methods for this purpose 19, since PG-SGA allowed the identification of malnutrition in 76% of the cases, less than a third of the patients were malnourished by BMI and a little more than one-sixth, by serum albumin.
Likewise, BMI, although significantly reduced in patients with upper GIT tumors and less decreased in those with lower GIT tumors, failed to categorically identify malnutrition, as BMI did not distinguish patients with critical food capacity. On the other hand, by PG-SGA, more than three fourths of malignant neoplasms of the upper GIT cases presented malnutrition and more than half of those with lower GIT cancer had the same diagnosis.
The results for dysphagia by the Atkinson's scale, in a cohort of 110 cases of esophageal cancer, showed 40% of patients presented grade 0 and 1 and 60% presented grades 2 to 4 24. Similar results were obtained by SEA, as 47% of patients with upper GIT cancer had grade 0 and 1 of dysphagia and 53%, grades 2 to 4. Besides esophagus tumors, other upper GIT tumors, such as those of the liver, pancreas, gallbladder and stomach were included in the SEA and, since dysphagia is uncommon in these tumors 8), SEA results for dysphagia to upper GIT tumors in general proved to be reliable.
Similarly, regarding appetite and food intake, when evaluated independently, no discriminatory power was found between upper and lower tumors. However, it can be observed that 63% vs 60% of patients with upper GIT tumors showed alterations, respectively, while these figures were 45% vs 36% for lower GIT tumors.
The SEA appetite scale showed appetite loss in 23% of patients with upper GIT cancer, same as it was found in a study that applied the appetite VAS as one of the tools used to compare instruments in the assessment of inpatients anorexia 23. In this study, 23% of the patients were diagnosed with anorexia by the appetite VAS, against only 10% of the cases by the FAACT-ESPEN score 23.
Up to date, there is still no tool that can be considered as a "gold standard" for diagnosing anorexia in cancer patients 7. Moreover, some studies indicated that VAS for appetite in clinical practice better suits the need to track changes over time rather than diagnosing anorexia on a specific day 23. However, in developing countries, the VAS for determining appetite turns into a simpler, more practical, quicker and easier tool to be perceived by the patient when compared to questionnaires with multiple domains, often difficult to understand.
In the SEA, determining the evaluation of intake by a combined VAS on the percentage of estimated solids and liquids taken also allowed greater intake perception by patients as a whole. One of the criteria to indicate enteral nutritional therapy in cancer patients is food intake under 60% of their nutritional needs for more than one to two weeks 1. This would be the case in 47% and 36% of patients with upper and lower GIT tumors, respectively, by using the SEA, resulting in a quick and simple way that provides health professionals with a reliable assessment on patient daily food compliance and clearly avoiding misinterpretation.
When these parameters (dysphagia, appetite and food intake) were evaluated altogether, it became easier to consider that dysphagia is directly involved with intake and secondary and indirectly, with appetite, just as appetite loss is directly implicated with less food intake. SEA allowed better judgment on "eat-ability" (food capacity) among upper and lower GIT patients, who are possibly at increased risk of malnutrition.
Malnutrition might be detected in up to 87% of patients with GIT cancer, depending on tumor site and stage 11. In SEA, critical food capacity (SEA ≥ 2) was associated to 92% of malnourishment cases, being also reliably associated with weight loss at three and six months previously, when compared to full and moderate food capacity (SEA 0 or 1), respectively.
Blackburn et al. considered as severe unintentional weight loss greater than 5%, 7.5% and 10% at one, three and six months, respectively 28, as unintentional weight loss > 10% has been considered to be an indicator of nutritional risk 12. In our study, SEA ≥ 2 was consistent with weight loss greater than 10% at three and six months, showing the role of SEA as a predictor of weight loss and high nutritional risk.
Some discrepancy between full and moderate "eat-ability" in moderately undernourished and well-nourished patients, respectively, was due to a type II sampling error, since there were no cases in three subgroups of those categories. Although all cases classified as critical "eat-ability" were severely malnourished, a greater sample is still needed to validate this combined SEA. Despite this, there was a greatly "eat-ability" impairment among patients who died, who were greatly malnourished. Nevertheless, the role of "eat-ability" and malnutrition on death risk requires further studies on a large sample, since most patients were in advanced stages of the disease (stages III and IV).
Another deterrent factor in the study is that most of the patients died after hospital discharge, making it difficult to establish if death was directly related to the tumor or to the comorbidities.
Perspectives point out to increase cases evaluated by SEA and to compare it with inflammatory parameters, most probably with c-reactive protein (CRP), since SEA and CRP were similarly increased and CRP was twice NLR positive, and to better determine the role of SEA as a nutritional risk ancillary.
In conclusion, the combined evaluation of food intake, dysphagia and appetite (SEA) was reliable in clearly identifying patients with impaired "eat-ability" in more than half and in more than three fourths of those with lower and upper GIT tumors, respectively, that significantly affect nutritional status and risk of death of patients with GIT tumors.

