


 Servicios personalizados
 Inglés (pdf)
 Articulo en XML
 Referencias del artículo
 Enviar articulo por email
 Citado por SciELO
  Citado por Google
  Similares en
SciELO
Similares en
SciELO  Similares en Google
 Permalink
INTRODUCTION
Of the 56 million deaths worldwide in 2012, 38 million were caused by noncommunicable diseases (NCDs), particularly cardiovascular disease (17.5 million, 46.2% of all NCD deaths) 1. High blood pressure is the largest risk factor for NCDs; between 13-16% of all deaths are attributed to this 2,3. According to the World Health Organization (WHO), high blood pressure is responsible for at least 45% of deaths due to heart disease and 51% of deaths due to stroke 4. The worldwide prevalence of high blood pressure (arterial systolic and/or diastolic blood pressure ≥ 140/90 mmHg) in adults (aged 18 or over) is estimated at 22% in 2014 1. The prevalence of high blood pressure in adults in Spain was estimated at 33% in 2010, although this figure reaches almost 70% in people aged over 65 5.
One element of the diet that is associated with the risk of high blood pressure and cardiovascular disease is excess salt intake. The quantity of salt ingested in the diet is a highly significant determinant of blood pressure levels and cardiovascular risk 6,7,8,9,10,11. Excess salt intake is estimated to have been responsible for 1.7 million deaths due to cardiovascular disease 12. Excess salt intake has also been linked to other NCDs, such as stomach cancer 13; research has even been done into a possible link as a determinant of obesity 14. The WHO recommends a maximum daily salt intake of 5 g 15. The worldwide average daily salt intake in adults is estimated at 9.88 g per person (range: 5.45-13.78), with 99.2% of the world's population having an average daily salt intake that exceeds the WHO recommendations 12. Average daily salt intake in Spain is estimated at 9.8 g (SD: 4.6 g) 16. In other words, salt intake in Spain is very close to the worldwide average, almost twice the level recommended by the WHO.
Over 75% of dietary salt is found in processed foods 17. It is therefore important to address reformulating the salt content of foods in order to enable salt intake to be reduced. One food of particular importance is bread, as shown by the European Commission High Level Group on Nutrition and Physical Activity 18. Bread represents one of the foods that contributes the most salt to the diet, due both to its salt content and to its high consumption frequency. Bread is also consumed very frequently in Spain 19 and, in addition to this, it is an important food due to its inclusion in the Mediterranean diet 20. For this reason, it is considered important to know, and where possible to reduce, the salt content of bread 19. Within this type of bread, the varieties most frequently consumed in Spain are the barra and the baguette, followed by wholemeal bread 21. Various studies and initiatives have demonstrated that it is possible to gradually reduce the salt content of bread without the consumer perceiving this 22,23,24. A collaboration agreement was signed in 2004 between the Spanish Agency for Food Safety and Nutrition (AESAN, now AECOSAN), the Spanish Confederation of Bakers (CEOPAN) and the Spanish Association of Manufacturers of Frozen Dough (ASEMAC), whereby said institutions made a commitment and, in four years, reduced salt content of common bread by 25%, reaching an average amount of 1.63 g/100 g product 25,26. Since 2008, the development of this salt content has not been evaluated. That evaluation in 2008 was done by determining chlorides. Currently, the method of reference is the determination of total sodium, so it was necessary to estimate the salt content in a subsample of pieces of bread by determining chlorides, in order to compare it to the salt content in 2008.
This study aimed to establish the mean salt content of common bread in Spain in 2014 and whether there was any change in salt content in bread in Spain since the reduction achieved in 2008.
METHODS
SAMPLING
It was necessary to collect a sample of loaves of bread representing the common bread available in Spain, which is administratively organized into autonomous communities. A calculation was carried out to determine the sample size necessary to obtain an estimate of the mean salt content in bread (measured in grams salt per 100 grams product), with an error of ± 0.1 g and α of 0.025. The calculation also accounted for a standard deviation of 0.36 for this mean value in a previous study evaluating salt content in bread. The result was a necessary sample size of 50. A design effect of 1.2 was applied, bringing the total samples needed in each Autonomous Community to 60. Therefore, the minimum sample size required was 60 x 19, or 1,140 samples.
In autonomous communities with multiple provinces, one or two provinces were selected by simple random sampling. The provinces of single-province communities and the autonomous cities of Ceuta and Melilla were also selected. In each province selected, sampling was carried out in the capital and at least two other municipalities. In each municipality, where possible, samples were acquired at three types of establishment: bakeries with on-site ovens, bakeries without on-site ovens, and food shops or small and medium grocery stores.
The bread purchased was the bread that is most consumed in Spain, comprising two main varieties: barra or similar and baguette or similar. Loaves of wholemeal bread, the third most consumed variety, were also purchased. The loaves were bought in bakeries with and without on-site workrooms and in supermarkets 27.
Having obtained the samples, these were kept in paper bags labelled with all identifying information on bread type, municipality and place of purchase. Within five days of purchase, the samples were transported to the laboratory, where they were frozen until the time of analysis. All samples were obtained in October and November 2014.
ANALYTICAL METHODS
The NaCl analysis of dried extracts was calculated based on sodium analysis (flame atomic absorption spectrophotometry [AAS]), as per the legislation in force, Regulation (EU) no. 1169/2011 of the European Parliament and of the Council, of 25 October 2011, on the provision of food information to consumers. For the analysis, first humidity was measured and then the calculated content of sodium does not take into account the humidity variation.
As the salt content in the previous 2008 study (800 bread loaves from all Spanish regions) was measured with chloride determination, to compare 2008 data with the current study a random subsample of 20 loaves (barra type) was used for chloride-based NaCl analysis. This subsample was analysed according to method AOAC 971.27, consisting in potentiometric titration with silver nitrate (AgNO3) specific for vegetable matter.
STATISTICAL ANALYSIS
A descriptive study was carried out for the type of bread analysed, the type of dough used and the type of establishment where the samples were obtained. Salt content (g/100 g product) was quantified and described according to the type of bread analysed, the type of dough used and the type of establishment. Student's t-test for independent samples and ANOVA were applied to assess whether there were significant differences in mean salt content according to type of bread, type of dough and type of establishment.
Mean salt content (g/100 g product) based on the 2014 chloride determination was compared to the value found in 2008. The Mann-Whitney U test was carried out to evaluate the statistical significance of the difference.
RESULTS
The analysis was carried out on 1,137 loaves of bread from all the autonomous cities and communities of Spain. Figure 1 shows the distribution of the loaves of bread by Autonomous City or Community.
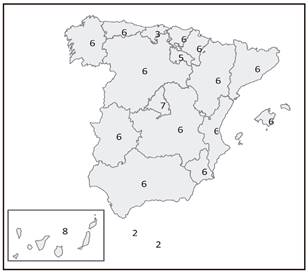
Of the 1,137 samples, 527 (46.3%) were barra-type, 498 (43.8%) were baguette-type, and 112 (9.9%) were wholemeal-type; 82.7% of the loaves were made from fresh dough and 17.3%, from frozen dough. In addition, 43.7% were purchased in bakeries with on-site workrooms, 49.6% in bakeries without on-site workrooms, and 6.7% in supermarkets (Table I).

The mean salt content for the sample as a whole was 2.08 g/100 g. According to bread type, the mean salt content was the same in barra- and baguette-type bread (2.09 g/100 g product) while it was lower in wholemeal bread (1.99 g/100 g) (Table II). This was a statistically significant difference (p = 0.005). The mean salt content in bread made from fresh dough was 2.07 g/100 g, while in bread made from frozen dough it was 2.12 g/100 g. This was a statistically significant difference. Differences in salt content according to type of establishment were not statistically significant. In bakeries with on-site workrooms, mean salt content was 2.07 g/100 g; in bakeries without on-site workrooms it was 2.10 g/100 g; and in supermarkets it was 2.06 g/100 g.
Table II. Salt content of bread in Spain, 2014 (g/100 g product)
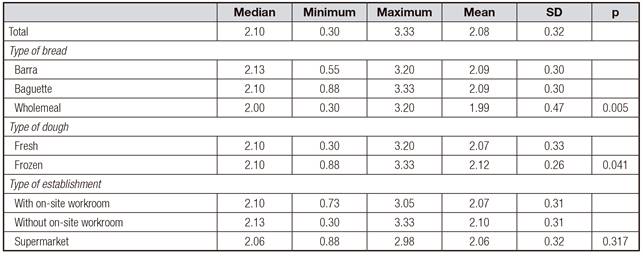
SD: standard deviation. p: p-value of statistical significance.
The mean salt content found through chloride determination in the subsample of 20 loaves from 2014 was 1.64 g/100 g product (SD: 0.42). The 2008 mean salt content was 1.63 g/100 g (SD: 0.37). The difference between these amounts was not statistically significant (p = 0.428). In addition, the mean salt content found through sodium determination in the same subsample of 20 loaves from 2014 was 2.09 g/100 g (SD: 0.22), similar to the salt content found in the whole sample.
DISCUSSION
Given that bread is a highly consumed food (not only in Spain) and that it contains a significant amount of salt, the impact of reformulation on salt is very relevant. The initiative run in Spain between 2004 and 2008 surpassed its proposed objectives 25. With this reduction yielding successful results, it was important to carry out a second evaluation due to the possibility that a "relaxation" may have occurred following the completion of AECOSAN's collaboration agreement with bread manufacturers, causing a rise in salt content.
The study's results include several important findings. Firstly, salt content is quite uniform across the different breads on sale in Spain. Only very slight differences were detected between different types of bread, especially the most popular varieties, barra-type and baguette-type breads. There was, however, a somewhat smaller amount of salt in wholemeal bread, probably due to the special characteristics of this type of bread, making it an even healthier option. A significant difference in salt content was also found between breads made from fresh and from frozen dough; nonetheless, the magnitude of this difference (0.04 g/100 gproduct) is so low that it has no practical repercussions, and the medians in both types of bread are equal. Similarly, and as expected, salt content is similar between breads purchased from different establishments.
Despite the limitations of the analysis of this small sample for comparison with the 2008 data, it seems that since the achievement of salt content reduction of over 20% in 2008, there has been no rise to date, with salt content remaining at the amount achieved following that reduction. The fact that the two studies followed different methodologies owes to a change in the laboratory method of choice since the original study; however, this does not influence the comparison.
Reducing salt content is one of the main aims in improving the quality of nutritional composition of foods. Numerous initiatives by governments, public authorities and other institutions aim to make the foods available increasingly healthy, and the continuous reduction of salt content is an important part of this 24,28,29,30,31,32. Salt reformulation actions have also been carried out in Spain; these have yielded results in several food groups, including industrially produced bread 33.
One of the main issues with reducing salt content in foods is the risk that they may be less accepted by consumers due to changes in flavour. For this reason, manufacturers may express concern and resistance regarding reformulation. However, it has been demonstrated that by making changes gradually in terms of quantity and time, this problem can be bypassed effectively 22,34,35. This study's findings reinforce the fact that a gradual, significant reduction can be made with no adverse effects on the organoleptic properties of the product, and therefore, without increasing the likelihood of consumers potentially rejecting the food.
One limitation of this study is that the data of 2008 are not so complete as those of 2014, and we have not available data of the different types of bread. In addition, the method used in 2008 was chloride determination, which provides quite different estimations of salt content. However, for trend assessment purposes, the use of chlorides is valid. In addition, the small sample size in the subsample in 2014 that was analysed with chloride determination could be a limitation, but as the results of salt content in 2014 were really homogeneous, the sample size would be enough.
The different results found depending on the method used (chlorides or total sodium) must warn us about the consequences in several aspects. For example, the salt content in the nutritional labelling could be quite different depending on the method, and the food composition tables and even the nutritional recommendations of salt intake could be affected as well.
The main conclusion from the study is that the quantity of salt in common bread (not including industrially produced breads) in Spain remains stable following a significant reduction.

