


 Servicios personalizados
 Inglés (pdf)
 Articulo en XML
 Referencias del artículo
 Enviar articulo por email
 Citado por SciELO
  Citado por Google
  Similares en
SciELO
Similares en
SciELO  Similares en Google
 Permalink
INTRODUCTION
Physical fitness is a powerful health condition marker in childhood and adolescence 1,2. Even in children and adolescents physical fitness is inversely related to the physiological risk factors for the emergence of chronic disease, including high blood pressure 3,4, obesity 4, hyperinsulinemia 5, increased abdominal adiposity 6, atherogenic lipid profile, insulin resistance, inflammatory marker 7 and other metabolic risk factors 8,9. However, physical fitness has declined in many countries over the last few decades 10.
Growth stunting is an outcome of linear growth retardation associated with chronic undernutrition during pre-school years. Children who are undernourished in early childhood are shorter, have decreased muscle mass and exhibit lower levels of muscle strength and aerobic endurance compared to their better-nourished peers 11,12. Chronic undernutrition is also linked to a reduction in physical activity during school age 13,14-15. Overweight and obesity are a consequence of the unbalanced ratio between energy intake and expenditure. Obese children usually have a lack of movement skills 16,17 and a lower level of physical fitness than children with normal body weight 18,19,20,21,22-23, whereas the evidence on physical activity in overweight/obese youth is equivocal 20. Data on the functional consequences of undernutrition come from children in developing countries, while data on overweight and obese children come mainly from children in developed countries. The functional consequences of undernutrition are often observed in terms of physical working capacity/oxygen consumption 14,24,25. However, the term functionality has a wider meaning beyond the working abilities of children and can be extended to everyday activities that require movement proficiency, power, strength and endurance.
Nutritional transition, overweight and obesity in childhood have also increased in the Balkan countries, including Macedonia 26. In transitional countries, on the other hand, undernutrition poses a greater problem. This dual burden of under- and over-nutrition may manifest on a societal level, a familial level or an individual level, and presents a complex challenge for the government and the health organizations that are trying to implement a program that is efficiently directed to the opposite ends of the malnutrition spectrum 27.
This study considers the consequences of undernutrition and overweight/obese for the health-related physical fitness of Macedonian children aged 6-14 years. It specifically compares the growth status and physical fitness of normal (non-stunted, non-owt/ob), stunted (non-overweight/obese) and owt/ob (non-stunted) school children.
METHODS
SAMPLE OF RESPONDENTS
The research was performed on a sample of 9,081 children of Macedonian nationality, from 19 primary schools from the central and east part of the Republic, out of which eight are in a rural setting and eleven are in urban environment. The sample has been divided into two sub-samples by gender: 4,608 of the respondents are boys and 4,473 respondents are girls. The average age of the respondents of both genders was 10.02 ± 2.4 years.
Anthropometry and fitness tests were assessed by trained nutritionists and Physical Education teachers in March, April and May 2013. Parents or a legal representative signed an informed consent form after being told about the purpose of the study. The study protocol was performed following the ethical guidelines of the Declaration of Helsinki of 1961 (revision of Edinburgh 2013).
ANTHROPOMETRIC MEASURES AND BODY COMPOSITION
Assessment of the anthropometric measurements was performed according to the recommendations given by the International Biology Program (IBP) 28. For estimation of the morphologic characteristics, the following anthropometric measures have been applied: body height in standing position (cm), body weight (kg), circumference of the upper arm and circumference of the calf (cm), as well as body mass index (BMI).
Components of the body composition have been determined by the method of bioelectrical impedance (measuring of the electric conductivity, bioelectrical impedance analysis [BIA]). The measuring was carried out with a body composition monitor, model OMRON(r) - BF511, by means of which body weight, fat tissue percent and muscular mass percent were measured. Prior to commencing the measurement, the parameters of gender, years and body height of the respondent were entered in the body composition monitor. In order to provide better precision of the results obtained from the estimation of the body composition, prior to each measuring, we ensured that the preconditions recommended by ACSM 29 and Heyward 30 had been fulfilled.
EVALUATION OF PHYSICAL FITNESS
Prior to starting the study, the researchers involved in the project undertook training sessions in order to guarantee the standardization, validation and reliability of the measurements 31. The fitness test battery a set of valid, reliable, feasible and safe field-based fitness tests for the assessment of health-related physical fitness in children and adolescents, to be used in the public health monitoring system in a comparable way within the European Union 32. The systematic error when fitness assessments were performed twice was nearly 0 for all the tests 33.
Sit and reach test. With the subject seated on the floor and using a standardized support, the maximum distance reached with the tip of the fingers by forward flexion of the trunk is measured. The test is indicative of amplitude of movement or flexibility.
Hand grip test. With the use of a digital Takei(r) TKK 5101 dynamometer (range, 1-100 kg), the maximum grip strength was measured for both hands.
Standing broad jump test. The maximum horizontal distance attained, with feet together, was measured. This test evaluates lower limb explosive-strength.
Bent arm hang test. A standardized test was used to measure the maximum time hanging from a fixed bar. This test estimates the upper limb endurance-strength.
Sit-ups 30 sec. Maximum number of sit-ups achieved in 30 seconds. This test measures the endurance of the abdominal muscles.
Shuttle run: 4 x 10 meters. This test provides an integral evaluation of the speed of movement, agility and coordination. The subject does four shuttle runs as fast as possible between two lines ten meters apart. At each end, the subject places or picks up an object (a sponge) beside the line on the floor
Three-minute step test. The aerobic capacity has been estimated by means of a three-minute step test. For three minutes, the respondent had to get up and get down of a bench 30.5 cm high, in four cycles (up, up, down, down), with standardized rhythm of 96 beats in a minute (bmp), which was dictated by the metronome. Before beginning the test, the heart frequency was measured, whereas the children, even in the stand-by state had sub maximal value in terms of the age, were not exposed to burdening. The heart rate was measured by means of the monitor Polar(r) RS800 for registration of the heart frequency. As a result was taken the heart frequency measured one minute after the test (post-exercise pulse rate). The aerobic fitness test used in this study has been validated for use with adolescents 34.
GROWTH AND WEIGHT STATUS
First, all subjects who lacked BMI data, those who were younger than six and those older than 14 years were excluded from the study. Children were classified as stunted (z-score below -2.00) and non-stunted using the age- and sex-specific reference heights of the WHO 2007 definitions 35, and as normal weight, owt/ob using international criteria for BMI 36. Three groups were formed: a) normal-not stunted and not owt/ob; b) stunted-not owt/ob; and c) owt/ob-not stunted.
The socioeconomic status of the students was evaluated with the help of the international Family Affluence Scale (FAS), which includes four questions. This scale was formulated by the WHO Health Behavior and School Aged Children Study, in 1997 37.
STATISTICAL METHODS
The data are presented as frequencies (percentage) for categorical variables and mean (standard deviation [SD]) for continuous variables. The adjustment to normal distribution of the different variables was evaluated both by graphs and by the Kolmogorov-Smirnov test, and log transformations were made when possible. Z-scores were calculated for each fitness test according to gender and age group. This controlled for test-specific differences related to age and gender, thereby allowing for standardized comparisons of physical fitness between the children. Multivariate analysis of covariance, controlling for socioeconomic status, residence status (urban or rural), sex, age and age squared, was used to compare anthropometric characteristics and physical fitness of normal, stunted and owt/ob children. Bonferroni adjustments for multiple comparisons were used. An adjusted significance level of p < 0.05 was accepted. All the analyses were performed using the Statistical Package for Social Sciences software (SPSS, v. 22.0 for Windows; SPSS Inc., Chicago, IL, USA).
RESULTS
Of the whole study population of 6-14 year old children (9,081), 2.0% (178) were stunted, according to the WHO 2007 norms. According to the World Obesity Federation (formerly IOTF) norms, 34.3% (3,116) were overweight or obese. In the full sample, 63.7% (5787) of children were of normal weight and used as the comparison group. The data from the application of the Kolmogorov-Smirnov method pointed out that all applied anthropometric variables and fitness test in all ages and sex were normally distributed, except the test bent arm hang were negative skewed and were thus transformed (natural log). That was possible methodologically correct to perform further data procesing (data not shown).
Mean values and standard deviation for anthropometric characteristics and body composition measurements in normal, stunted and overweight/obese children are shown in Table 1. Table 2 shows the comparison of anthropometric characteristics and body composition of elementary children, classified as normal, stunted and overweight/obese. An overview of Table 4 shows that there are statistically significant differences in all anthropometric measurements and measurements for assessing body composition between the groups of subjects classified as normal, stunted and overweight/obese (p ˂ 0.000). From the values of the estimated means and the level of statistical significance, it can be seen that stunted children of both sexes, in addition to being shorter, have lower body weight, forearm and thigh circumference and muscle mass percentage compared to normal and overweight/obese children. Also, stunted children have a lower BMI compared to overweight/obese children and a higher percentage of fat tissues compared to normal children. Overweight/obese children have higher body height, body weight, forearm and thigh circumference and fat tissue percentage and lower muscle mass percentage as compared with normal children. Between normal and stunted children, no statistically significant differences in BMI have been found.
Table I. Mean values (± SD) for anthropometric characteristics and body composition of elementary children, classified as normal, stunted and overweight/obese

BMI: body mass index; SD: standard deviation.
*Normal, non-stunted and non-overweight/obese.
†Stunted, non-overweight/obese.
‡Overweight/obese, non-stunted.
Table II. Comparison of anthropometric characteristics of elementary children, classified as normal, stunted and overweight/obese, and results of pairwise comparisons (p < 0.05) after significant MANCOVAs*
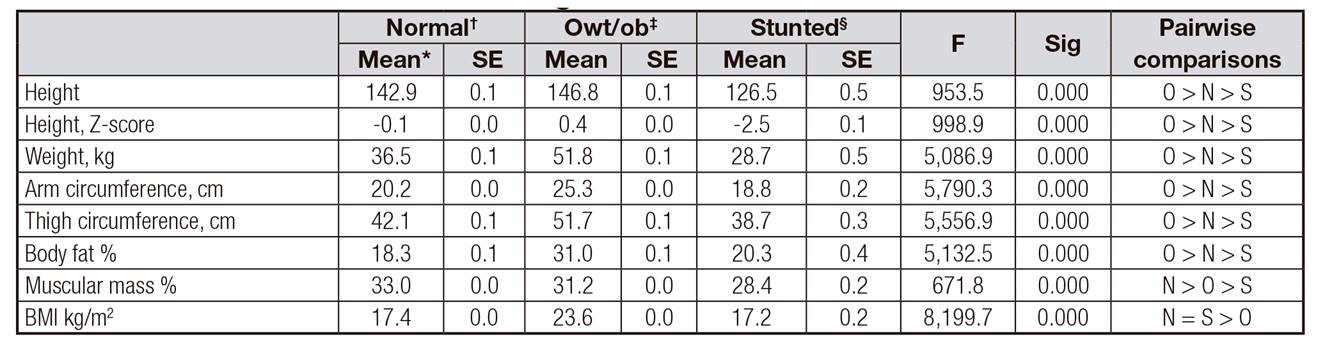
BMI: body mass index; MANCOVA: multivariate analysis of covariance; N: normal; O: overweight/obese; S: stunted; NS: not significant. SE: standard error.
*Adjusted mean (controlling for residence status, socioeconomic status, age and sex).
†Normal, non-stunted and non-overweight/obese.
‡Stunted, non-overweight/obese.
§Overweight/obese, non-stunted.
Mean values and standard deviation of physical fitness tests measurements in normal, stunted and overweight/obese children are shown in Table 3. Table 4 displays the comparison of physical fitness tests of elementary children, classified as normal, stunted and overweight/obese.
Table III. Mean values (± SD) of the physical fitness tests of elementary school children, classified as normal, stunted and overweight/obese

SD: standard deviation.
†Normal, non-stunted and non-overweight/obese.
‡Stunted, non-overweight/obese.
§Overweight/obese, non-stunted.
Table IV. Comparison of the physical fitness of elementary school children, classified as normal, stunted and overweight/obese, results of MANCOVAs and significant pairwise comparisons (p < 0.05)

MANCOVA: multivariate analysis of covariance; N: normal; O: overweight/obese; S: stunted; NS: not significant. SE: standard error.
*Adjusted mean (controlling for residence status, socioeconomic status, age and sex).
†Normal, non-stunted and non-overweight/obese.
‡Stunted, non-overweight/obese.
§Overweight/obese, non-stunted.
An overview of Table 4 shows that there are statistically significant differences in all tests (except the sit and reach test for assessing flexibility) for assessing fitness between the groups of subjects classified as normal, stunted and overweight/obese (p ˂ 0.000). From the values of the estimated means and the level of statistical significance, it can be seen that children who belong to the normal group achieve better results in the standing long jump, sit-ups, 30 sec, handgrip/weight and shuttle run 4 x 10 m fitness tests compared to stunted and overweight/obese children. Children with normal body weight also perform better in the three-minute step test as compared with overweight/obese children. Overweight/obese children achieve better results in the handgrip fitness test in comparison with normal and stunted children. Overweight/obese children achieve better results in the shuttle run 4 x 10 m fitness test versus stunted children. Stunted children achieve better results in the bent arm hang fitness test in comparison with normal and overweight/obese children. Statistically significant differences between stunted and overweight/obese children have not been found in the sit-ups, 30 sec, and standing long jump fitness tests.
DISCUSSION
The results of our study suggest that Macedonian children and adolescents who have normal body weight achieve better results in most tests for assessing health-related fitness compared to children and adolescents who are classified as stunted and overweight/obese. The results are in line with previous studies carried out in children and adolescents that indicate a non-linear relationship between BMI and health-related fitness 22,38.
The results of these studies indicate that overweight can affect health-related fitness, with overweight or obese children achieving poorer results in health-related fitness tests, especially when they need to move their bodies through space 39,40,41,42,43,44,45-46. Walking and running while maintaining the same speed require greater absolute energy expenditure in overweight children as compared with children who have normal body weight 47. It is therefore normal to expect that overweight children are at a disadvantage compared to children with normal body weight when the task requires them to move their bodies through space or to overcome the resistance of their own bodies offsetting gravity, as is the case in the standing long jump, shuttle run, bent arm hang, timed sit-up and three-minute step tests. The results of this study are in line with several international studies conducted on children aged five to 17 39,40-41,43,44,45-46,48. However, schoolchildren that have a moderately increased or high BMI can achieve equally good or better results in those fitness tests where they do not need to move their bodies through space or to overcome the resistance of their own bodies, such as the hand grip test or sit and reach tests.
The relationship between undernutrition and health-related fitness has been researched less. The research results indicate that children who were classified as stunted achieve worse results in most fitness tests compared to children with normal body weight. Prista et al. 41 showed that undernourished children were disadvantaged in tests of strength. The reason may lie in the lower muscle mass percentage that these children have, which this research confirms. Monyeki et al. 49 found that activities that require rapid release of energy in the shortest possible time, such as the standing long jump, sit-ups, 30 sec, or shuttle run 4 x 10 tests, were negatively affected by muscle wasting in a group of undernourished South African children. Undernourishment and nutritional deprivation during growth in children can cause structural, metabolic and functional changes to the skeletal muscles that manifest as a reduction in the number and size of fast-twitch muscle fibres, yet slow-twitch fibres are spared 50,51,52-53. The different types of muscle fibres affect physical performance, and these changes result in a decreased ability to successfully perform the exercise tasks in a relatively short time, as indicated in the stunted subject group in our study. Results from previous studies are mixed, with some 41,54, but not others 44,55, showing poorer performance in the standing long jump for undernourished children as compared with children with normal weight. Two studies have shown no difference in sit-up performance between undernourished children and children with normal weight, while one 41 showed a poorer performance among undernourished children.
No differences in flexibility were found between undernourished children, children with normal body weight and overweight/obese children. The results are in line with a number of international studies that have found flexibility is not affected by body weight 40,43,45,48,54,56.
Undernourished children and children with normal body weight do not differ in cardiorespiratory fitness assessed by the three-minute step test (post-exercise pulse rate). This is contrary to the results obtained from Colombian children, where undernourished children were characterized by a lower level of aerobic fitness compared to children with normal body weight 24,57. The differences in the results from these two studies can be explained by the different protocols implemented to assess aerobic fitness. On the other hand, undernourished children and children with normal weight achieve better results in the three-minute step test versus overweight/obese children, which is in line with a number of previous studies 21,22.
The advantage of this research lies in the large sample size and diversity of children that were drawn from different socioeconomic groups and several regions in Macedonia. The research did not collect information on diet and nutrition, which could have brought additional information and interpretations of the results.
Our results confirmed the original hypothesis that both undernutrition and over-nutrition have a primarily negative influence on the health fitness of Macedonian children and adolescents. Although discussions about the functional consequences of nutritional status often focus on the implications of working abilities and economic productivity, it is important to realize that school-age children are not miniature adults. They are children with their own needs, so that the notion of functional efficiency or consequence must be extended to measurements that are more related to their everyday activities (school, play and other culturally-specific demands). Motor performance such as jumping, running, muscle strength and endurance is of essential importance for children's physical activity, be they in school, at play or sport, or doing household chores.

