


 Custom services
 English (pdf)
 Article in xml format
 Article references
 Send this article by e-mail
 Cited by SciELO
  Cited by Google
  Similars in
SciELO
Similars in
SciELO  Similars in Google
 Permalink
INTRODUCTION
Alzheimer's disease (AD) is the leading cause of dementia and it is characterized by insidious, chronic, and usually progressive onset of cognitive and/or behavioral decline associated with cerebral pathological changes that begin in the entorhinal cortex and parahippocampal region, following involvement of the neocortex 1.
Cognitive impairment in AD is characterized by changes in memory, language, praxis, executive functions as well as gradual restrictions in daily activities. It may be associated with nutritional inadequacies, reduced food intake, decreased appetite and perception of taste, which can lead to serious impairment of the individual's health conditions with significant individual and social repercussions 2,3.
Despite the relevance of the subject, there are gaps in the knowledge of the nutritional status in AD and a shortage of data on the moderate and severe stages of the disease. Another relevant aspect that has been poorly studied is the relationship between nutritional variables and cognitive aspects in AD 2,3.
The hypothesis of the study is that progressive changes in the nutritional variables may be associated with greater cognitive impairment and/or severity of dementia.
In view of the increase in the elderly population in Brazil and worldwide as well as the high prevalence and incidence of dementia diseases, the aim of this study was to assess the nutritional status of the elderly with mild, moderate, and severe AD and to associate it with cognitive aspects and disease severity.
METHODS
PARTICIPANTS
This is a cross-sectional, prospective and observational study involving 43 elderlies (65.1% women) above the age of 65 years who were diagnosed with AD according to the criteria of the Diagnostic and Statistical Manual of Mental Disorders 4, the National Institute of Neurological and Communicative Disorders and Stroke and Alzheimer's disease and Related Disorders Association 1 in accordance with the recommendations of the National Consensus criteria for the diagnosis of probable AD 5. The elderlies were attended at the neurology outpatient clinic of a teaching hospital in the state of São Paulo, Brazil. The author LCF was responsible for diagnosing AD.
All participants and/or guardians signed the informed consent, which was prepared according to the Declaration of Helsinki in 2013, after they were informed of the ethical and methodological aspects of the research. The study was approved by the Human Research Ethics Committee of PUC-Campinas.
Exclusion criteria included the presence of other serious diseases that caused life expectancy reduction, inability to respond to the instruments of cognitive assessment, impossibility of perform anthropometric measurements, or cardiac pacemaker implantation.
The normal control group (NC) consisted of 51 individuals (72.5% women) with no history of cognitive decline or prior neurological or psychiatric disorders, matched for age, educational and sociodemographic levels.
STUDY PROTOCOL
Clinical, cognitive, and physical activity assessment
- Neurological and cognitive assessments: an objective interview with the patient and informant, analysis of routine laboratory exams and application of the following cognitive batteries: Mini-Mental State Examination (MMSE) 6,7, category fluency test (animals in one minute) (animal VF) 8, clock-drawing test 9 and simple memory drawing test 8. The Clinical Dementia Rating 10 was applied for staging the severity of dementia.
- International physical activity questionnaire - short form (IPAQ-SF): instrument used to measure physical activity, estimate time spent on different daily activities and quantify sedentary activities. The total score was as follows: sedentarity; irregular physical activity; active; and very active. The IPAQ-SF was adapted and validated in Brazil in 2001 11.
Assessment of nutritional status
- Mini Nutritional Assessment (MNA) 12: questionnaire used to detect malnutrition in the elderly that is composed of: screening and global assessment. Maximum scores during screening is 14; a score lower than or equal to 11 indicates possible "malnutrition" and above 12 indicates "no risk of malnutrition". Individuals with possible "malnutrition" are submitted to the global assessment composed of 12 questions. The global assessment differentiates nutritional status into three classifications: a) no risk of malnutrition: MNA ≥ 24; b) risk of malnutrition: MNA of 17-23.5; and c) malnutrition: MNA < 17 13.
- Anthropometric data: the following measures and indicators were analyzed: height (cm); weight (kg); body mass index (BMI, kg/m2)14,15; waist circumference (WC, cm) 15 16 17 18-19; calf circumference (CC, cm) 14,16; arm circumference (AC, cm) 15 16-17; subscapular skinfold (SSF, mm) 16 17 18 19; triceps skinfold thickness (TST, mm) 16,17,18,19; fat-free mass (FFM, kg) 20; fat-free mass index (FFMI) 20; body fat mass index (BFMI) 20; resistance (Ω) 21; reactance (Xc) 21; and adductor pollicis muscle thickness (APMT, mm) 22. The arm muscle circumference (AMC, cm) 16,18,19 and the circumference of the corrected arm muscle area (AMA, cm2)16,18,23 were calculated using the TST and AC measurements. Reactance, resistance, FFM (kg), FFMI and BFMI were calculated from anthropometric data and bioelectrical impedance analysis (BIA). Measurements were taken on the right side of the body in triplicate, and mean values were used for analysis. A flexible and inextensible measuring tape, digital weighing scale, vertical stadiometer, and body fat meter (Lange adipometer) were used to collect the data. Data was then calculated and classified according to the technique and criteria established in the literature for the age group and adjusted for gender.
STATISTICAL ANALYSIS
Continuous variables were expressed as mean, standard deviation and percentiles. Categorical variables were expressed in number of cases (N) and percentage (%).
Pearson's chi-square test was used to compare the categorical variables between the groups. To compare the continuous variables, the Mann-Whitney test or Student's t-test was used, depending on the situation. Analysis of Variance (ANOVA) was used to compare the means of NC with those of the individuals with different stages of AD. Spearman's correlation coefficient was used to analyze the relationship between the numerical variables and absence of normal distribution.
The analyses were performed using the IBM SPSS 22.0 software at a 5% significance level (p < 0.05).
RESULTS
SOCIODEMOGRAPHIC, CLINICAL, COGNITIVE AND LIFESTYLE ASPECTS
The sociodemographic, clinical, cognitive and lifestyle aspects of the elderly with AD and NC are shown in Table 1. There was no significant difference in age, education and gender between the groups. The elderly with AD presented significant lower performance in the cognitive assessment when compared to the NC (p = 0.000).
In the classification of dementia severity, a discrete predominance of the elderly in the moderate stage of the disease was observed (39.5%), according to the CDR (Table 1).
Table I. Sociodemographic, cognitive and lifestyle aspects of elderly with Alzheimer's disease and the normal control group
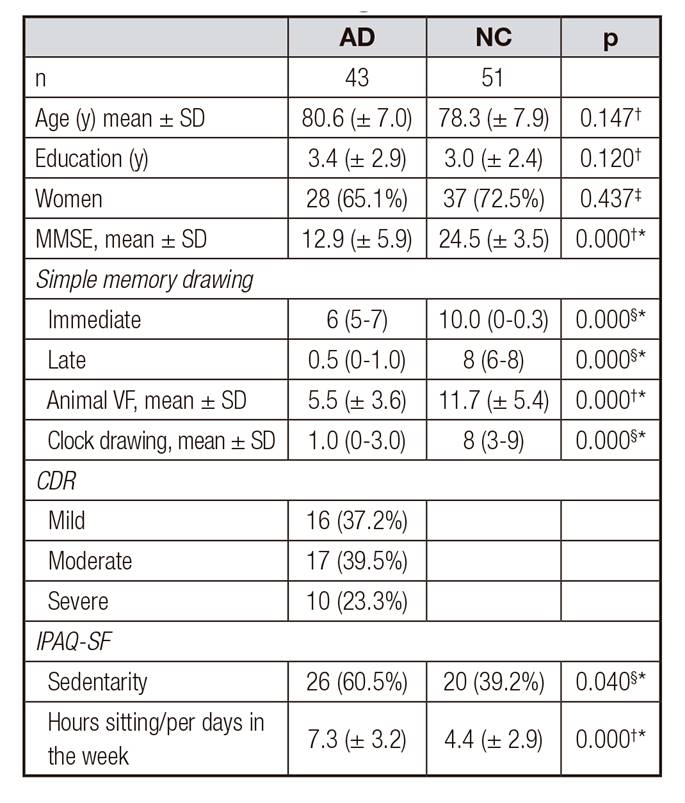
AD: Alzheimer's disease; NC: normal control group; MMSE: Mini-mental state examination score; animal VF: category fluency test; CDR: Clinical Dementia Rating; IPAQ-SF: International physical activity questionnaire.
*p < 0.05.
†t-test
‡Chi-square;
§Mann-Whitney U Test.
A significant difference related to the practice of physical activities according to the IPAQ-SF, higher sedentarity, and longer "sitting hours/per days in the week" was observed in the elderly group with AD (p = 0.040 and p = 0.000 respectively) (Table 1).
NUTRITIONAL STATUS AND SEVERITY OF AD
A significant difference in the MNA scores (screening and global assessment) suggests higher risk of malnutrition in the elderly with AD when compared to the NC (p = 0.000). For question 'A' in the MNA, the elderly with AD complained significantly more about "decreased food intake due to appetite loss, digestive problems, chewing or swallowing difficulties" (p = 0.007). The "intake of at least one daily portion of milk or dairy products, two or more weekly servings of vegetables or eggs, meat, fish or poultry" (p = 0.005) was higher in the elderly with AD (Table 2).
Table II. Values in the Mini Nutritional Assessment (MNA) of elderly with Alzheimer's disease and the normal control group

AD: Alzheimer's disease; NC: normal control group; MNA: Mini Nutritional Assessment.
*p < 0.05.
†Mann-Whitney U Test
‡Chi-square.
The elderly with AD presented significantly lower weight (p = 0.017) and BMI (p= 0.006) and were more frequently classified as lean/eutrophic (p = 0.013), while the NC presented weight excess. The elderly with AD presented lower AC, CC, SSF, AMC and AMA measurements (p = 0.013, p = 0.021, p = 0.001, p = 0.004 and p = 0.003, respectively) when compared to NC, which reveals depletion of lean mass (LM), indicating protein malnutrition and suggesting loss of muscular reserve associated with the disease (Table 3).
The elderly with AD presented significantly lower APMT scores (p = 0.0004) and were classified as 'at nutritional risk' when compared to NC, suggesting that muscular depletion is related to the pathophysiology of the disease (Table 3).
Table III. Nutritional indicators and anthropometric data of the elderly with Alzheimer's disease and the normal control group
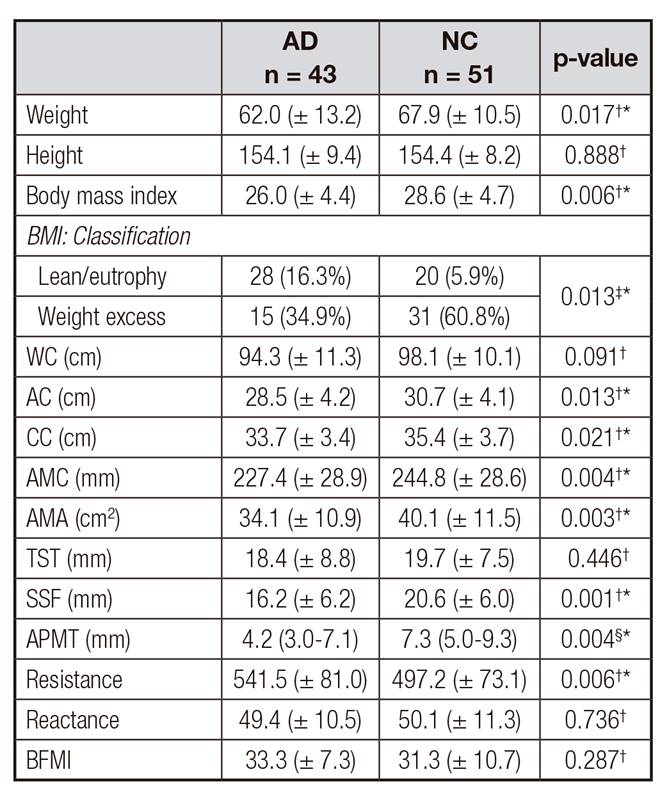
AD: Alzheimer's disease; NC: normal control group; WC: waist circumference; AC: arm circumference; CC: calf circumference; AMC: arm muscle circumference; AMA: circumference of the corrected arm muscle area; TST: triceps skinfold thickness; SSF: subscapular skinfold; APMT: adductor pollicis muscle thickness. BFMI: body fat mass index.
*p < 0.05.
††t-test
‡Chi-square.
§Mann-Whitney U Test
The indicator of resistance, which is a bioelectrical pattern of inflammatory disease, was higher in the elderly with AD, confirming excessive fat deposition in these individuals (Table 3). However, the BIA test did not reveal any significant differences for the reactance measurements between the groups.
The values of the nutritional variables according to the severity of AD are shown in table IV. Body weight (p = 0.010), BMI (p = 0.010), BIA and %FFM (p = 0.012) values were lower (p = 0.012), but resistance (p = 0.014) and body fat (p = 0.030) were higher as the disease progressed.
Significant differences were observed when the nutritional variables in the elderly with mild and moderate AD were compared with those in the NC, as follows: lower AMC (p = 0.028), AMA (p = 0.025), SSF (p = 0.012) and APMT 0.001), higher resistance by BIA (p = 0.014) (Table 4).
Table IV. Values of nutritional indicators and anthropometric data of the elderly with Alzheimer's disease (mild, moderate and severe) and comparisons
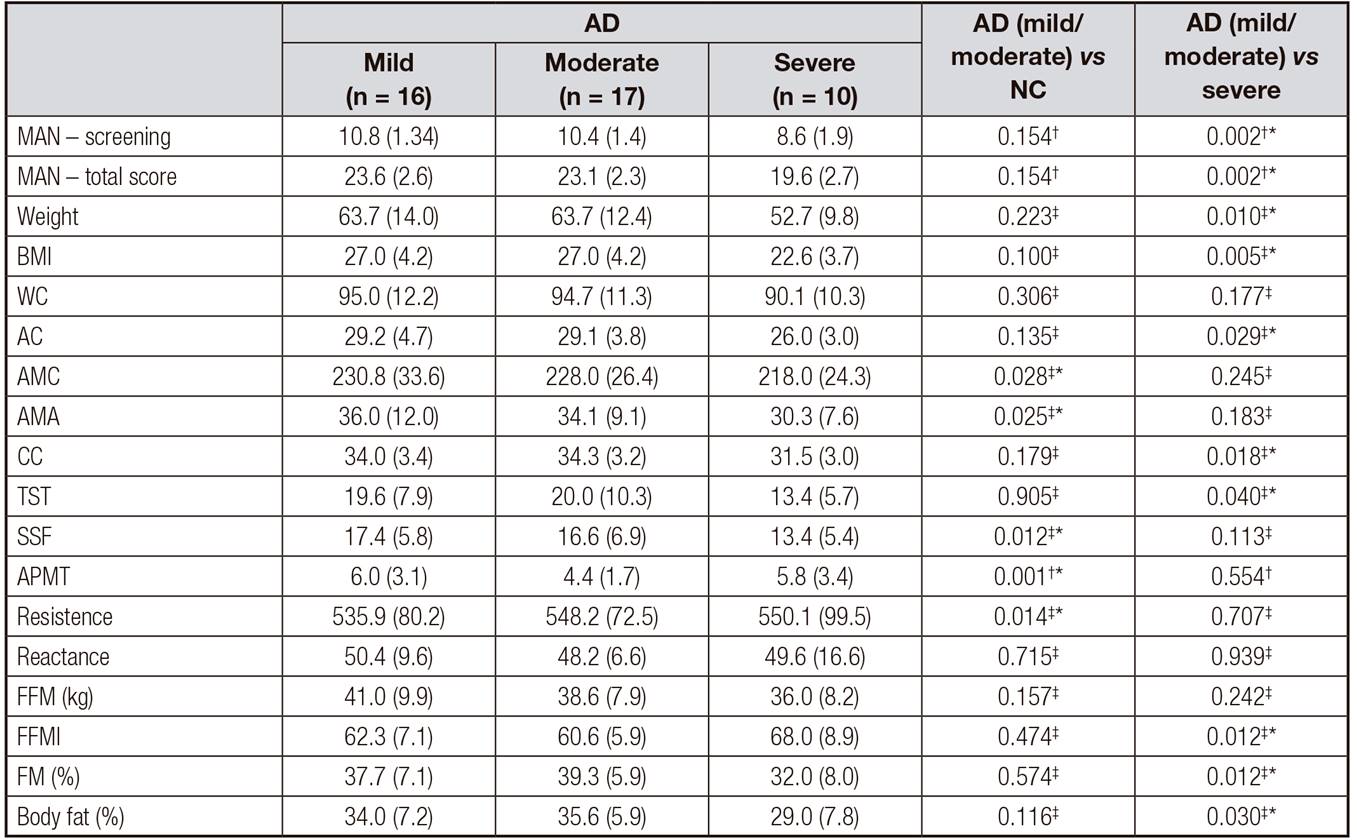
AD: Alzheimer's disease; NC: normal control group; MNA: Mini Nutritional Assessment; BMI: body mass index; WC: waist circumference; AC: arm circumference; AMC: arm muscle circumference; AMA: circumference of the corrected arm muscle area; CC: calf circumference; TST: triceps skinfold thickness; SSF: subscapular skinfold; APMT: adductor pollicis muscle; FFM: fat-free mass; FM: Fat mass.
*p < 0.05.
†Mann-Whitney U Test
‡t-test.
Nutritional indicators and anthropometric data were lower in the elderly with severe AD when compared to those with mild and moderate AD, which suggests a significant impairment of the nutritional status as the disease progresses (Table 4).
COGNITIVE ASPECTS AND NUTRITIONAL STATUS
A significant correlation was observed between weight and WC measurements with the highest total score in MMSE and the clock drawing test (p < 0.05 and p < 0.001) (Table 5). A significant positive correlation was observed between the best performance in the clock drawing test and weight, BMI, and TST measurements (p < 0.05 and p < 0.001) (Table 5). A significant positive correlation was observed between the best performance in the animal VF (naming of as many animals as possible in 60 seconds) and weight (p < 0.05) (Table 5).
Table V. Correlations between performance in MMSE, clock drawing test and animal VF with nutritional indicators and anthropometric data of the elderly with Alzheimer's disease
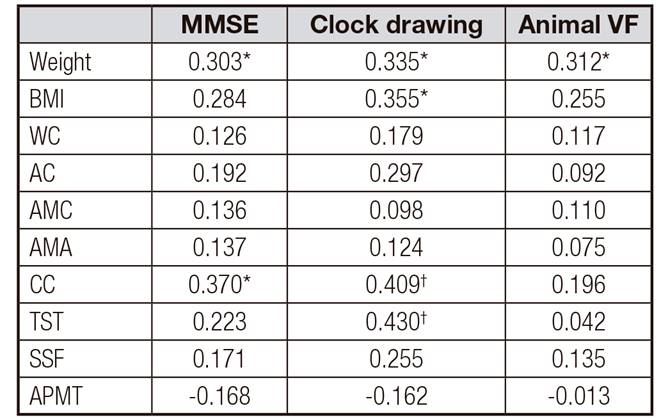
MMSE: Mini-mental state examination score; animal VF: category fluency test; IMC: BMI: body mass index; WC: waist circumference; AC: arm circumference; AMC: arm muscle circumference; AMA: circumference of the corrected arm muscle area; CC: calf circumference; TST: triceps skinfold thickness; SSF: subscapular skinfold; APMT: adductor pollicis muscle. Spearman's correlation.
*p < 0.05.
†p < 0.001
These data suggest that better cognitive performance (MMSE, clock drawing test and animal VF) is associated with higher body weight, BMI, and lean body mass. The progression of cognitive disorders (worsening of dementia) leads to increased weight and LM loss.
DISCUSSION
The present study is pioneer in our country because it assessed the nutritional indicators of elderly with different stages of AD (mild, moderate and severe), confirming the hypothesis of increased risk of malnutrition, progressive impairment of nutritional variables as the disease progresses, and a relationship between nutritional status and cognitive aspects. We expect that these findings contribute to the treatment and prevention of Alzheimer's disorders.
Concerning physical activity, the research found that a sedentarity was higher in the elderly with AD. The practice of physical activities is imperative for health promotion and disease prevention, as there is a positive association between higher cognitive capacity and regular physical activity 24.
NUTRITIONAL STATUS AND CLINICAL ASPECTS
A high risk of malnutrition was observed, which is possibly related to the pathophysiological mechanisms of the disease. Similar data are described in other studies in elderly with cognitive impairment 3,25,26.
The elderly with AD presented lower weight and BMI than the NC. Weight loss in AD is frequent and it occurs in approximately 40% of cases, in addition to several other factors involved in the pathophysiology such as increased energy needs, absorption disturbances, nutritional inadequacies, and low food intake 3,26,27. However, there is still no consensus in the literature about these mechanisms.
The LM evaluation revealed greater loss of muscular reserve and AC, AMA, AMC and APMT measurements in the elderly with AD, like the findings of other studies 28. In our literature review, we did not any find studies assessing APMAT in AD. Like other studies 29, higher resistance in the bioelectrical impedance evaluation was observed in the elderly with AD, which indicates low body cell mass.
We observed a progressive risk of malnutrition as the severity of AD increased, suggesting a greater trend of malnutrition in the more severe stages of the disease, which is in accordance with the findings of other studies 27,30.
Greater impairment of the nutritional indicators, lower weight, BMI, AC, CC and TST measurements, and increased fat mass were observed in the elderly with severe AD when compared to those with mild and moderate AD.
Progressive weight and BMI loss suggest that the worsening of the disease is a risk factor for weight loss. Other studies reported reduction in BMI in the severe stage of AD when compared to the mild and moderate stages of the disease when analyzing patients in the three stages of the disease 27,30. Weight loss can occur at all stages of AD and even before the onset of cognitive complaint, which is the marker of incipient dementia 26.
As the disease progresses, in the comparison with the elderly with mild/moderate AD and those with severe AD, there was depletion of LM (AC and CC), reduction of body fat (%) and subcutaneous adipose tissue, and higher FFMI values, possibly associated to the pathophysiological mechanisms of the disease, which were similar to the findings reported in the literature 27,29,30.
NUTRITIONAL STATUS AND COGNITIVE VARIABLES
The best cognitive performance was correlated with higher weight, increase in lean mass reserve and fat mass, suggesting that there is a correlation between better cognitive performance, nutritional status, and increased LM and FM. In a study that assessed women with dementia, worse cognitive status was reported as lean mass loss increased 28. Previous studies have described a positive relationship between LM and cognition in healthy elderly people 31. In middle-aged adults, the relationship between the presence of central adiposity and lower cognitive performance in almost all domains and increased risk of dementia is acknowledged, however, in the elderly, there is no clear evidence of this association 32 33-34.
CONCLUSION
Elderly people with AD are more sedentary, present higher risk of malnutrition, lower weight and BMI, reduced LM and increased FM. Progressive impairment of nutritional indicators as the disease progressed and poorer relationship between nutritional variables and cognitive performance were observed.

