


 Servicios personalizados
 Inglés (pdf)
 Articulo en XML
 Referencias del artículo
 Enviar articulo por email
 Citado por SciELO
  Citado por Google
  Similares en
SciELO
Similares en
SciELO  Similares en Google
 Permalink
INTRODUCTION
Patients with severe neurologic diseases frequently experience nutritional and growth disorders and bone health complications of multifactorial origin, being these more evident with increasing motor disorder (1,2). Almost half of these children show problems with feeding and malnutrition, frequently under-recognized (1,3). Undernutrition can have adverse consequences, including growth failure, greater motor disorder, poor bone health, recurrent pneumonia and neurologic worsening with increasing cognitive delay and abnormal behavior (4).
Among factors that contribute to nutritional disorders in children with neurologic disease are oromotor dysfunctions that result in insufficient intake, increased losses and feeding behavior disorders (5). A frequent problem in these patients is osteoporosis related to immobility, undernutrition, insufficient intake of calcium, limited solar exposure and treatment with antiepileptic drugs. All of them often favor fractures after minimal trauma (6 7-8). As a consequence, all of these conditions negatively affect the quality of life of the children and their caregivers or family (3,9).
In order to assess bone health, the recommended method and most widely available is to evaluate BMD using Dual-energy X-ray absorptiometry scan (DXA). During childhood, BMD changes according age and sex, so we need to express the results as z-score. Because BMD is a two-dimensional measurement, it is a problem to interpret the results in the growing skeleton, as BMD measurements are affected by body size (10). Currently, there is no consensus about which method we must apply to adjust BMD for height in order to avoid over and under diagnosis of low BMD. There have been several approaches, but most of them are difficult to perform in clinical practice.
With this perspective, the aim of our study was firstly to analyze a method to determine bone mineral density (BMD) accurately in neurologically impaired children. Secondly, to determine the relationship between BMD, the nutritional status and micronutrient levels, in order to identify which factors are associated with low BMD.
MATERIAL AND METHODS
An observational multicenter study was conducted. Data was collected between September 2014 and September 2016.
PATIENTS
Patients under 16 years of age with neurological impairment were recruited. They were controlled in Pediatric Gastroenterology and Nutrition outpatient clinics of five hospitals. Patients with the following moderate or severe motor affectation were included: a) cerebral palsy (CP) grade III, IV or V classified according to the Gross Motor Function Classification System (GMFCS) (11); b) patients with severe neurological disorders that could not walk around without help (Table I). In both cases, written parental consent and approval from the Hospitals’ Ethics Committee were obtained.

Parameters recorded were: age, gender, underlying disease, medications, questions to assess swallowing problems, and feeding method (oral or tube-feeding). Factors related with BMD, mineral and vitamin D supplementation, history of bone fractures and treatment with antiepileptic drugs were assessed. The intellectual delay was classified according to the diagnostic criteria of the DSM-IV-TR, categorizing children with or without severe mental retardation (12).
ANTHROPOMETRIC ASSESSMENT
The weight was obtained from the child either naked or in underwear. Given that these children are not capable of standing with stability, they were weighed together with the caregiver, whose weight was later subtracted (Clinical electronic scales Seca® model 769, Germany) (4,5). Length was measured in a supine position using an anthropometer or horizontal measuring table (Holtain® stadiometer, United Kingdom). In children who showed contractures, spasticity or severe scoliosis, as the measurement could not be obtained this way, measurement of segmental lengths was recorded on the left side of the body and repeated, achieving the average of both measurements. In children with some disparities, the measurements were obtained from the least affected side. The upper arm length (UAL) (distance from the acromion to the radial head) and the tibial length (TL) (distance from the supermedial edge of the tibia to the inferior edge of the medial malleolus) were measured (13). In these children, the stature (S) was calculated from the TL using the following formula: S = (3.26 x TL) +30.8 (14). In these patients, the body mass index (BMI) was not calculated so as not to magnify the possible error of the estimated S calculation when squared.
Other measurements recorded were mid upper arm circumference (MUAC) (with inextensible tape measure) and triceps and subscapular skinfolds thickness using a skinfold caliper (0.2 mm precision) (Holtain®, United Kingdom), obtaining the average of three measurements.
The anthropometric data was converted into z-score for age and sex according to the references of the WHO for children under 5 years of age (15). For those older than 5, the weight, size and BMI z-score were calculated according to references of the WHO (16), applying references of Frisancho for MUAC and skinfold thickness (17).
HEMATOLOGIC AND BIOCHEMICAL EVALUATION
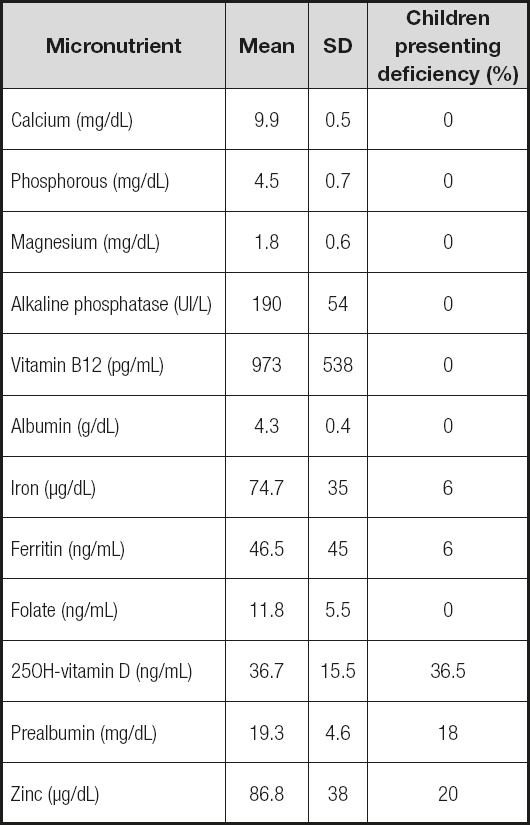
During the initial evaluation of each patient, hematologic and biochemical analyses were performed. The biochemical evaluation included measuring levels of albumin, prealbumin, calcium, phosphorous, magnesium, alkaline phosphatases, 25OH vitamin D, parathyroid hormone (PTH), vitamin B12, folate, iron, ferritin and zinc. A concentration of 25OH vitamin D below 30 ng/mL was considered insufficient, and marked as deficiency if below 20 ng/mL (18). Zinc was considered below normal when the levels were under 70 µg/dL (19).
ASSESSMENT OF BONE HEALTH
BMD was evaluated at lumbar spine (L2-L4) through DXA (Norland DXA®). Firstly, the measurements obtained (g/cm2) were converted into z-scores normalized by chronological age and sex according to the previously published data (20). Secondly, BMD z-score were calculated substituting chronological age for height age. Height age was calculated for children with height below z-score <-2 as the age at which the child’s height would be in 2nd percentile. For children with height greater than 2nd percentile, height age was assigned the same as chronological age.
DATA ANALYSIS
Descriptive statistics were calculated for the demographic, clinical characteristics, and biochemical analysis. Independent sample one-way ANOVAs were undertaken to determine the differences in anthropometric characteristics between patients with or without gastrostomy. Pearson’s correlations were calculated to determine the level of association between BMD (calculated in the two ways: chronological age and height age), age, anthropometric z-scores and vitamin D levels. Hierarchical multiple regression analyses were conducted with the BMD and anthropometric z-scores. Statistics were generated with a standard statistical package IBM SPSS Statistics for Windows, version 23.0 (IBM Corp., Armonk, N.Y., USA). The two-sided threshold for statistical significance was set at p < 0.05.
RESULTS
A total of 52 patients were included (patients’ main characteristics in table I). The mean age was 9.9 years (range 4-16), and 63.5% of sample were boys. Among these patients, the majority presented severe motor impairment, whereas 85% suffered from profound mental retardation. The main diagnostic obtained was CP (77%). Anticonvulsive drugs were prescribed in 63.5% of cases, and proton pump inhibitors (PPI) in 58%. Most children (67.3%) received oral feeding, 17 of them (48.5%) with supplement in the form of polymeric formula. Seventeen patients (33%) were fed by gastrostomy tube. Twelve children (23%) received oral supplement with vitamin D at the time of the study.
ANTHROPOMETRIC RESULTS
The anthropometric results are showed in table II. In 63% of children, the weight z-score was below 2SD; height z-score was below 2SD in 64% patients; and BMI resulted below 2SD in 31% children. No differences between patients with or without GT were shown except in height for age. The stature was not possible to obtain in a direct way in 16 children and had to be calculated by estimating from the TL.

HEMATOLOGICAL AND BIOCHEMICAL RESULTS
Iron deficiency anemia was detected in 3 patients (2 of them at a pubertal age). The biochemical study showed that 19 children (36.5%) had vitamin D levels lower than recommended (25% insufficiency and 11.5% deficiency), while levels of calcium, phosphorus, magnesium, alkaline phosphatase, vitamin B12 and folate remained normal in every case. PTH levels were not included in the results because we have results only in 40% of the patients, showing normal levels in all of them. The albumin was normal, while the prealbumin was diminished in 18% of patients. Levels of zinc were found to be diminished in 20% of patients (Table III).
BONE HEALTH
A total of 15.4% of patients included in the study had a history of bone fractures. BMD was lower in patients with history of bone fractures, but it was not statistically significant (p = 0.277).
When calculated for chronological age, 26 patients (50%) showed a BMD z-score <-2 (mean -1.73 ± 1.25), whereas only 18 (34.5%) showed BMD z-score <-2 when calculated for height age (mean -1.44 ± 1.27).
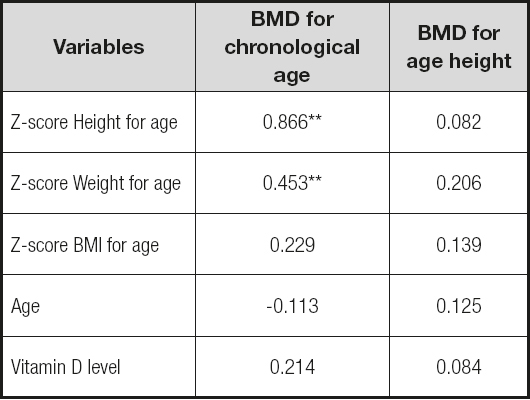
The associations between BMD and other variables are presented in table IV. When calculated for chronological age, BMD was significantly correlated with z-score weight (r = 0.453, p = 0.001), and z-score height (r = 0.340, p = 0.042), but not with BMI z-score. However, no correlation was found when BMD calculated applying height age. No relation was observed between BMD and the levels of vitamin D or age.
DISCUSSION
Nutritional support in children with neurological disabilities is considered an important factor to improve global outcome, reduce complications and promote the quality of life of both the patient and their parents/caregivers. As a part of their nutritional assessment, bone health should be evaluated, because children with disability of a neurological origin frequently feature lower BMD compared with healthy children of the same age and gender, resulting in an increased risk of fractures (21,22). The objective of bone health assessment in clinical practice is to determine whose children are at risk, in order to establish a treatment before suffering fractures. The recommended method is measuring BMD with DXA. BMD values must be expressed in age and sex specific z-scores. Additionally, it is well known that DXA measures of BMD are confounded by short stature (23), but there is no consensus about how to adjust these results for bone size.
It has been proven that neurologically impaired children grow slower than children of the same age and gender without chronic pathology (24 25-26), and these differences increase with age (8). This is due to both nutritional and non-nutritional factors, such as genetic and endocrine factors. Our anthropometric results show average z-scores for height under 2 SD, suggestive of stunting, so the need to adjust the results for body size becomes even more important.
Some authors suggest adjusting BMD for height age, which is the age at which child’s height is the median height-for-age on the growth chart (27). A limitation of this procedure is that it doesn’t consider pubertal maturation. The calculation of bone mineral apparent density (BMAD) adjusted for age is also proposed, but this is a complicated procedure to perform in clinical practice (28). We suggest adjusting BMD for height age, but taking the age corresponding to 2nd percentile, because it is the lower limit of normality considered by WHO. In our opinion, taking the median (50th percentile) as a reference is an unrealistic goal because these children have a height well below this parameter, thus the height for 50th percentile is far from reality.
In our findings, half of the sample features exhibited low BMD according to chronological age, with a z-score less than -2 SD. However, when calculated for height age (age at which the child’s height would be in 2nd percentile), this percentage decreased to 34.5%. These results show that not adjusting for height may result in over diagnosing low BMD.
Low BMD is known to be associated with a higher risk of fractures (29), thus monitoring and follow up are important. As previously mentioned, fractures are frequent in patients with severe or moderate neurological affectation, and those that have indeed had a fracture have an increased risk of having subsequent ones (7,30). In our series we have found 15.4% of patients who experienced a fracture in the past, which is similar to previously published data (30,31) and it is probably due to multiple factors that can influence bone health in a negative way (32). Some risk factors that these patients present are undernutrition, feeding disorders, age, history of previous fractures, immobility, and antiepileptic treatment (10,33 34-35).
In our patients, it was noted a high prevalence of epilepsy (63.5%), which requires specific drugs that can contribute to bone disorders. Feeding problems in children with neurological diseases can produce deficiencies at micronutrient level. Thus, their deficiencies in many cases can be subclinical, being able to affect different areas (36). Therefore, it is crucial to carry out a periodic monitoring and control of these aspects. In our study, we have found a high prevalence of vitamin D and zinc deficiency. Regarding the definition of lack of vitamin D in infancy, in 2013 the ESPGHAN Committee on Nutrition considered levels of 250H-vitamin D below 50 nmol/L (equivalent to 20 ng/ml) as deficient and levels below 25 nmol/L (10 ng/ml) as severe deficiency, taking into account that these recommendations are for healthy children (37). In the same way, Munns et al., in a global consensus recommendations on prevention and management of nutritional rickets published in 2016, consider levels below 50 nmol/L as insufficiency, and below 30 nmol/L as deficiency (38). Nevertheless, other authors consider insufficient levels between 50-80 nmol/L (20-30 ng/ml) and deficiency levels below 50 nmol/L (< 20 ng/ml) (18). Considering the multiple risk factors for bone health in these children, it seems more convenient to contemplate the latter. It should be noted the normality at biochemical level of the minerals (calcium, phosphorus, magnesium), alkaline phosphatase, vitamin B12 and folate in all cases, supporting what was described in other series (39). However, it has to be taken into account that the normality of the levels of these minerals in blood do not reflect fully the state of the entire organism, given that it deals with important components at blood level and that they are strongly regulated by homeostasis (36).
It should be considered that many of the risk factors for bone health that these patients have are interrelated, which makes it difficult to determine their contribution in an isolated way. In our patients, after performing Pearson’s correlation, we found association between the BMD z-score and the z-score of weight and height. However, this relation is not maintained after adjusting BMD for height. The association we observed between height, weight and BMD is most likely an artefact of the short stature in these children, rather than a true effect of undernutrition. Consequently, it disappears after adjusting BMD measurements for height age. No association with age or vitamin D levels were found, despite being described previously in the literature (6).
To this effect, accurate reporting of these patients’ clinical and laboratory data throughout their follow-up can be of interest to paediatricians responsible for these patients.
Despite the relevance of this study’s findings, several limitations must be acknowledged. Firstly, the transversal nature of this study limits the ability to withdraw causational or directional conclusions. Secondly, since the sample comprises children suffering from neurological diseases, results may not be readily applicable to children with other underlying diseases. Finally, the relatively small sample size imposes an overall limitation to result extrapolation.
In conclusion, these results suggest the need to perform a periodic follow up of the nutritional status of children with neurological impairment as an integral part of their health care, aiding to early detect nutritional disorders so that they will benefit from precocious treatment (5). During the follow up it is important to monitor the levels of vitamin D and zinc, as their lack is frequent but can be corrected, and to perform periodic controls of DXA to try to early detect changes in the BMD before they suffer fractures. We suggest calculating BMD z-score according sex and adjusting age at which height is at 2nd percentile if lower, to avoid to over diagnose low BMD.

