


 Custom services
 English (pdf)
 Article in xml format
 Article references
 Send this article by e-mail
 Cited by SciELO
  Cited by Google
  Similars in
SciELO
Similars in
SciELO  Similars in Google
 Permalink
INTRODUCTION
Secondary malnutrition in chronic kidney disease (CKD) is a complex, multifactorial process associated with a number of conditions: inadequate intake of energy, macro, and micronutrients; hyporexia; electrolyte imbalance; acidosis; anemia; uremia; abnormal loss of protein in the urine; loss of nutrients during peritoneal dialysis and hemodialysis; hormonal disorders; and increased basal energy expenditure (1 2-3). Some consequences of malnutrition in the early stages of life may be its impact on linear growth and body composition, particularly on fat reserves and muscle mass (4,5).
Systemic inflammation, particularly through proinflammatory cytokines, has been associated with malnutrition in adults with stage-3 or -4 CKD (6). The proposed mechanisms for this association are decreased appetite, muscle proteolysis, increased catabolism, and decreased albumin synthesis (7,8). This association has been sparsely studied in children and adolescents with CKD, particularly in the pre-dialytic stages. The aim of this study was to correlate anthropometric indicators of growth and nutritional status with the serum concentrations of interleukin-6 (IL-6) and ultrasensitive C-reactive protein (CRP) in children with CKD in stages 3 and 4.
MATERIALS AND METHODS
PATIENTS
In this prospective, cross-sectional study 29 consecutive children and adolescents with stages 3 or 4 of CKD who were taken care of in two third-level general hospitals were studied from February through December 2014. Inclusion criteria were CKD stages 3 or 4 (glomerular filtration rate, 15–59 mL/min/1.73 m2) and age 3 to 16 years. Patients with systemic or autoimmune diseases, primary tubular acidosis, acute or chronic infections, and treatment with anti-inflammatory drugs were not included.
ANTHROPOMETRY
– Standardization: before data collection, the authors performed an anthropometrical standardization trial (9). Consistency (intragroup individual measurements) and validity (comparison with a gold standard) were evaluated with Pearson’s bivariate correlations. When the correlation coefficient was below 0.8 the anthropometric technique was reviewed and corrected until intragroup and intergroup correlations above 0.8 were achieved.
– Weight: patients were weighed with a movable-weight, platform-beam scale (ATCO mechanical height and weight scale, WSE40032), without shoes and with minimal clothing. Weight was recorded to the nearest 100 grams (10).
– Height: height was measured and recorded to the nearest 0.1 cm with a standiometer fitted with a movable block (ADE/Germany, MZ10023). The subjects were measured while standing, without shoes, heels together, back as straight as possible, and arms hanging freely; the head was positioned in the Frankfort horizontal plane (10).
– Mid-upper arm circumference (MUAC): to obtain the MUAC the patient’s left arm was bent at a 90-degree angle at the elbow, with the upper arm held parallel to the side of the body. The distance between the acromion and olecranon was measured with a fiberglass metric tape, and the midpoint between these two points was marked. The children’s arm was then relaxed, hanging loosely by the side. The fiberglass tape was positioned at the marked midpoint, and the circumference was recorded to the nearest 0.1 cm (10).
– Triceps skinfold (TSF): the TSF was measured with a Lange skinfold caliper (Cambridge, Maryland, USA) at the previous posterior mark in the left upper-arm midpoint. The arm was extended in the same relaxed position used for the MUAC. The examiner grasped a vertical pinch of skin and subcutaneous fat between the thumb and forefinger, approximately 1 cm above the marked midpoint, gently pulling away from the underlying muscle. The skinfold caliper was placed at the midpoint mark while maintaining the skinfold grasp. Readings were measured in millimeters when the caliper came in contact with the skin and the dial reading was stabilized (9-12).
– Total arm area (TAA); arm muscle area (AMA); and arm fat area (FAA): arm areas were calculated according to the formulas described by Frisancho; the results were expressed in square centimeters (10).
– Reference patterns and indicators of nutritional status: the z-scores for height for age and body mass index (BMI) for age were calculated with the World Health Organization (WHO) 2006 reference pattern (11). Z-scores of the mid-upper arm circumference, triceps skinfold, and arm areas for age were calculated with the Frisancho reference patterns (10-13). Z-scores for each arm measurement and area were classified into two groups: < -2 SD and -2 to +2 SD.
BIOELECTRICAL IMPEDANCE (BIE)
The estimation of lean body mass and fat percentage was performed with the analyzer BODYSTAT® QuadScan 4000, with the subject fasting for three hours, avoiding moderate and vigorous physical activity before measurement, and without metal objects (watch, chains, earrings, etc.). The children were placed in a supine position over a non-electrically conductive surface at room temperature. Two electrodes were positioned in the right hand (one behind the knuckles, one on the wrist next to the ulnar head), and two electrodes on the right foot (one behind the toes, one at the ankle). The black measuring leads were connected to the electrodes on the wrist and ankle, and the red leads to the distal electrodes. Then the measuring device was turned on to introduce the necessary data (age, weight, and height), and subsequently allow the passage of electric current; the data were printed after five seconds and then transferred via Bluetooth to the QuadScan software (14) (Clasey JL, 2011).
HEMATOLOGY AND CLINICAL CHEMISTRY
Routine laboratory tests included serum hemoglobin (g/dL), serum creatinine (mg/dL), and serum albumin (g/dL). The glomerular filtration rate was estimated with the Schwartz formula and reported as mL/min/m2 (15).
Interukine-6: the quantification of serum IL-6 was performed by high-sensitivity enzyme-linked immunosorbent assay (ELISA) kits (KHC0064, Invitrogen®) with 96-well plates and a microplate reader. This assay recognizes both the natural and recombinant forms of this target with a sensitivity < 2 pg/mL and a standard curve range of 7.8-500 pg/mL. The sample volume required was 100 µL with a total assay time of 3 hours.
Ultrasensitive C-reactive protein: the quantification of highly sensitive CRP was performed using the latex-turbidimetry method with detection starting from 0.06 mg/L (Linear Chemicals®SL).
STATISTICS
Quantitative demographic, anthropometric, and laboratory data had a normal distribution and were reported as mean and standard deviation (SD); the comparison of means was performed with an independent Student’s t-test. IL-6 and CRP had an abnormal distribution and were reported as median and interquartile range. The correlation between inflammation markers and anthropometrical indicators was calculated using Spearman’s rho. The comparison of serum concentrations for inflammatory markers and nutritional status as a categorical value was performed with the Kruskal-Wallis H analysis. A linear regression analysis was performed with the anthropometric indicators of growth and nutritional status as dependent variables, and with serum interleukine 6 and C-reactive protein concentrations as independent variables.
ETHICAL ASPECTS
This work was done using the resources of the institutions involved – Hospital Civil de Guadalajara Dr. Juan I. Menchaca, Hospital Civil de Guadalajara Fray Antonio Alcalde, and Universidad de Guadalajara. The protocol was reviewed and approved by the Health Research and Ethics Committees of both hospitals (1347/14). Parents or legal guardians provided their informed consent in writing prior to study enrollment. Children older than 12 years signed a written assent.
RESULTS
PATIENTS
Seventeen patients (58.6%) were males and 12 were females. Mean age was 11.3 (± 4.7) years, with a minimum and maximum of 3 and 16 years.
CHRONIC KIDNEY DISEASE
The etiology of CKD was multiple. The diagnoses in descending order were renal hypoplasia or agenesis (n = 7), obstructive uropathy (n = 3), prematurity (n = 3), glomerular diseases (n = 2), and single cases of tubule-interstitial nephropathy, cystic disease, toxicity by cisplatin, neurogenic bladder, and nephroblastoma; in 9 cases the etiology was unknown. The time between CKD diagnosis and inclusion in the study was 5.5 (± 4.3) years.
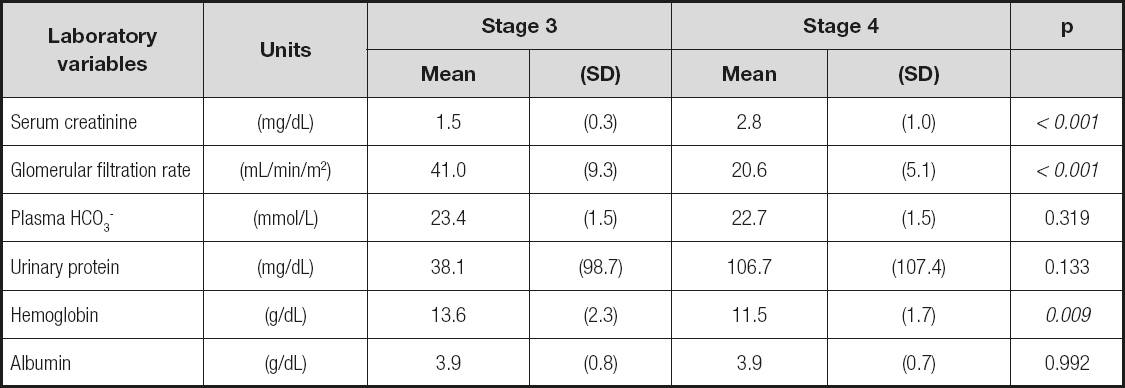
The biochemical and hematological variables, classified according to CKD stage, are listed in table I. Serum creatinine was higher and glomerular filtration rate was lower in stage-4 patients. Hemoglobin concentration was higher in patients in stage 3. No differences in plasma HCO, proteinuria, and serum albumin were observed.
ANTHROPOMETRY
Height for age: the location trend of the height-for-age z-scores was in the negative region of the distribution curve (-1.6 ± 1.3 SD). Eleven patients were located below -2 SD and four below -3 SD; the proportion of stunting was 37.9%. No difference was found in the frequencies of chronic malnutrition between patients in stages 3 and 4.
Body mass index for age: the BMI-for-age z-score distribution also showed a trend to be located in the negative area of the curve (-0.8 ± 1.6). Six patients (20.7%) were located below -2 SD and two below -3 SD; the proportion of acute malnutrition was 20.7%. No difference was found in frequency of acute malnutrition between patients in stages 3 and 4.
Arm anthropometrics: the results of arm anthropometrical measurements and areas are shown in table II. The z-score means of all indicators were located in the negative area of the distribution curve. MUAC and TAA were below -2 SD in one fifth of patients. AMA was below -2 SD in 17.2% of cases; FAA and TSF were within the assigned normal limits in all cases.
Table II. Arm anthropometric indicators and subscapular skinfold calculated on 29 children and adolescents with chronic kidney disease
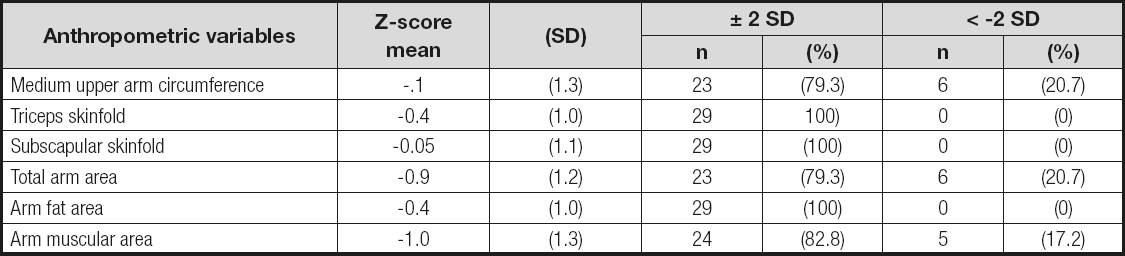
Data are presented as numerical variables (z-score mean and standard deviation) and as categorical variables (frequencies and percentages). Assigned normal limits: -2 to +2 SD.
Table III. Medians and interquartile ranges (IQR) for serum interleukine 6 (IL-6) and ultrasensitive C-reactive protein (CRP) as measured in 29 children and adolescents with CKD
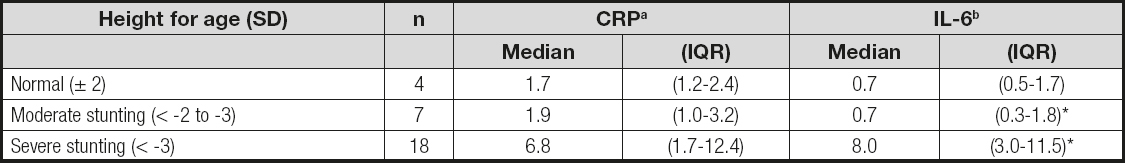
aCRP, p = 0.032.
bIL-6, p = 0.016. The results are grouped according to the World Health Organization (WHO) classification of height for age. Statistics: Kruskal-Wallis test.
Subscapular skinfold: the subscapular skinfold was within normal limits in all cases.
The comparison of frequencies and means for arm indicators between patients in stage 3 and in stage 4 showed no statistical differences.
BIOELECTRICAL IMPEDANCE
The correlation coefficients of IL-6 (pg/mL) with lean mass values (g) and body fat percentage as estimated by BIE are shown in table IV. Lean mass showed a significant negative linear relationship, and percentage of fat showed no relationship between both variables.
Table IV. Correlation coefficients of interleukin 6 and C-reactive protein serum concentrations with anthropometric indicators of growth and nutritional status plus lean body mass and fat percentage as assessed by electric bioimpedance on 29 children and adolescents with CKD stages 3 and 4

Statistics: Spearman’s bivariate correlation. BMI: body mass index.
INTERLEUKINE 6 AND ULTRASENSITIVE C-REACTIVE PROTEIN
Interleukine 6: the median value of serum IL-6 concentrations in the overall group was 0.8, interquartile range (IQR) 0.5 to 2.2 pg/mL. In 15 patients (51.7%) this value was above the parameter (2.03 pg/mL, IQR = 1.1-5.1). The comparison of serum IL-6 concentrations between patients in stage 3 and stage 4 showed no differences.
Ultrasensitive C-reactive protein: the median value of CRP in the overall group was 1.8 (IQR = 1.2 to 3.4) mg/mL. In 8 patients (27.6%) CRP concentration was above the reference value (8.5 mg/mL, IQR = 3.9-12.4). The comparison of CRP concentrations between the stage-3 and stage-4 subjects showed no differences.
IL-6, CRP, HEIGHT AND NUTRITIONAL STATUS
Table III shows the median and IQR values for IL-6 and CRP, grouped according to the WHO classification of height for age. The values of both markers were higher in the presence of stunting, particularly in severe cases. The comparison of concentrations for both IL-6 and CRP according to degree of height-for-age impairment was significantly higher, particularly in cases with severe stunting.
The correlation coefficients of serum IL-6 and CRP concentrations with height or nutritional status anthropometric indicators are shown in table IV. Z-scores of height for age, body mass index, subscapular skinfold, and arm fat area showed significant negative correlations with serum IL-6 levels; the indicators of adiposity, triceps skinfold and arm fat area, despite their not exceeding -2 SD, showed a negative linear relation with IL-6. Height-for-age z-scores also showed a negative and significant correlation with serum CRP concentration. Lean body mass also showed a significant negative correlation with IL-6. Both indicators of adiposity, arm fat area and fat percentage by BIA did not show a significant linear relationship.
A regression analysis showed that IL-6, assigned as independent variable, independently predicted 35% and 33% of the variance of height for age and BMI as indicators of growth and nutritional status, respectively. The subscapular skinfold explained 15% of the variance of height for age. CRP predicted 22% of the variance of height (Table V).
Table V. Lineal regressions performed in 29 children and adolescents with chronic kidney disease through the z-score of anthropometric indicators of growth and nutritional status as dependent variables, and serum concentrations of interleukin 6 (pg/mL) and C-reactive protein (mg/dL) as independent variables
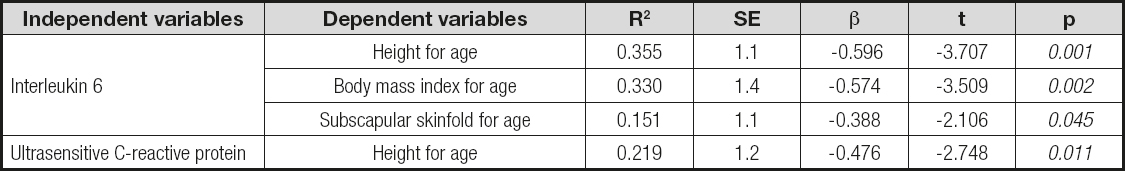
Anthropometric indicators were handled as z-scores. SE: standard error.
DISCUSSION
The driving hypothesis of this work was the demonstration of a relationship between two indicators of inflammation and nutritional status. We showed a negative linear correlation of IL-6 and CRP with anthropometric indicators of growth and body composition, both by anthropometry and by bioelectrical impedance. These observations were strengthened by the linear regression analysis, which allowed us to predict these indicators from IL-6 and CRP. These findings provide a partial statistical explanation for the growth and nutritional impairment observed in our patients; because it is a correlation of random variables, the results can be extrapolated to CKD patients in similar conditions.
Systemic inflammation is a condition that occurs with a certain frequency in patients with renal disease, and has been associated with malnutrition, morbidity, and mortality (16,17). The reported evidence of this association is robust in adult patients with renal diseases but in children is not entirely clear (18). Sylvester et al. measured IL-6 levels in 10- and 15-year-old healthy children, and found a mean of 0.7 ± 0.2 pg/mL (19); in the current study, slightly higher values were observed in the pre-dialysis stage. The value of this interleukin has been studied in children with CKD on dialysis, when the inflammatory process is more noticeable with values > 10.1 pg/mL (20). The serum concentration of CRP in our study was similar to the values obtained by Sozeri et al. in pre-dialysis children (21). The association of chronic inflammation and CKD is controversial. The proposed mechanisms include a decrease in the clearance of pro-inflammatory cytokines, a decrease in antioxidant levels (vitamin C, vitamin E, carotenoids, selenium), an impairment of the energy–protein and food intake equilibrium, comorbidities, dialysis membranes with low biocompatibility, and peritonitis episodes (22).
The assessment of current nutritional status by means of anthropometry has been controversial when fluid retention may occur, as in chronic liver disease, heart disease, or CKD, because body weight – the usual axis of anthropometric indicators for BMI or weight for height – is altered by edema (23). However, fluid retention tends to be distal and affects little or almost nothing proximal arm segments (9,24,25). In our study, the z-scores of both arm indicators and BMI were in negative values; however, no difference in the frequency of acute malnutrition was shown between them. This means that the higher the concentration of serum markers for systemic inflammation, the more negative the the z-scores for growth and nutritional status indicators, moving away from zero in a linear and statistically significant relationship.
Mean serum albumin concentration was normal in both groups; this variable, together with the hemoglobin level, is involved, among other factors, in fluid retention. It is possible that in patients with hypoalbuminemia and anemia fluid retention would be greater, and that arm anthropometry would be useful in the diagnosis of current nutritional status.
Arm indicators were also located in the negative values of the parameter and allowed to estimate fat and/or muscle deficit in about one-fifth of cases; the finding that the most severe arm impairment, below -2 SD, was in the muscular area could indicate that there is a selective presence of protein malnutrition that could be related to reduced intake and urinary losses. In our study, arm anthropometry results were similar to those published by Sylvestre et al. (19).
In contrast to the frequency of acute malnutrition, height for age was below -2 SD in one third of our patients. Growth impairment has been demonstrated by other authors, mainly in patients on hemodialysis and peritoneal dialysis; this probably is the nutritional condition with greater implications for growth and development (19,21,23,26). Growth failure has been associated with an increase of 14% in the risk of death for each decrease in one standard deviation of height for age (27).
The weaknesses of the present work are a limited sample size and the diversity of diagnoses encompassed with CKD, which implies a great diversity of pathophysiological mechanisms. Its strengths include the finding of a linear and negative predictive relationship between IL-6 and CRP with anthropometric indicators of growth and nutritional status, which may add information to secondary malnutrition mechanisms in CKD, and the estimate of a clinically significant frequency of acute and chronic malnutrition with growth impairment and muscular mass deficit as central components of the malnutrition syndrome.

