


 Custom services
 English (pdf)
 Article in xml format
 Article references
 Send this article by e-mail
 Cited by SciELO
  Cited by Google
  Similars in
SciELO
Similars in
SciELO  Similars in Google
 Permalink
INTRODUCTION
Sarcopenia, when associated with obesity, is called sarcopenic obesity. This condition reduces functional capacity, favors loss of autonomy, and is associated with increased mortality in the elderly (1,2).
The prevalence of sarcopenic obesity differs according to the chosen diagnostic method and/or the population studied, being more frequent in females (3,4). Studies using different diagnostic methods for the diagnosis of sarcopenic obesity show a prevalence between 0 and 41% (5), and in Brazil specifically, prevalence ranges from 3 to 41% (6,7).
Several methods are used to diagnose sarcopenic obesity. For the diagnosis of obesity in the elderly, body mass index (BMI), waist circumference (WC), and BMI–associated with WC and total body fat percentage (TBF %) identified by skinfolds, or by more accurate methods to estimate body composition–have been used (3). For sarcopenia, the most frequent diagnostic methods are skeletal muscle index (SMI), handgrip strength (HS), and usual gait speed (GS) (2).
This study aimed to identify sarcopenic obesity in community-dwelling elderly women using different methods that consider the quantitative assessment of muscle mass, strength, and physical performance, as associated with different diagnostic criteria for obesity.
METHODS
A cross-sectional study with 138 elderly women enrolled in an Open University of the Third Age in Salvador-Bahia was developed by the Center for Studies and Intervention in the Aging Area (CEIAE-CNPq), Nutrition School, Federal University of Bahia. The Research Ethics Committee at the Nutrition School approved the study (assent 1.159.885/2015). All participants signed an informed consent form (TCLE).
A sample size calculation considered a 95% confidence interval (CI) with a sample error estimate of 6%. The initial sample consisted of 147 elderly adults. Four women were excluded from the initial sample because they had a contraindication to bioelectrical impedance analysis (one had a pacemaker and three had metallic prostheses). Five men were excluded from the analysis because they were the only males in the sample. The final sample was 138 elderly women. The trained team, using standardized techniques, performed the data collection and adjustments after conducting a pilot study.
DIAGNOSIS OF SARCOPENIC OBESITY (SO)
The diagnosis of sarcopenia was made according to the three criteria evaluated in the definition by the European Consensus (8).
Muscular mass
This was evaluated by the calculation of skeletal muscular mass (SMM) using the prediction equation proposed by Janssen et al. (9):
SMM (kg) = [(Height2 / Resistance) × 0.401] + (Sex × 3.825) + (Age × -0.071) + 5.102
where height is measured in cm2, resistance in ohms, male = 1, female = 0, and age is measured in years.
The resistance value was obtained by a bioelectrical impedance analysis (BIA) using a Biodynamics® tetrapolar device, model 450. The technique and previous procedures were performed according to Kyle et al. (10).
From the SMM, the skeletal muscle index (SMI) was calculated as (9):
SMI = SMM / height2
Women with a SMI ≤ 6.42 kg/m2 were classified as pre-sarcopenic or with muscle deficit.
Muscle strength
This was evaluated by the maximal handgrip strength test, measured using a portable Sammons Preston Smedley hand dynamometer (Jamar, Bolingbrook IL, 60440) with a graduation scale of 0-100 kilogram/force (kg/f).
Two attempts to produce a maximal voluntary handgrip force (HS), with 1 min rest between them, were made with each hand (dominant and non-dominant side). The highest value found among the measurements was considered for the analysis. Values below 20 kg/f were considered to show a deficit in muscle strength (11).
Physical performance
This was measured by the usual gait speed (GS) in meters per second (m/s). To perform the test, each elderly woman walked a distance of four meters in a flat and straight environment with their usual gait speed. We measured the time taken to walk the course. A GS < 0.8 m/s was classified as reduced physical performance (11).
CLASSIFICATION OF SARCOPENIA
Pre-sarcopenia was classified by only a reduction in SMI, sarcopenia was classified by reduced SMI associated with reduced HS or GS, and severe sarcopenia was classified by the presence of a reduction in all three criteria (SMI, HS, and GS) (8).
DIAGNOSIS OF OBESITY BY DIFFERENT CRITERIA
Body mass index (BMI)
Women with a BMI > 28 kg/m2 were classified as obese according to the criteria described by the Pan American Health Organization (12).
Waist circumference (WC)
This was evaluated by the midpoint measurement between the iliac crest and the last rib edge. Values > 88 cm were classified as central obesity (13).
Total body fat percentage (TBF%)
This was measured by a BIA exam. A TBF% ≥ 38% was considered to indicate obesity, according to Baumgartner (14).
Tricipital skinfold (TS)
This was measured with a Lange skinfold caliper. A value ≥ 85th percentile was classified as an excess of body fat according to specific criteria for the elderly (15).
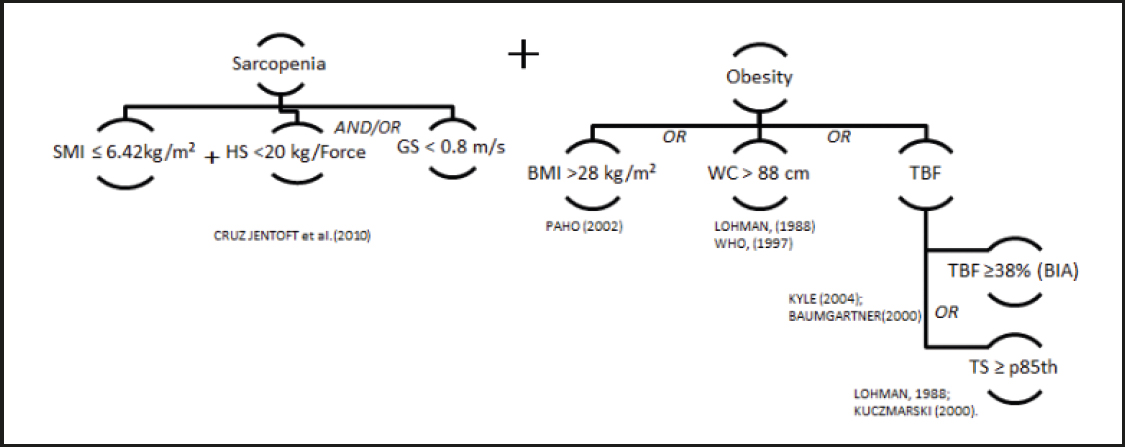
A diagnosis of sarcopenic obesity was considered as the coexistence of sarcopenia and obesity (Fig. 1). Severe sarcopenic obesity was determined when the diagnosis of obesity was obtained at the same time as the diagnosis of severe sarcopenia.
STATISTICAL ANALYSIS
To test the normal distribution of the data we used the Kolmogorov-Smirnov normality test. Quantitative data were presented as mean and standard deviation, and qualitative variables as relative frequencies. The prevalence of obesity, sarcopenia, and sarcopenic obesity was calculated. We used a chi-square test to examine differences in the prevalence of sarcopenic obesity.
All the analyses were performed using the Statistical Package for the Social Sciences ([SPSS] v.20; IBM Corporation, Armonk, NY). The significance value adopted was a p-value ≤ 0.05.
RESULTS
Of the 138 elderly women evaluated, more than half (60.1%) were between 60 and 69 years old, and the average age was 70 years.
The prevalence of sarcopenia and severe sarcopenia was 14.5% and 3.6%, respectively. Evaluating the defining criteria for sarcopenia separately revealed that 24.6% of the women had pre-sarcopenia, 10.9% had sarcopenia when evaluated by HS, and 7.2% had sarcopenia when assessed by GS.
Considering all the diagnostic criteria for obesity, 79.8% of the women were obese. The highest prevalence of obesity was found using WC (69.6%) and TBF% (Table I).
Table I. Descriptive analysis of the diagnostic criteria for sarcopenia and obesity

*p < 0.001; SMI, skeletal muscle mass; GS, usual gait speed; HS, handgrip strength; BMI, body mass index; WC, waist circumference; TBF%, total body fat percentage by BIA; TS, triceps skinfold.
Figure 2 shows a statistically significant variation in sarcopenic obesity (SO) prevalence according to the obesity diagnostic criteria used. The prevalence of SO, when considering all diagnostic criteria of obesity, was 10.9%. Analyzing the diagnostic criteria of obesity separately revealed that the highest prevalence of SO, 9.4%, was determined by the association of the diagnosis of sarcopenia with the diagnosis of obesity according to TBF%. The lowest prevalence of SO was identified when obesity was diagnosed according to BMI (0.7%). Only 2.2% of the elderly women had severe SO.

Figure 2. Prevalence of sarcopenic obesity in community-dwelling older women, determined by different diagnostic methods (SMI: skeletal muscle mass; GS: usual gait speed; HS: handgrip strength; BMI: body mass index; WC: waist circumference; TBF%: total body fat percentage by BIA; TS: triceps skinfold).
Among these obese women, 22.7% were pre-sarcopenic. The reduction in muscle strength and in physical performance of these women was 23.6% and 27.3% (p < 0.001), respectively (Fig. 3).

DISCUSSION
Sarcopenic obesity, the combination of sarcopenia and obesity, is an important public health problem that limits the human condition and human functionality, and needs to be diagnosed early and accurately. Few studies have evaluated SO according to more than one criterion as we have in the present study (3,4). This is important since the prevalence of SO depends on the definition applied and the attributes of the target population. This study presented differences in the prevalence of SO, with important variations between the diagnostic criteria. There were more elderly women with SO when the diagnosis of sarcopenia was associated with obesity as measured by TBF%, whereas the prevalence was lower when obesity was measured by BMI.
The low prevalence of SO with the use of BMI as diagnostic criterion for obesity demonstrates the limitation of this method for the reliable diagnosis of obesity. This can be due to an excess of body fat combined with a reduction in lean mass, which might result in a BMI within the normal value, thus underdiagnosing SO in the elderly. The use of BMI to evaluate the nutritional status of the elderly is wide; however, it has some limitations, such as the inability to distinguish between differences in body composition and also a lack of consensus regarding cut-off points for the elderly (16,17).
The prevalence of SO according to TS was small, even using specific reference standards for elderly evaluation. However, it is important to consider the limitations of the method in light of the physiological changes of ageing. That is why it should be combined with other indicators that also evaluate body fat (18).
When considering central obesity as a diagnostic criterion for SO in the elderly, attention should be paid to the process of reconfiguration of body fat, characterized by increased adipose tissue in the abdominal region, especially in the visceral region (18). Different criteria for the classification of central adiposity have been applied in the elderly. Some studies use the lower cut-off point (WC ≥ 80 cm), whereas others use the upper cut-off point as a reference [WC ≥ 88 cm (4) or WC ≥ 85 cm (19)]. These differences in classification strongly influence the prevalence of the problem. In our study, the average WC was 92.4 cm. If the lower cutoff point (≥ 80 cm) was used as a reference, 89.2% of the sample would have had a diagnosis of central obesity.
Another method to diagnose obesity in the elderly is the use of the TBF% obtained by BIA. Studies have shown a good correlation of BIA with BMI, TS, and WC, and also with hydrostatic weighing and DEXA, the latter two being reference methods for assessing body composition. However, BIA might present some limitations that compromise the reliability of the method and the interpretation of its results (3,10). Changes inherent to the aging process might interfere with the results, and it is necessary to use validated and tested prediction equations, as well as specific cutoff points, both for fat and fat-free mass evaluation (2,9,14). The application of BIA as a method for SO diagnosis allows the estimation of fat and lean mass, making it possible to diagnose sarcopenia and obesity at the same time (8).
This study also found differences in the prevalence of SO among different defining criteria for sarcopenia. In general, a higher number of elderly women with SO were observed when sarcopenia was defined by low SMI and HS than when sarcopenia was diagnosed by a physical performance evaluation (low SMI and GS). This could be due to the physiological changes in skeletal muscle mass during the aging process, since the loss of muscle mass initially leads to loss of muscle strength and contributes to loss of mobility and functional capacity in elderly people. For this reason, a strategy to minimize its deleterious effects on the quality of life of older adults is to identify early reduction in muscle strength and the mechanisms involved (20,21).
Among the obese women diagnosed by at least one criterion, 22.7% presented a reduced SMI, a condition that can be defined as pre-sarcopenic obesity. Changes in muscle strength and performance were also observed, although there were no changes in SMI. These data become relevant when considering the complications of obesity on muscle tissue. Shimokata et al. (21) highlighted that an excess of body fat intensifies the infiltration of adipocytes into the muscle fibers of older adults, favoring a decrease in muscle strength. In addition, the overload caused by an excess of adipose tissue might decrease the capacity to generate muscular power, thus strongly interfering with the physical performance of the elderly.
In this study, the prevalence of severe sarcopenic obesity was 2.2% and no results were found in the literature to compare these findings to.
Our results suggest the necessity for proper diagnosis of sarcopenic obesity regardless of nutritional state. Thus, it is important to identify elderly people with obesity and muscle changes, mainly with functional and muscular volume impairment (pre-sarcopenia). This will contribute to early intervention (nutritional and physical activity), therefore reducing the chances of progression to SO, since the concurrent increase in the number of elderly people and the prevalence of sarcopenic obesity could increase fragility in this population. For a better accuracy of SO diagnosis, an association of multiple indicators should be considered. Studies with larger samples also containing elderly men are necessary for an evaluation of possible differences between both sexes.

