


 Servicios personalizados
 Inglés (pdf)
 Articulo en XML
 Referencias del artículo
 Enviar articulo por email
 Citado por SciELO
  Citado por Google
  Similares en
SciELO
Similares en
SciELO  Similares en Google
 Permalink
INTRODUCTION
The accuracy and inherent measurement error in self-reported dietary assessment methods is a topic of emerging interest in nutritional epidemiology (1-3). Several dietary assessment methods are available with their own advantages and limitations (4). In general, the selection of the most appropriate method for large-scale epidemiological studies depends on the research objectives, study population, dietary data accuracy, study resources, and design (5).
Currently, food frequency questionnaires (FFQ) are the first-line dietary assessment method in nearly all epidemiologic studies, mainly due to their relatively low respondent burden and low associated costs (6). Since FFQs assess usual dietary intake, they have proven to be valid tools to evaluate the association between diet and many health-related outcomes (6). Other methods, such as 24-hour dietary recalls or food records, have been considered less useful for large observational studies because of their lower feasibility and higher costs, training requirements—interviewers and respondents—and data coding (7). In addition, the Hawthorne effect is likely to affect data collection and reporting when food records are used, and the within-person variability in 24-hour dietary recalls can be considered an important limitation concerning their validity.
In this context, validity refers to the ability of a dietary assessment method to measure data that represent the true dietary intake of an individual. Thus, a method will be considered valid if the reported dietary intake is not significantly different from real intake (8). To assess their validity, dietary assessment tools must be compared with another method (the “gold standard”) or with direct observation of meal consumption (9).
There is no universally accepted gold standard of reference to assess the validity of FFQs (10). Thus, they can be validated using biomarkers or other dietary methods, such as 24-hour dietary recalls or 3-day dietary records (DRs), which have proven highly accurate in measuring diet (11). Besides, both 24-hour dietary recalls and 3-day DRs are manageable and analyzable in large population studies (12).
On the other hand, previous research suggests that children under 8 years of age, approximately, cannot accurately recall foods, estimate portion size, or conceptualize their own intake as a result of their low literacy level, limited cognitive abilities, and difficulties in estimating size (13). To address this limitation, in pediatric studies diet is usually reported by parents, although this is also not without limitations since children’s dietary habits change rapidly, parents may share responsibility with other adults or school, or even some parents are unable to accurately describe their offspring’s diet (14).
Recent reviews have compiled several validated FFQs to assess children’s and adolescents’ dietary intakes (15,16). In Spain, preschoolers’ dietary intake has been assessed using diet quality indices, food diaries or 24-hour dietary recalls. However, validated FFQs for young children are very scarce (14,17), and very few studies have validated them using other dietary assessment method as reference.
In summary, regarding pediatric population-based epidemiological studies, the question about who is the most accurate reporter of children’s dietary intake needs further investigation. Meanwhile, it is important to determine whether FFQs are valid tools to collect information on usual diet in children. Thus, our aim was to assess the validity and reproducibility of the FFQ designed for the SENDO (SEguimiento del Niño para un Desarrollo Óptimo) project using four 3-day DRs as standard of reference.
MATERIAL AND METHODS
DESIGN AND PARTICIPANTS
The SENDO project (www.proyectosendo.es) started in 2015 following the methodology of the Growing Up Today Study, an ongoing cohort of US children and adolescents set up in 1996 by the Harvard T.H. Chan School of Public Health. SENDO is a prospective and dynamic pediatric cohort designed to assess the association of diet and lifestyles with health-related outcomes in Spanish children and adolescents. This validation study was carried out with children in the pilot study of the SENDO project (recruited in 2015) with these inclusion criteria: age: 4-7 years at recruitment, and residence: Navarra (Spain). There were no exclusion criteria. The study was conducted according to the guidelines laid down in the Declaration of Helsinki, and all procedures involving human subjects were approved by the ethical committee for clinical research, Government of Navarra (Pyto2016/122). A written informed consent was obtained from all parents before study initiation.
Children were invited to participate in the study by their pediatrician. From a total of 304 preschoolers who were invited to participate in the pilot study, 170 children (55.9 %) entered the study. In order to evaluate the reproducibility of the FFQ2 we analyzed the responses of 79 participants whose parents completed the FFQ twice—at baseline (FFQ-0) and after 1 year of follow-up (FFQ-1). For assessing the validity of the FFQ we analyzed data from 45 participants who additionally filled in four 3-day DRs (one per year season), and compared the information in the DRs with the information in the FFQ-1. In order to minimize misreporting, participants who reported energy intakes below percentile 5th or above percentile 95th (18) were excluded. Therefore, the final sample size for the assessment of reproducibility and validity comprised 67 and 37 participants, respectively.
DATA COLLECTION
At baseline, parents or legal tutors completed a paper-based self-administered questionnaire, which gathered information about socio-demographic background, medical records, family history, dietary habits, and lifestyle variables, including weight and height. Previous studies have concluded that reported anthropometrical data are a viable alternative when direct measurements are not available (19). Body mass index (BMI) was calculated as weight (in kilograms) divided by squared height (in meters) to classify participants according to their nutritional status using the International Obesity Task Force (IOTF) standard of reference (20), which includes sex- and age-specific BMI cut-off points for normal weight, overweight, and obesity. We chose the IOTF as standard of reference to facilitate comparison with international studies (21). BMI-related sex- and age- specific z-scores were calculated using the LMS method (20).
Physical activity was recorded with a questionnaire that included 14 activities, including sports, and 9 categories of response from “never” to “more than 11 hours/week”. METs-h/week for each activity were calculated by multiplying the number of Metabolic Equivalents of Task (METs) for each activity by weekly participation, weighted according to the number of months dedicated to that activity. Total physical activity was quantified by summing the METs-h/week dedicated to all activities performed during leisure time.
Participants’ and mothers’ ages were calculated as the difference between their birthdate and the date when the questionnaire was completed. We gathered the maternal and paternal highest academic degrees, and defined high education as having a university, master, or doctor degree.
DIETARY ASSESSMENT
Food frequency questionnaire
We developed an ad-hoc semi-quantitative 138-item FFQ for the SENDO project. For each food item, the standard portion size was specified and parents or legal tutors had to indicate how often, on average, the participant had consumed the specified amount during the previous year by choosing one of the 9 possible categories of response (“Never/almost never”, “1-3 times a month”, “1 time a week”, “2-4 times a week”, “5-6 times a week”, “1 time per day”, “2-3 times per day”, “4-6 times per day” and “more than 6 times per day”).
This FFQ was based in a previously validated FFQ for the Spanish adult population (22), but some modifications were made to include foods typically consumed by children, and to adapt portion sizes based on other pediatric cohort studies (23) and the Spanish dietary guidelines. We did not include any pictures in the FFQ.
At baseline, participants received the FFQ-0 with detailed instructions to complete it correctly. One year later, the participants received the FFQ-1 so we could assess its reproducibility (Fig. 1).

3-day dietary record
During the one-year follow up participants received one 3-day DR every 3 months, with their respective instructions to fill it out correctly. Each DR covered 3 days, including two weekdays and one day during the weekend (either Saturday or Sunday).
Participant’s parents or tutors were asked to provide detailed information about all foods and beverages consumed by the participant, using either home-made measurements, portion sizes or weights. In order to improve the reliability of the records, we provided participants with an electronic scale they could use to weigh the consumed foods and beverages. In addition, parents or tutors registered the time and location of each meal, the food preparation method, including used ingredients and fat type, as well as food brand.
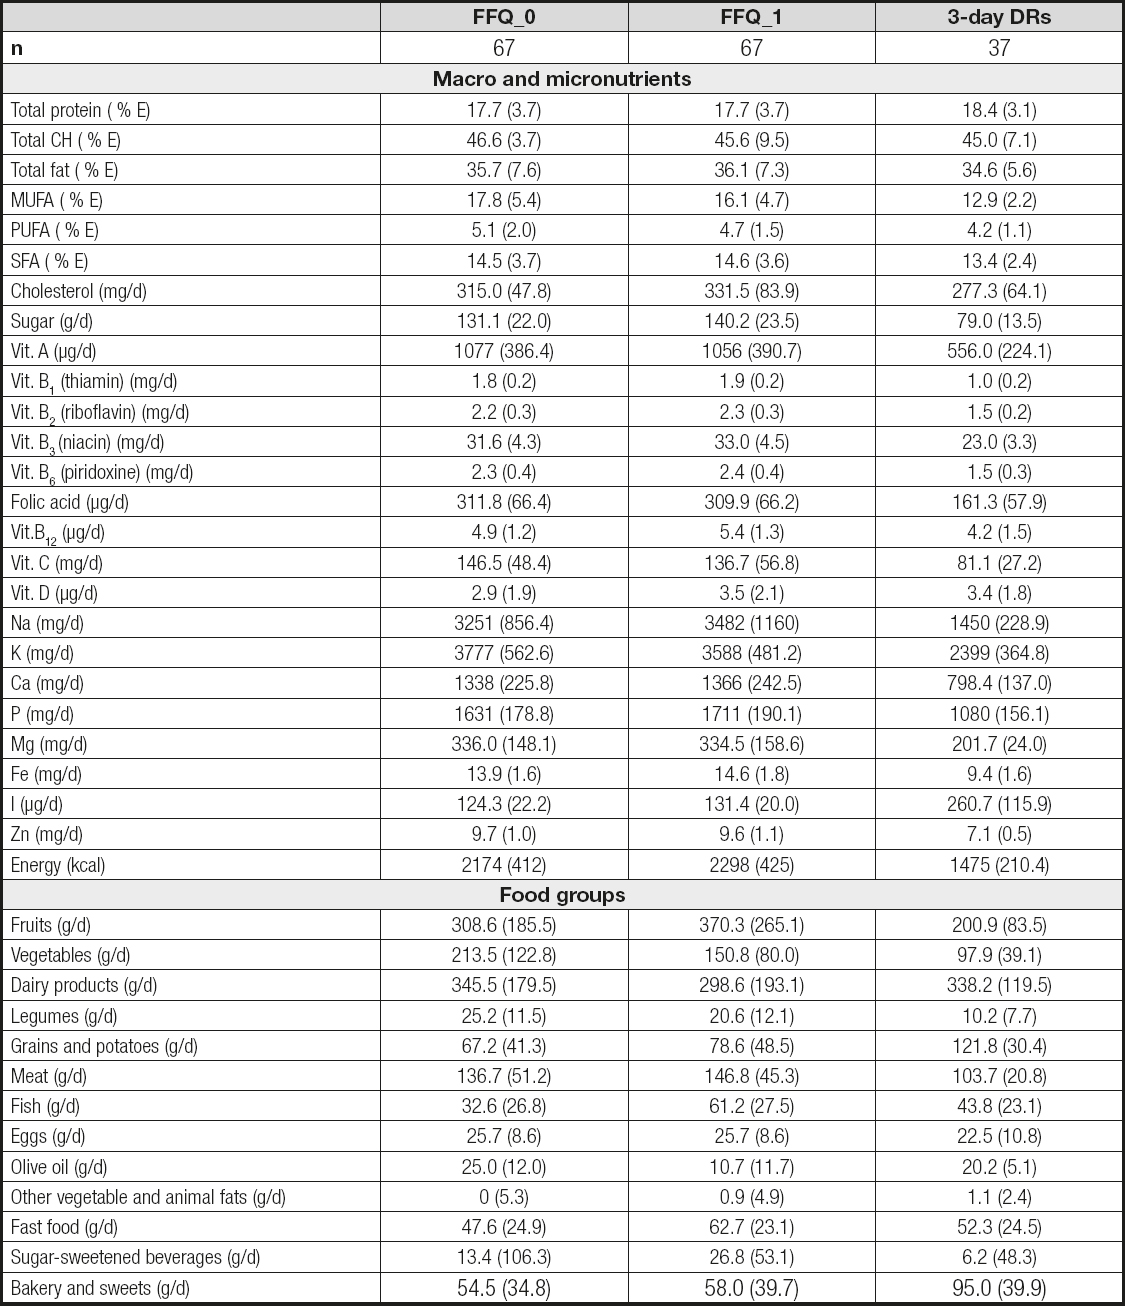
Foods were classified into the following groups: fruits, vegetables, dairy products, legumes, grains and potatoes, meat, fish, eggs, olive oil, other vegetable and animal fats, fast-food, sugar-sweetened beverages, and bakery and sweets (Table I).

A trained team of dietitians derived nutrient content from each food item, which was calculated by multiplying intake frequency by the edible portion and the nutrient composition of the specified portion size. We used data from updated Spanish food composition tables (24) and from online databases (25,26) to calculate total energy and nutrient intake, obtained by summing up the contribution of each food item included in both the FFQ and the 3-day DRs.
STATISTICAL ANALYSIS
The results are presented as frequencies and percentages for categorical variables, and as means and standard deviations (SD) for quantitative variables. Variables that did not follow a normal distribution (based on the results of the Shapiro-Wilk test of normality) were log-transformed (log10). All food groups and nutrients were adjusted for total energy intake using the residual method, with total caloric intake as the independent variable and the correspondent nutrient as the dependent variable.
To assess the reproducibility or validity of the FFQ, we compared data from FFQ-0 with data from FFQ-1, and data from FFQ-1 with the mean intakes of the four 3-days DRs, respectively. We chose FFQ-1 rather than FFQ-0 because the former covered the intakes during the previous year, when the four 3-days DRs were collected.
The correlations of all food groups and nutrients were calculated with unadjusted and energy-adjusted Pearson’s correlation coefficients (r). To correct for the season-to-season variations in dietary intake observed in the DRs, we also calculated deattenuated Pearson’s correlation coefficients (deattenuated r).
To better describe the agreement between the corresponding dietary assessment tools, we used the Bland-Altman method, which consists of calculating the mean of the differences observed between the two dietary assessment tools and its 95 % confidence interval. The Bland-Altman index (%) represents the percentage of the differences that fall beyond these limits. On the other hand, to better describe agreement across categories of consumption, we classified participants into quintiles of food consumption and nutrient intake according to the information obtained from: 1) FFQ-1, and 2) mean of the four 3-day DRs, and used contingency tables to cross-tabulate quintile distribution and compare both classifications. We first calculated the weighted kappa index. Secondly, we estimated the percentage of agreement or gross classification in two dietary assessment methods as the percentage of participants categorized into the same/adjacent or opposite quintiles, respectively.
All tests were conducted with the statistical program STATA 12.1. All analyses were two-tailed, and the statistical significance cut-off point was set a priory at a p value of 0.05.
RESULTS
The baseline characteristics of the participants are shown in table II. Out of the 79 participants, 12 were excluded because they reported an energy intake outside of the predefined limits, thus the final sample consisted of 67 participants, most of them girls (55.2 % in the FFQs and 62.2 % in the 3-day DRs), with a mean age of 5 to 6 years. Among these participants, 37 completed the four 3-day DRs. Their mothers, middle aged and mostly highly educated women, were the most common respondents in both the baseline questionnaire and the 3-day DRs. Mean energy intake was higher among boys as compared with girls in both the group where we assessed reproducibility (2,274 kcal [SD: 475] vs. 2093 kcal [SD: 338], p = 0.07) and in the group where we assessed validity (1,610 kcal [SD: 253] vs. 1,435 kcal [SD:162], p = 0.01). Similarly, physical activity was also higher among boys when compared with girls in both the group where we assessed reproducibility (47.96 METs-h/week [SD: 34.94] vs. 26.98 METs-h/week [SD: 17.42], p = 0.002) and in the group where we assessed validity (50.63 METs-h/week [SD: 36.85] vs. 24.34 METs-h/week [SD: 12.67] p = 0.003).
Table II. Baseline characteristics of participants in the pilot study of the SENDO Project 2015-2016 after excluding subjects who reported energy intakes above percentile 95th or below percentile 5th. Numbers are means (standard deviations) or percentages

Daily intakes of each food group, as well as macro and micronutrients are shown in table III. The FFQ-0 and the FFQ-1 tended to report a higher food consumption, and higher energy and nutrient intakes when compared to the 3-day DRs.
Table III. Daily consumption of food groups and nutrients estimated according the food frequency questionnaire 0 (FFQ-0), food frequency questionnaire 1 (FFQ-1) and four 3-day dietary records (3-day DRs) in the pilot study of the SENDO Project. Numbers are means (standard deviations) unless otherwise stated
Weighted kappa index for the agreement (FFQ-1 and the mean of four 3-day DRs) across quintiles of dietary variables, as well as the percentage of participants misclassified (in opposite quintiles), are shown in table IV. The average weighted kappa index was 69 % for nutrients and 68 % for food groups. Regarding gross misclassification, it ranged from 0 to 10.8 % for nutrients and from 0 to 8.1 % for food groups.
Table IV. Percentage of participants in opposite quintiles in the food frequency questionnaire 1 (FFQ-1) and 3-day dietary records (3-day DRs) for nutrients and food groups, and weighted kappa index for agreement across quintiles in the pilot study of the SENDO Project, 2015-2016

Figure 2 shows the percentage of agreement (i.e., participants classified in the same or adjacent quintile using the FFQ-1 and the mean of the four 3-day DRs). Substantial agreement was found for total carbohydrates (70.3 %), sugar (75.7 %) and dairy products (78.4 %), while an almost perfect agreement was found for calcium (81.1 %), phosphorus (83.8 %), iodine (83.8 %) and grains and potatoes (81.1 %).

Figure 2. Percentage of participants in the same or adjacent quintile in the food frequency questionnaire 1 (FFQ-1) and 3-day dietary records (3-day DRs) for nutrients and food groups in the pilot study of the SENDO project, 2015-2016. A. Macronutrients. B. Micronutrients. C. Food groups.
Regarding reproducibility, we found that all nutrients—except vitamin A, vitamin B12 and vitamin C—were significantly correlated in the FFQ-0 and FFQ-1, with a significant energy-adjusted Pearson’s r ranging from 0.29 (95 % confidence interval [CI]: 0.02-0.57) for cholesterol, to 0.71 (95 % CI: 0.30-1.12) for magnesium (mean energy-adjusted r for nutrients = 0.41, SD = 0.13) (Table V). Regarding food groups, we found significant correlations for all of them except for vegetables. The significant adjusted Pearson’s r ranged from 0.27 (95 % CI: 0.10-0.44) for fast food to 0.74 (95 % CI 0.54-0.93) for other vegetable and animal fats (mean energy-adjusted r = 0.41, SD = 0.16). The Bland-Altman index, which indicates the percentage of the observed differences between two methods of measurement that fall beyond the 95 % limits of agreement, ranged from 0 % to 10.45 % for nutrients and from 1.49 % to 10.45 % for food groups, showing a good agreement overall.
Table V. Reproducibility of the FFQ: Pearson’s correlation coefficients (r) and Bland-Altman index (%) between the food frequency questionnaire 0 (FFQ-0) and the food frequency questionnaire 1 (FFQ-1) for nutrients and food groups in the pilot study of the SENDO Project, 2015-2016

*p < 0.001; †p < 0.05; ‡Percentage of subjects with values out of limits of agreement.
The results of the validity analyses are shown in table VI. We found significant correlations for energy, macronutrient and several micronutrients, with a significant adjusted Pearson’s r ranging from 0.33 (95 % CI: 0.09-0.58) for protein to 0.77 (95 % CI: 0.65-0.89) for iron (mean energy-adjusted r = 0.36, SD = 0.20). Regarding food groups, we found significant correlations for dairy products, grains and potatoes, fish, and sweets, with a significant energy-adjusted Pearson’s r ranging from 0.42 (95 % CI: 0.21-0.63) for sweets to 0.59 (95 % CI: 0.40-0.77) for grains and potatoes (mean energy-adjusted r = 0.31, SD = 0.17). Overall, the Pearson’s deattenuated r showed slightly stronger correlations. Finally, the Bland-Altman index for nutrients ranged from 0 % to 16.22 % and from 0 % to 10.81 % for food groups.
Table VI. Validity of the food frequency questionnaire: Pearson’s correlation coefficients (r) and Bland-Altman index (%) between the food frequency questionnaire 1 (FFQ-1) and 3-day dietary records (3-day DRs) for nutrients and food groups in the pilot study of the SENDO Project, 2015-2016

*p < 0.001; †p < 0.05; ‡Percentage of subjects with values out of limits of agreement.
DISCUSSION
To our knowledge, the FFQ used in this study is the first large and semi-quantitative FFQ validated for Spanish pre-schoolers using four 3-day DRs as standard of reference. Reproducibility was tested by comparing the information gathered through the FFQ, which was administered twice, at baseline and after one year of follow-up. Validity was assessed by comparing the FFQ itself with a total of twelve DRs, one 3-day DR every three months, which allowed us to capture season-to-season variability. Overall, our results showed that the FFQ of the SENDO project is a valid tool to assess the dietary intake of nutrients and foods of Spanish preschoolers.
Regarding reproducibility, we found Bland-Altman indexes from 0 to 10.45 % for nutrients, and from 1.49 % to 10.45 % for food groups. The significant energy-adjusted r ranged from 0.29 to 0.71, and from 0.27 to 0.74 for nutrients and food groups, respectively. Regarding validity, we found Bland-Altman indexes from 0.81 % to 16.22 % and from 0 to 10.81 % for nutrients and for food groups, respectively. The significant deattenuated r ranged from 0.38 to 0.81 for nutrients and from 0.53 to 0.68 for food groups. The weighted kappa index for agreement across quintiles ranged from 54.1 to 85.1 for nutrients and from 55.4 to 78.4 for food groups. Mean percentage of participants’ gross misclassification —in opposite quintiles— was 1.7 % and 1.9 % for nutrients and food groups, respectively.
Questionnaires have been recommended to be developed and validated specifically for the populations that they are intended to be used for, in order to produce valid and reliable data (6). Worldwide, FFQs have been validated in many adult populations for the last 20 years. However, evidence from large-scale epidemiological studies and nutrition surveys is scarce among preschoolers (27-30). In our study, the estimations of energy and nutrient intakes were similar to the ones reported in previous studies (31-33), with small differences attributable to the participants’ age range, study design, or the use of different statistical approaches (29). Mean daily intakes for most nutrients and foods were higher in the FFQ-1 than in the FFQ-0. Nevertheless, because differences were small, it can be concluded that participants did not significantly change their diet during the follow-up period. However, the reported mean energy was 33 % higher in the FFQs than in the four 3-day DRs, which might be due to different reasons. First, the large number of food items included in the FFQ may lead to an overestimation of dietary intake. Second, we used a semi-quantitative FFQ (i.e., the standard portion size for each item was specified), and differences with DRs in which participants reported weighed portions have been reported previously (21). From an epidemiological perspective, self-reported information on dietary intake should be used to rank participants since, as we also observed in this study, despite potential overestimation, misclassification across quintiles is very unlikely (3,34). Third, the difficulties of the 3-day DRs to capture those products consumed in smaller amounts, such as legumes, fish or sugar-sweetened beverages, could have interfered as well, as it has been reported by previous studies in adult and pediatric populations (22,35-39). Overestimation in dietary intake is frequent when a FFQ designed for adults is used in pediatric populations (22), but it is less common when the FFQ is designed ad-hoc, as it was in our study. Finally, the observed difference can also be attributed, at least partially, to a certain Hawthorne effect.
Our results showed a reasonable to good validity of the FFQ compared with the mean of the four 3-day DRs. Overall, most of the participants were correctly classified into the categories of food consumption and nutrient intake, and misclassification across quintiles was very unlikely. Consistent with previous studies (17,28,35), our results emphasize that the FFQ is a valid and useful tool to rank pediatric populations according to dietary variables.
Correlation coefficients above 0.7 are usually assumed to indicate a strong association, those between 0.3 and 0.7 are interpreted as a moderate association, and coefficients below 0.3 indicate weak associations. In general, we found moderate correlations, with a mean energy-adjusted Pearson’s r of 0.31 for food groups and 0.36 for nutrients. These results, usual in validation studies, are sufficient to detect hypothesized associations between diet and health-related outcomes (40). As expected, energy-adjusted correlations were found to be stronger, probably because the inter-subject variability in intakes is highly associated with total energy intake (39,41,42). The deattenuation of Pearson’s r resulted in stronger associations as well, since it accounts for the season-to-season within-subject variability observed in the four 3-day DRs. Day-to-day variability could be minimized using a higher number of DRs, but their use is not without limitations. In this study we used four 3-day DRs over a year, which could have affected the accuracy of recorded data due to increasing boredom, potential alterations of dietary habits, and drop-outs (13).
Weak to strong correlations between the FFQs were observed when assessing reproducibility, with a wider range in correlation coefficients. Among nutrients, the significant energy-adjusted r ranged from 0.29 for cholesterol to 0.71 for magnesium. Among food groups, the significant energy-adjusted r ranged from 0.27 for fast food to 0.74 for other vegetable and animal fats. These results are in agreement with those reported by previous studies (17,25,43), but are discrepant with other studies, probably due to differences in protocols (sample size, type of FFQ, foods and nutrients evaluated), population, and between-subject variability.
Regarding reproducibility, we found weak correlations for vitamin A, vitamin B12, vitamin C, and vegetables, and regarding validity, the lowest correlations were found for vitamin A, vitamin D, Na, Mg, meat, eggs, other vegetable and animal fats, fast food, and sugar-sweetened beverages. We acknowledge that the validity of the FFQs to assess the intake of these items is limited, and thus their results should be interpreted with caution, even more so considering that these correlations were not statistically significant. Nevertheless, similar results have previously been reported in pediatric populations (37), perhaps because of broad response categories in FFQs. We partially addressed this potential limitation using the means of the four 3-day DRs (instead of one single 3-day DR), which is suggested to increase agreement between methods. Another explanation is that the FFQ that we used was long and thorough, while studies that used simple and short (less than 100 food items) FFQs reported better results. More surprising is the inverse correlation for PUFA that was observed in the validation analysis. Nevertheless, the Bland-Altman index, which is the recommended method to assess agreement, resulted in 0 %, meaning none of the observed differences fell beyond the limits defined by the 95 % confidence interval.
Our study has several strengths. First, we used both direct (cross-classification) and indirect (calculated nutrient intakes) measures to assess the validity of the FFQ. The fact that we used a semi-quantitative FFQ, in which portion size was defined, may have facilitated agreement between both methods. Second, we used weighted 3-day DRs as the gold standard of reference for the validation study. DRs have been suggested to be the most accurate and feasible method to evaluate dietary intake, especially when quantities are primarily based on weighed portions. Third, the DRs were collected along one year of follow-up, which allowed us capture the season-to-season variability in dietary intake. Four, in order to minimize measurement errors, participant families received written instructions about how to complete the 3-day DRs, and we gave them an electronic scales to weigh the consumed foods and beverages. Finally, the correlation coefficients were deattenuated to account for the within-subject variability in the reported data.
Nevertheless, the present study has some potential limitations. Since we opted for a complete case analysis, we only considered participants who completed the two FFQs (for the reproducibility study) and those who completed the four 3-day DRs and the FFQ-1 (for the validity analysis). Thus, from 170 participants in the pilot study, 91 (53 %) were excluded due to missing data in either one of the FFQs or at least in one of the 3-day DRs. We acknowledge that sample size is below the recommendations, but previous validation studies with less than 100 participants have also been reported (15). Besides, we tried to compensate it by an exhaustive collection of information; we gathered one 3-day DR for annual season (12 DRs per participant), in contrast with studies that had larger sample sizes but only collected one 3-day DR and thus did not account for season-to-season variability (15). The included and not included families could be different regarding lifestyle and dietary habits, or even might have provided different information in terms of accuracy, but these questions cannot be fully addressed with our available data. Nevertheless, there is no evidence that our findings cannot be generalizable. Second, self-reported dietary assessment methods that required high involvement from participants (such as DRs) may result in some inaccuracies, due to the difficulty associated with the method itself, or with some changes in participant’s dietary habits. Third, the FFQs used were self-administered. Despite the potential bias, including an overestimation of dietary intake as we have already discussed, the information provided by self-reported dietary assessment methods has been proven to be useful enough to be used in epidemiological studies (3,6,34).
Fourth, the sequence of the dietary assessment tools may be problematic, since the completion of one method first might affect the performance on the second one. Although this process itself could influence dietary habits, it is implausible that completing the FFQ-0, a 10- to 15-minute section embedded in a general questionnaire, could have appreciably affected the diet during the subsequent year. Fifth, parents may not be fully aware of all food items, as well as their portion sizes, consumed by their children (e.g., food consumed at school). Moreover, they may report an ideal diet, overestimating the “healthy foods” and underestimating the “unhealthy” items. Sixth, the use of large periods of follow-up in studies with preschoolers is inadvisable as their dietary intake may rapidly change, increasing the risk of poor questionnaire performance in validity and reproducibility studies. Our results showed that dietary intake did not change significantly during follow-up. Moreover, the one-year follow-up allowed to assess the usual diet and to collect season-to-season variations. Finally, we acknowledge that using biomarkers would have added certainty to our results.
Since there is no standard FFQ, each questionnaire should be judged for its ability to provide the information for which it was intended. This 138-item self-administered, semi-quantitative FFQ appeared to be a valid and useful tool to assess food consumption and nutrient intake among Spanish preschoolers. We found acceptable levels of both reproducibility and validity, although a standardization of FFQ studies should be warranted so that comparisons across publications can be more readily made. In conclusion, despite its limitations, the FFQ developed for the SENDO project may be a valid tool to collect self-reported dietary information, and to be used in epidemiological research.

