


 Serviços customizados
 Inglês (pdf)
 Artigo em XML
 Referências do artigo
 Enviar este artigo por email
 Citado por SciELO
  Citado por Google
  Similares em
SciELO
Similares em
SciELO  Similares em Google
 Permalink
INTRODUCTION
Physical growth studies continue to emphasize the importance of descriptions of growth for diverse human populations (1). Then, to understand variations in growth and human development has been a long-time primary objective of human biology and public health studies (2). In fact, the sensitivity of human growth to the environment is demonstrated both by the processes of stunting and wasting in response to poor nutrition (3), and of catch-up growth during environmental improvements following episodes of stress (4).
Currently, on a global scale, international references, such as those from the Centers for Disease Control and Prevention or CDC (5,6) and the World Health Organization or WHO (7) are used to study physical growth and the nutritional status of children and adolescents. Frequently, these references are based on anthropometric indicators like weight for age (WFA), BMC, and height for age (HFA). These indicators are used to assess underweight, wasting, and delay in growth of children older than five years of age (7).
In that sense, a number of recent studies have verified that the international references (5-7) are not applicable for clinical evaluation of growth in different world populations (8-10). This is specifically true for populations in South America living at a moderate altitude (11).
These observed differences may not be appropriate for describing the physical growth patterns and nutritional state of children and adolescents at a moderate altitude. Therefore, it is necessary to develop an international growth reference for this pediatric population. Based on what is known, the original proposal designed by the World Health Organization included children born below 1500 meters above sea level (12). Furthermore, the American CDC references (5,6) do not take into account altitude as a factor to adjust for in their reports.
Therefore, an international reference for children and adolescents living at a moderate altitude is necessary. This information could help describe growth patterns associated with the greatest health benefits. In addition, these standards could be used to take into account health risks associated with plasticity processes of development in pediatric populations living at a moderate altitude.
Furthermore, it is worth noting that in some recent studies carried out with children living at a moderate altitude demonstrated that BMI has limited use for this type of population (13). Thus, during adolescence, body weight is not proportional to height squared (14), nor does it completely allow correcting for height in children. Consequently, this may lead to confusion regarding differences in growth (15).
As a result, the authors of this research study hypothesize that children and adolescents living at a moderate altitude in Peru (2,320 meters) and Colombia (2,640 meters) could differ in weight, height, and BMI in relation to the American reference of the CDC-2012. In addition, we propose that the ponderal index (PI = W/H3) could be used as a fundamental tool to adjust differences in height. Moreover, it could be more applicable in classifying the weight status of children with regard to BMI.
Thus, the objectives of this study included the following: a) to compare weight, height, and BMI variables with the American references of the CDC-2012; b) to verify if BMI and/or PI is applicable to children and adolescents living at a moderate altitude; and c) to propose percentiles to assess the physical growth of children and adolescents by age and sex.
Methods
STUDY DESIGN AND SAMPLE SIZE
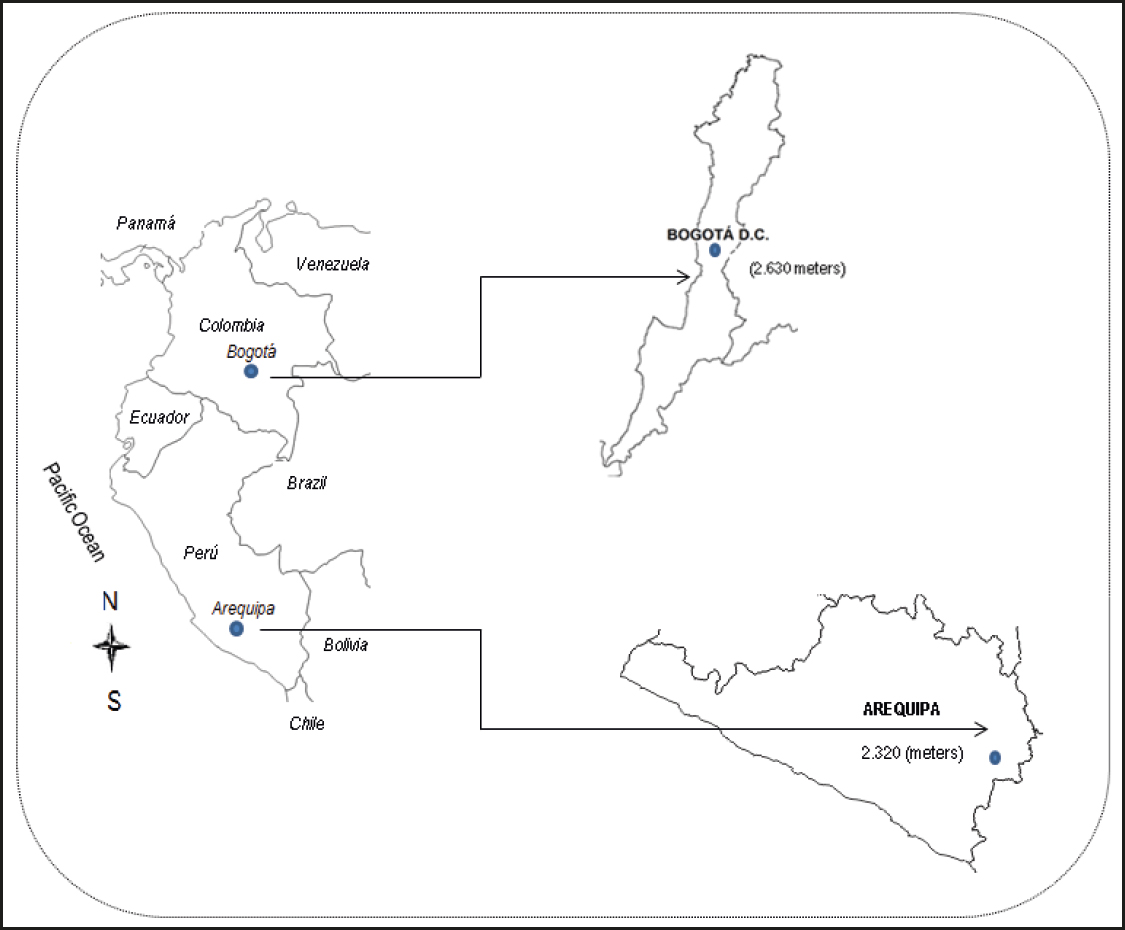
A descriptive, cross-sectional study was carried out with 5,377 students (2,856 males and 2,522 females). Students living in two cities at a moderate altitude were recruited from public educational institutions in Colombia (Bogotá, at 2,640 meters above sea level) and Perú (Arequipa, at 2,320 meters above sea level). In both cities, subjects were selected by non-probabilistic sampling from 2013 to 2016. In general, in these countries and cities, students attending these types of public schools are middle-class. In addition, similarities exist in geography and climate between the two cities. For example, in Arequipa, relative humidity varied between 46 and 70 % and temperatures between 10 to 25 °C (16). In Bogotá, during the year, temperatures oscillated between 12 and 15 °C, and relative humidity varied between 73 and 86 % (17).
During 2013, for Colombia, the Human Development Index (HDI) was 0.711 and for Bogotá 0.911. In Peru, the HDI was 0.741 and in Arequipa 0.745 (18). In both cases, the HDI reached its maximum growth at the country and city levels, respectively. Figure 1 illustrates the geographic locations of both cities in South America.
With regard to the sample for this study, students excluded were those displaying physical disabilities that could impede anthropometric assessment, and those not giving their informed consent as authorized by parents or guardians. Students included in the research were those with an informed consent from their parents or guardians, and a consent from the students themselves, and those who completed the anthropometric assessments. The study received permission from the respective school administrators. Furthermore, the research project was developed based on the Helsinki Declaration, Resolution 8430, and the Ministry of Health and Social Protection of Colombia, and received an ethical approval from the Ethics Committee at Universidad Nacional de San Agustín de Arequipa, Peru.
PROCEDURES
The data collection procedures were carried out in two stages. First, the schools were identified in order to request permission to conduct the study. Second, a space was created in each school where the anthropometric variables could be assessed. These spaces were distributed amongst the researchers collecting the data based on their schedules and their availability.
Assessments were carried out at the specified locations in the involved schools. All procedures were performed by 16 physical education teachers (8 teachers in Bogotá and 8 in Arequipa). All of the teachers had extensive experience in anthropometric measurements, and they had undergone previous training by the International Society for the Advancement of Kinanthropometry (ISAK). The technical error of measurement (TEM) for intra- and inter-observer measurements for all variables ranged between 0.82 and 1.5 %.
The variables of weight and height were measured with students wearing minimal clothing (barefoot, shorts and shirt). Body weight (kg) was measured using an electronic scale (Tanita Ltd., United Kingdom) with a scale of 0 to 150 kg and an accuracy of 100 g. Height was measured with a portable stadiometer (Seca Gmbh & Co. KG, Hamburg, Germany) with a precision of 0.1 mm. Body mass index (BMI) was calculated with the formula: BMI = weight (kg) / height2 (m), and the ponderal index (PI) was calculated with the formula: PI = weight (kg) / height3 (m). Ages were arranged in intervals of 10 years: 6.0 to 6.9 years, 7.0 to 7.9 years, and so on up to 17.0 to 17.9 years.
The American Centers for Disease Control and Prevention CDC-2012 was used as the reference to classify the status of weight by age and sex into low weight, normal weight, overweight, and obesity. As well, this reference was also used to compare the average values of weight, height, and BMI by sex (5). The elevated values of BMI and PI (≥ p85) were interpreted as excessive weight based on age and sex.
STATISTICAL ANALYSIS
The Kolmogorov-Smirnov (K-S) test was carried out in order to establish the normal distribution for all of the anthropometric variables. Descriptive statistics of the arithmetic mean were calculated — standard deviation, frequency, percentage, and range. The differences between both sexes were verified by means of the t-test for independent samples. A Chi-squared analysis was conducted to verify differences between nutritional categories (BMI and PI). Pearson's coefficient was used to evaluate the relationship between variables. A simple linear regression was calculated between age, weight, and height as independent variables, and BMI and PI as dependent variables (adjusted R2, standard error of estimation – SEE). Percentile curves (p3, p5, p10, p25, p50, p75, p85, p90, p95, and p97) were created using the LMS Method (Cole et al., 2000). The adjusted LMS Method was based on three smoothed curves: L(t) Box-Cox Power, M(t) median, and S(t) coefficient of variation. The LMS Chart Maker, version 2.3, software was used (19). The statistical calculations were carried out with Excel spreadsheets and SPSS 16.0. The level of significance adopted was 0.05.
RESULTS
The anthropometric variables of weight, height, BMI, and PI of both sexes are showed in table I. Males showed greater weight at 10 and 12 years of age, and from ages 14 to 17 years when compared to females. With regard to height, males were taller than their female counterparts at ages 10, 13-14, and 17 years. For PI and BMI, differences only occurred at 17 years, where males showed greater height values (p < 0.05). For the remaining variables and ages, no significant differences occurred (p > 0.05).
Table I. Anthropometric characteristics of the sample studied

*p < 0.05. BMI: body mass index; IP: ponderal index; X: mean; SD: standard deviation; n: sample.
The comparison of growth (weight and height) and BMI variables with the CDC-2012 references are illustrated in figure 2. Males living at a moderate altitude showed less weight and height commencing at age 11 until 17.9 years in relation to the CDC-2012 (p < 0.05). However, at early ages, from 6.0 until 10.9, no significant differences emerged. With regard to BMI, the patterns were similar from age 6.0 to 14.9 years, while from age 15.0 to 17.9 years adolescents living at a moderate altitude scored significantly less than the reference.

Figure 2. Comparative values (mean ± SD) for weight, height, and BMI for the students living at a moderate altitude, with the CDC-2012 references.
For the girls, no differences occurred in weight during the early ages (6.7 to 8 years). However, commencing at 9.0 years of age until 17.9 years, females living at a moderate altitude weighed less than the reference. With regard to height, the values were significantly less than the reference commencing at age 6.0 to 14.9 years. However, for the three later years (ages 15-17), the values were similar to those in the CDC-212. For BMI, differences appeared at ages 12.0 to 17.9 years. These BMI values were lower when compared to the references (p < 005).
A simple linear regression was carried out (Table II). The analysis demonstrated that age, weight, and height explained the BMI as between 17 % to 83 % in males, and in females as between 24 to 85 %. However, these same variables influenced PI at a lower percentage in both sexes; for example, in males (R2 = 0.01 to 49 %) and in females (R2 = 0.01 to 18 %). In general, the simple linear regression analysis demonstrated that age, weight, and height had a greater influence on BMI than on PI.
Table II. Simple linear regression and standard error of estimation (SEE) between age, weight, and height as independent variables with BMI and PI as dependent variables
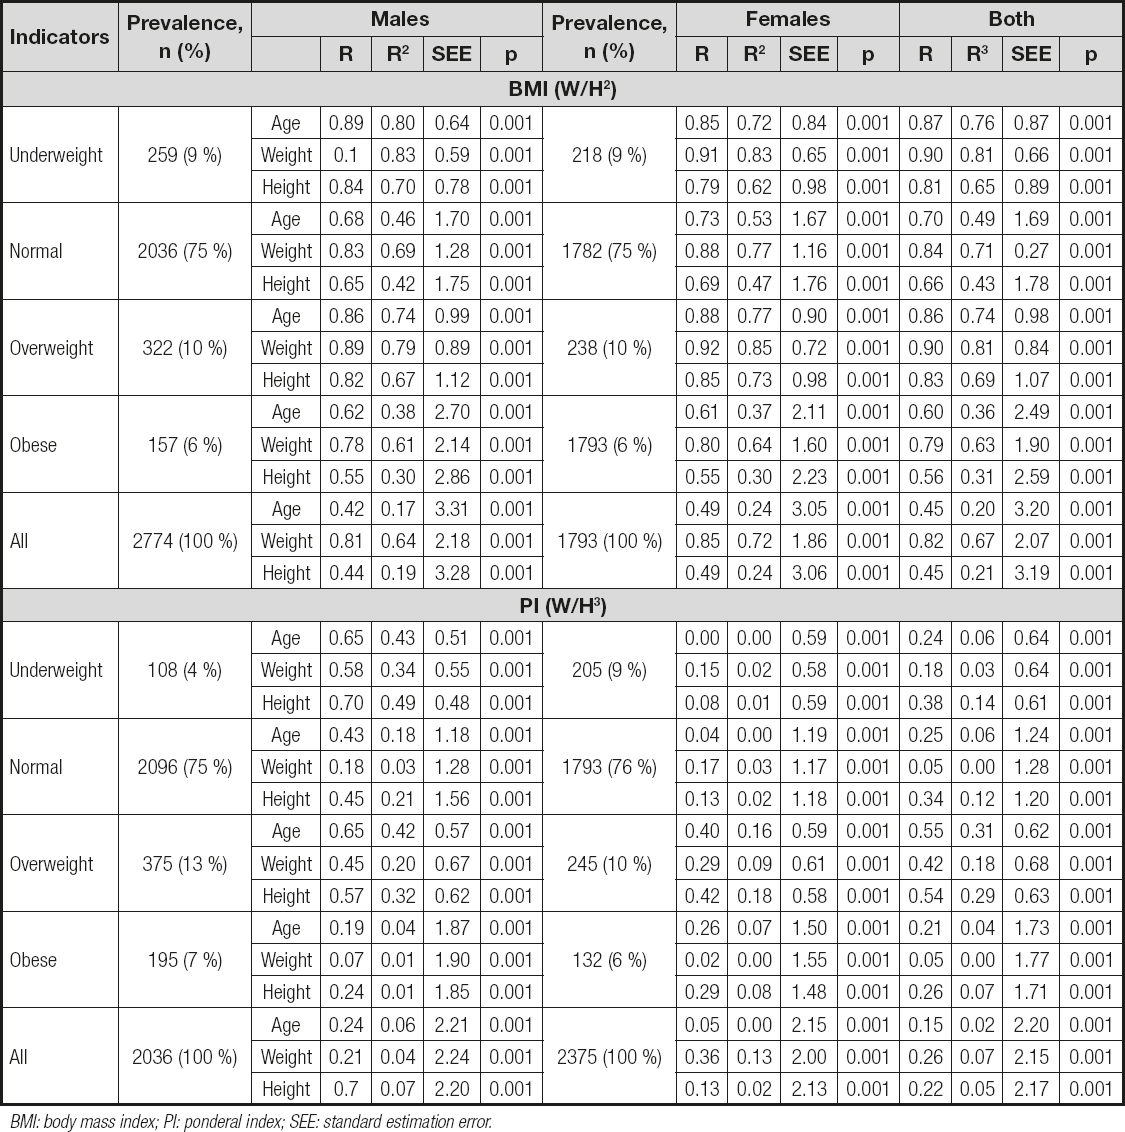
BMI: body mass index; PI: ponderal index; SEE: standard estimation error.
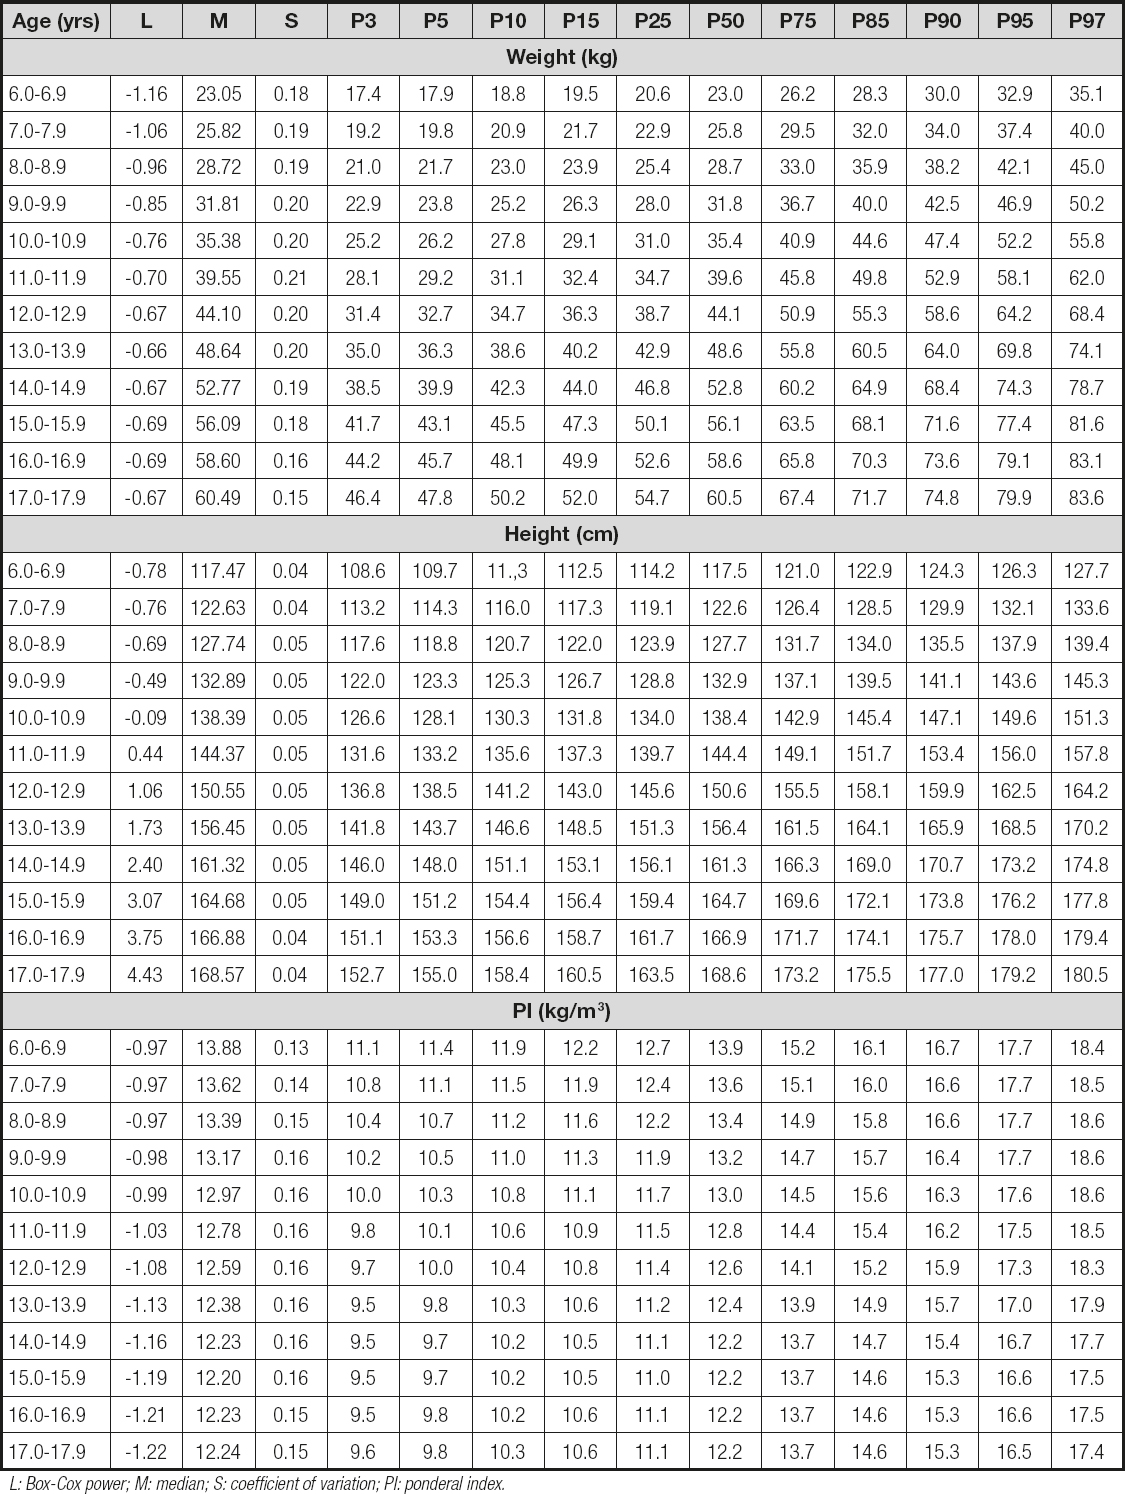
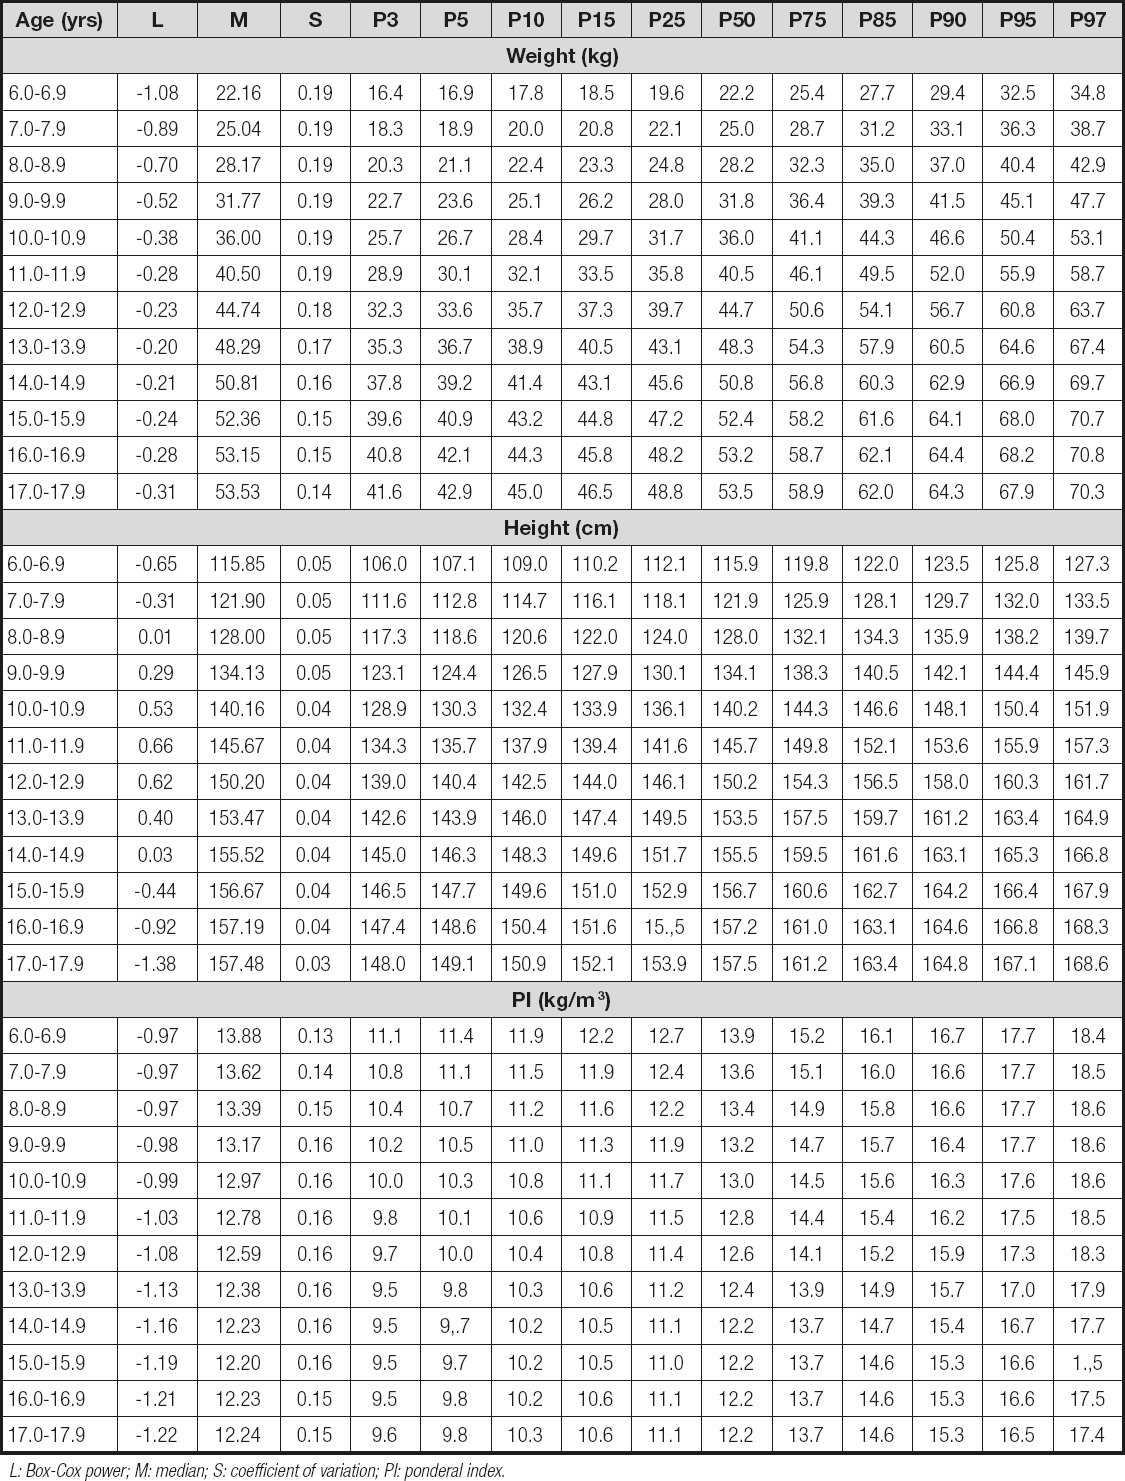
Tables III and IV show the percentiles (p3, p5, p10, p15, p25, p50, p75, p85, p90, p95, and p97) for weight, height, and PI for age and sex. In both cases, the values for weight and height increased as age advanced, and PI values decreased slightly as age increased.
DISCUSSION
With regard to the first objective of this study, the results showed clear differences in physical growth patterns and the BMI in comparison with the American CDC-2012 references.
The males living at a moderate altitude reached the averages of the reference during childhood. However, during adolescence, the physical growth patterns and BMI showed decreased values. Of note, though, is that the females living at a moderate altitude reached the mean height values of the CDC-2012 during the last three years. This means that the females reached the genetic potential expected at 15.0 to 17.9 years of age, respectively.
Therefore, the discrepancies found in this research study are confirmed by other studies carried out on populations living at a moderate altitude in Peru and Colombia (11), including other geographic regions of the world (8,9,16). Such differences could be due to the genetic constitution observed between the populations (20). However, some consider that these differences could be due to the public health services and levels of physical activity (21) and to the changes caused by secular tendencies during recent years (22).
In general, the results obtained here reinforce the importance of undertaking research related to growth and nutritional state in these populations since 6 % of the world's population living above 1500 meters above sea level (23) need to understand their own body growth patterns. Therefore, on the one hand, the results need to be interpreted by focusing on the universal characteristics and the human growth variables to research the links between growth, health, and nutritional state. On the other hand, research is needed in order to assess in great detail if the international references are appropriate for all people or if the specific references of a population could be beneficial at times (24).
In this context, this study demonstrated that the CDC-2012 references expressed for weight, height, and BMI are not appropriate for children and adolescents living at a moderate altitude in Peru and Colombia. Thus, it is necessary to develop growth curves for these populations. Moreover, it is also necessary to verify the applicability of BMI since this systematically underestimates the prevalence of obesity in children and adolescents (25).
Through the second objective of the study, the researchers sought to verify the use of BMI for children living at a moderate altitude since. In general, it is a method widely used for detecting and predicting fat and health risks (26). Despite this, various studies carried out in a number of cities at moderate altitudes in Peru (27) and Colombia (28,29) have used BMI without taking into account altitude as a relevant variable with regard to physical growth.
Therefore, the results here reflect clearly that chronological age, weight, and height have a considerable influence over BMI in both sexes in all BMI categories. On the contrary, when the analysis was conducted by means of the PI, the effect decreased ostensibly.
Therefore, this index may be considered as a more reliable indicator for classifying weight related to BMI. Furthermore, some studies have already indicated that BMI is not a perfect indicator and applicable to children and adolescents because of its high association with height (30,31). Furthermore, body weight is not proportional to height squared, specifically during the growth and development stages (32,33). Therefore, it is necessary to adjust height cubed to correct for height variations between children.
As a result, in accordance with the allometric model, the PI has a more solid mathematical basis than BMI since weight is a variable with a cubed dimension, and height is a variable with a linear dimension (34). Therefore, the use and applicability of PI reflects a lesser influence on height not only for adults but also for children over 5 years of age (35), as was observed in this research study.
The third objective of this study was to propose percentiles to assess physical growth based on age and sex. To accomplish this, the LMS Method was used to generate references for weight and height for age and sex. In addition, due to the non-applicability of BMI, the authors of this study proposed percentiles based on PI for age and sex to assess the weight status of children and adolescents living at a moderate altitude.
In this sense, generally, the curves are used to compare other international and/or regional samples with similar characteristics. Thus, the real value of the curves resides in the help they provide in determining to what extent the physiological needs are met during the growth and motor development processes (36). Moreover, the curves can be crucial for creating public policies oriented towards the prevention and combatting childhood obesity (37).
Therefore, based on what we know to date, this research study is the first to propose percentiles that include values for PI for children and adolescents living at a moderate altitude in two cities in South America. This information is relevant because it can function as well or better in some aspects than BMI. Additionally, it is less frequently used with children and adolescents. In spite of this, it continues to be a popular method used for neonatal populations (38). This is what makes it attractive for assessing the status of weight in pediatric populations from a moderate altitude.
The PI needs to be examined in future genetic and epidemiological studies of physical growth in populations living at low, moderate, and high altitudes since the allometric justification is an important foundation with regard to BMI. Therefore, considering other variables, such as nutritional, cultural, and biophysical, could help create new reference standards (23), particularly if they focus on regions of moderate and high altitudes.
The cut-off points for this study are based on the criteria adopted by the CDC (5,6). Although no definite consensus exists to date, the identification of excess weight in pediatric populations is somewhat arbitrary (39). Therefore, these groups are subject to possible health risks (13).
The size of the sample used with similar geographic characteristics (altitude of 2320-2640 meters), standardized assessment of the anthropometric variables, and the statistical model (LMS) used to generate the percentiles are a clear indication of the strengths of this research. However, some variables, such as the nutritional state, level of physical activity, and biological maturation of the students, were not possible to control. For future studies, these aspects need to be taken into account to avoid possible bias in the results. Furthermore, it is necessary to consider a reference method to verify the validity of the PI.
CONCLUSION
Children and adolescents living at a moderate altitude in Peru and Colombia differ in physical growth patterns from those of the CDC-2012. Furthermore, PI is a new alternative to estimate weight status in relation to BMI. The proposed curves could have greater implications for child health care programs and for clinical and epidemiological care for students living in moderate-altitude regions. We suggest researchers undertake longitudinal studies to confirm these results. The percentile calculations can be carried out by using the following link: http://www.reidebihu.net/

