


 Serviços customizados
 Inglês (pdf)
 Artigo em XML
 Referências do artigo
 Enviar este artigo por email
 Citado por SciELO
  Citado por Google
  Similares em
SciELO
Similares em
SciELO  Similares em Google
 Permalink
INTRODUCTION
In Mexico the nutritional transition is characterized by the coexistence of two phases: receding famine and non-communicable diseases (1). This is known as the double burden of malnutrition. Stunting continues to be a relevant public health problem with a prevalence of 13.6 % among children younger than 5 years old in 2012. The combined prevalence of overweight and obesity rose from 71.3 % in 2012 to 75.2 % in 2018 for Mexican women (2,3).
Information about changes in food habits, food supply, and dietary consumption is required to understand the nutrition transition in a society. There are three main sources to analyze diet quality at the population level: food balance sheets, household expenditure surveys, and individual food consumption surveys (4). Food balance sheets record the food supply at the country level; however, they are a gross proxy of consumption as they do not provide information about differences among groups in terms of food access, nor about specific food groups. For example, in Mexico, one study (5) showed that increased energy supply was associated with a higher supply of meat, dairy products, and sugars; however, it was not possible to make any distinctions based on processing level. Individual dietary surveys are another source but they have many disadvantages: higher cost and burden to respondents and interviewers; some tools do not capture long-term exposure to diet components; and in most low- and middle-income countries dietary surveys have not been part of nutritional surveillance in previous decades. In Mexico's case, dietary consumption data have been collected from 1988, but it was restricted to children and women of reproductive age (6). Individual dietary consumption for all age groups began to be collected in 2006.
The third source are household expenditure surveys. These surveys collect seven to fourteen days of food purchasing data and provide information about purchasing habits and the food environment to which household members are exposed to. Studies based on household expenditure surveys have been done in Mexico previously; however, they covered a shorter time period (i.e., 1982 to 2002) (5,7,8). In most cases a distinction by level of processing was not made (5,7,8). A recent study reported household supply from 1984 to 2016 based on NOVA food groups; however, authors only estimated energy supply (9). In other words, changes in macro- and micronutrient households' supply remain unknown.
A food item's processing level is relevant to an individual's and a community's health because the increase of ultra-processed foods and drinks (UPFD) in the food supply is a concern given their poor nutritional qualities. UPFD are characterized by a high content of total fats, sugars, salt, and energy density (10). For this reason, their consumption has been associated with higher levels of low-density lipoproteins and total cholesterol (11), higher risk for overweight and obesity (12), hypertension (13), and metabolic syndrome (14).
The objectives of this study were: a) to describe the supply of food groups in Mexico, classifying them by their level of processing and nutritional characteristics from 1984 to 2018; b) to describe energy, macro- and micronutrient supplies in Mexican households and its association with education and income from 1984 to 2018; and c) to compare the main food groups that contribute the most energy, macro and micronutrients in Mexican households during the assessed years.
MATERIAL AND METHODS
Five waves of the National Households' Income and Expenditure Survey (NHIES, Encuesta Nacional de Ingreso y Gasto de los Hogares) carried out in Mexico in 1984, 1994, 2004, 2014, and 2018 were analyzed (15-19). Nutrition transitions are driven by social and economic forces, and they take time to change. Therefore, we believe that a span of ten years would be enough to see those changes. The NHIES is a cross-sectional survey aimed to describe the magnitude and distribution of income and expenditure of Mexican households. The samples were probabilistic, with a bi-phase sampling, stratified by geographic region, locality size, and clustering (by census tracts), design. The last sampling units were dwellings, and observation units were their households (i.e., the people who shared food expenditures). Formally, participation in the NHIES is compulsory because it is part of the governmental system of information. Confidentiality is guaranteed to participants.
The samples for each wave were: 4,597 for 1984; 12,532 for 1994; 22,287 for 2004; 19,471 for 2014; and 74,602 for 2018. Exclusion criteria included households with no food supply information, and households with nutritional supply higher than 5 standard deviations (SD) from the mean. The analytical sample included 125,897 nationwide households distributed as follows: 4,345 for 1984; 11,953 for 1994; 21,308 for 2004; 18,400 for 2014; and 69,891 for 2018.
In the NHIES, the respondents (usually the housewife or a household member who knew about the household food expenditures) were trained to record any food or beverage purchased and/or obtained by any individual living in the household during a week. Trained interviewers reviewed the responses. Clarifications and probing for missing data were made at the end of the week. Interviewers categorized the recorded foods and beverages into most consumed single items (e.g., orange) or less consumed food categories (e.g., a category was formed by mandarin, nectarine, and tangerine).
The number of individual items or composed categories of food and beverages in each wave were 198 in 1984, 202 in 1994, 234 in 2004, and 238 in 2014 and 2018. In most cases the same items and categories were recorded along the waves (e.g., staple food such as maize, legumes, and sugar). The description of some foods was not the same in some waves; however, we treated them as the same product in the analysis. Similarly, there were cases when a food item or beverage was recorded as an individual item in one wave, but it was treated as part of a food category in another. In these cases, the weights of single items were added to create the same category in the different waves. Equivalence between waves with respect to single items or categories is reported in supplementary table I www.nutricionhospitalaria.org/files/4248/ADMA1-03686-01.pdf .
Table I. Sociodemographic characteristics of Mexican households between 1984 and 2018
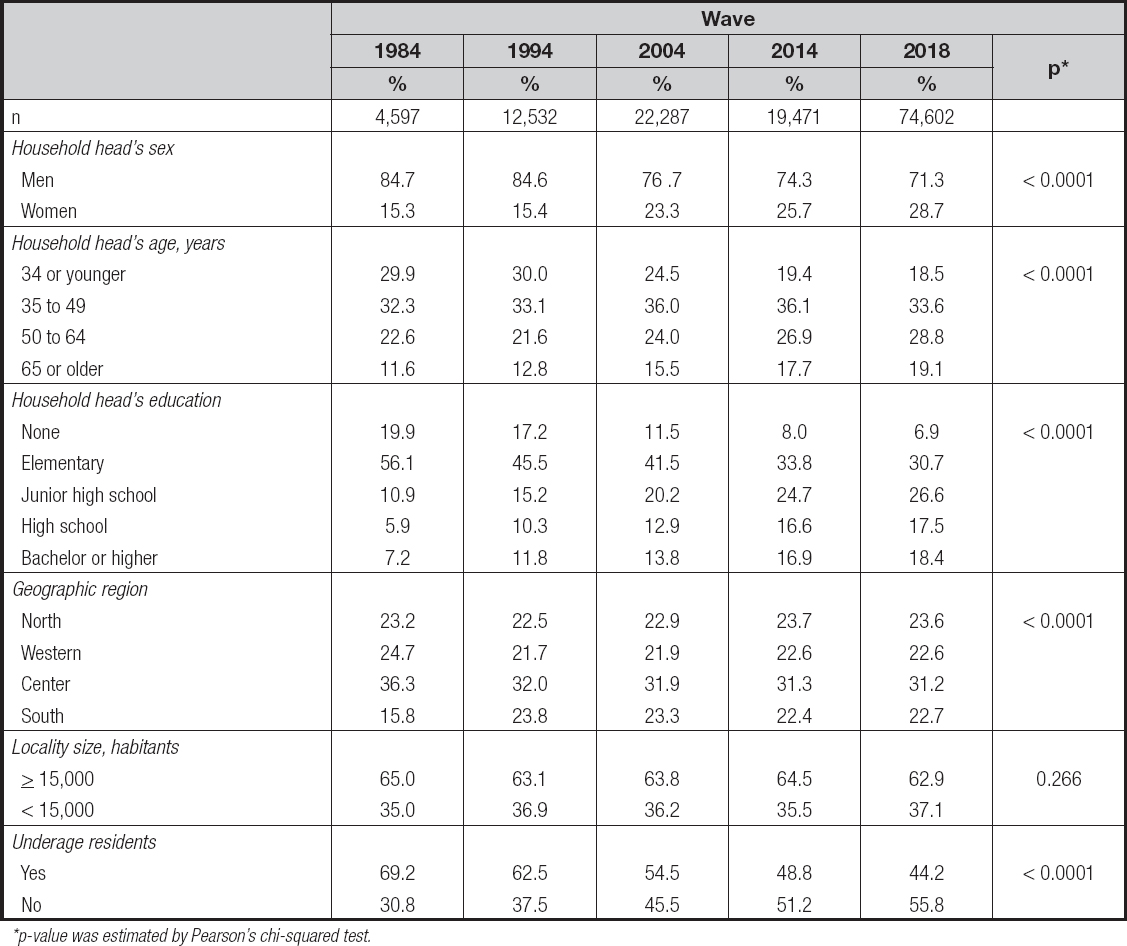
*p-value was estimated by Pearson's chi-squared test.
A total of 285 food items or categories were included in the database, which were classified into four groups according to the NOVA classification: unprocessed or minimally processed (UMPF), processed culinary ingredients (they will be referred to as “ingredients" from here onward), processed foods and drinks (PFD), and UPFD (20). Within each group, different subgroups were created. We created these subgroups because NOVA classification does not allow the identification of changes in specific items. In most cases, the description of foods and beverages made in the NHIES is enough to identify the level of processing. A complete list of food and beverages for each NOVA subgroup can be consulted in supplementary table II www.nutricionhospitalaria.org/files/4248/ADMA2-03686-01.pdf .
Table II. Food groups supply by waves among Mexican households
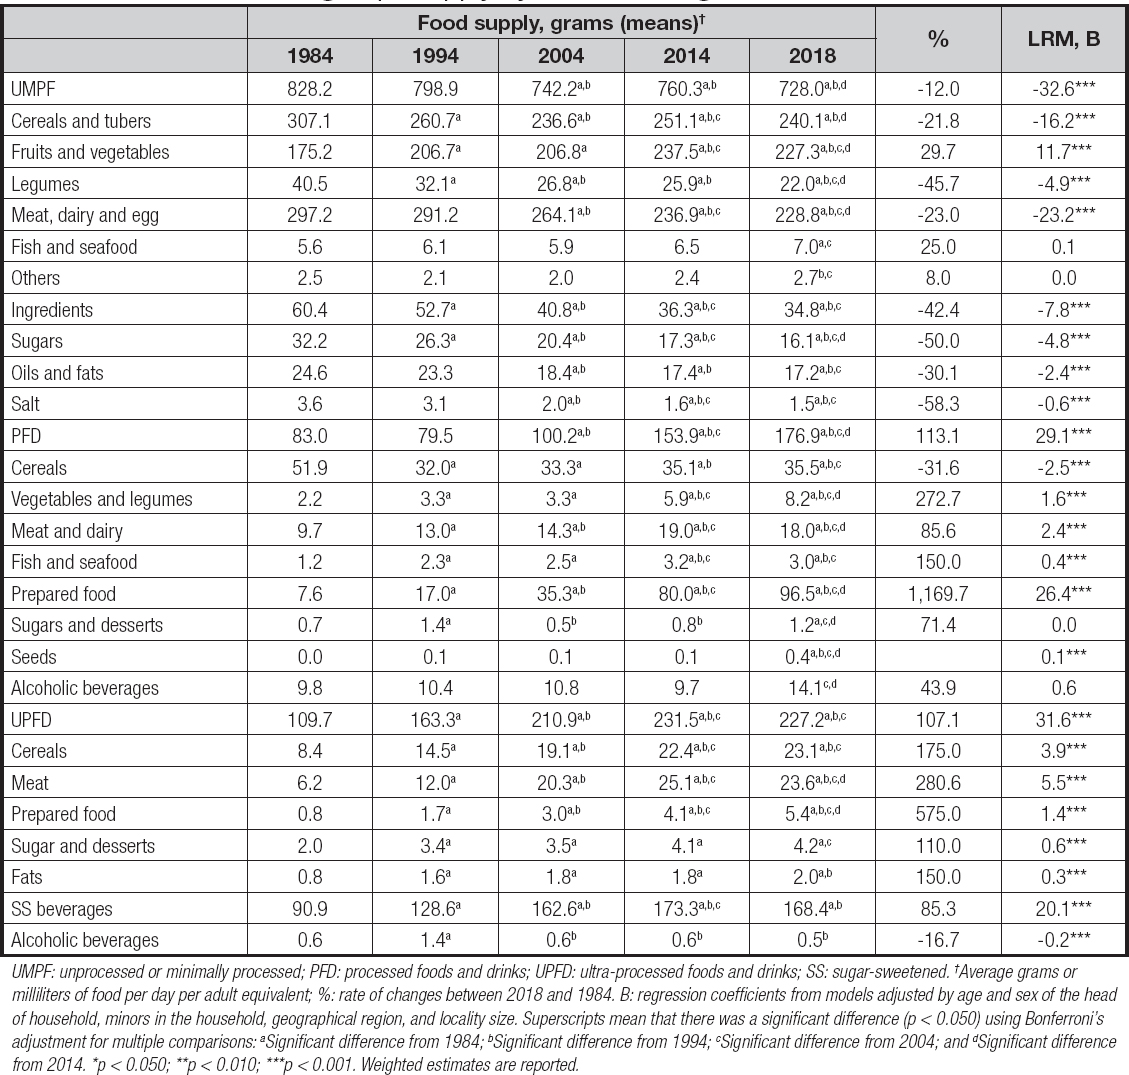
UMPF: unprocessed or minimally processed; PFD: processed foods and drinks; UPFD: ultra-processed foods and drinks; SS: sugar-sweetened. †Average grams or milliliters of food per day per adult equivalent; %: rate of changes between 2018 and 1984. B: regression coefficients from models adjusted by age and sex of the head of household, minors in the household, geographical region, and locality size. Superscripts mean that there was a significant difference (p < 0.050) using Bonferroni's adjustment for multiple comparisons: aSignificant difference from 1984; bSignificant difference from 1994; cSignificant difference from 2004; and dSignificant difference from 2014. *p < 0.050; **p < 0.010; ***p < 0.001. Weighted estimates are reported.
We followed standardized procedures (21,22) to identify and manage outliers and to make estimations of household supplies based on the NHIES data. In NHIES, beverage data were recorded in milliliters, therefore the FAO/INFOODS Density Database was consulted to make the conversion from milliliters to grams (23). The amount (in grams per day per adult equivalent) for each NOVA food group and subgroup was estimated to analyze household supply. The total number of household members was adjusted using adult equivalent values specific for the Mexican population (24). We made per-capita estimates using these adjusted total number of household members. The values used to estimate food supply data that were higher than 5 SD of the average total grams for each food were truncated.
Energy, macronutrients (proteins, carbohydrates, total fats, and saturated fats), cholesterol, fiber, and micronutrients (calcium, vitamin A, vitamin C, magnesium, iron, potassium, zinc, and sodium) supplies were estimated. The content of calories and nutrients was taken from the national food composition reference (25). When nutrient information was not found in this reference, the United States Department of Agriculture (USDA) Food Composition Databases (26) were consulted. The percentages of the edible portions of 234 of the 274 foods included in the analysis were found in the consulted food databases. For these items or categories, the non-edible portion was subtracted from the recorded weight. The average of energy and nutrient content was used to make estimations when different foods and beverages were included in one category. For the rest of the foods, it was not possible to estimate nutrient content because their description in the NHIES was unspecific (e.g., “other vegetables" ), therefore they were excluded from the nutritional analysis. However, the contribution of these categories was 6.5 % of the total weight of food and beverages. Energy was estimated as total kcal per day and as energy density per 100 grams of food and beverages. Macronutrients were expressed as the percentage of total energy supply. Micronutrients were estimated as the nutrient density per 1,000 kcal. Sodium was estimated both considering and not considering salt supply. The mean contribution of each food group to energy and nutrient totals was estimated as percentage. We focused on the contribution of NOVA groups to energy and nutrient supply.
Sex, age, and the head of household's education (hereinafter ‘education') was evaluated. Education was categorized in five groups: no education (e.g., preschool, elementary school or less (e.g., elementary); junior high school (e.g., junior high school, technical or commercial career with elementary education finished); high school (e.g., technical or commercial career with junior high school finished), and bachelor's degree or more (e.g., bachelor's degree, master's degree, and doctoral degree). Family income was analyzed in deciles. Another characteristic was whether there were minors in the households. States were categorized in four regions: north, west, center, and south. We distinguished between rural and urban localities based on population size — < 15,000 and > 15,000 inhabitants, respectively. This cut off was chosen to match the only two locality size categories in the 1984 database.
The statistical analysis was run using the Stata software, version 15.0. In all analyses the complex design of the NHIES was considered. Frequencies of categorical variables and means of continuous variables were conducted. Pearson's chi-square test was estimated to identify whether differences between groups existed. The respective confidence intervals (95 % CIs) with adjustment by Bonferroni's test were calculated to compare means of food and nutrient supplies according to each wave, and significant differences were noted. Linear regression models were generated with food, energy and nutrient supplies as the outcomes, and wave as the exposure variable. To analyze whether socioeconomic disparities in food and nutrient supply have changed, the interaction term of wave with family income and wave with household head education were introduced. When the interaction was not significant only the main effect of education and/or income were kept. In these linear regression models, waves, family income (in deciles), and education were treated as continuous variables. All models were adjusted for presence of minors in the household, geographical region, locality size, and age and sex of the household head.
RESULTS
Men predominated as head of households across the five waves; nevertheless, households headed by women have increased (Table I). The proportions of households with individuals aged 65 years or older as head of household have increased. Most heads of household had elementary education across the five waves. Heads of household with high school or more education also increased. Households located in the center region and locality size with more than 15,000 habitants were more prevalent along the waves. Households with underaged residents decreased.
Household supply of UMPF and ingredients decreased during the assessed waves (Table II). The UMPF and ingredients subgroups (those with similar trends across waves were legumes, meats, dairy and eggs, sugars, oils, fats, and salt) supply decreased over waves, except for fruits and vegetables, which were the only UMPF subgroup that increased. Fish and seafood and other UMPF had no differences between waves. PFD increased only in the last two waves. Vegetables and legumes, meat and dairy, fish and seafood, prepared foods, and seeds were the PFD subgroups that had an increasing trend. Processed cereals were the only group that was lower in successive waves when compared to wave 1. The supply of UPFD group and almost all UPFD subgroups increased with waves; the exception was alcoholic beverages, which decreased. A result to highlight is that the increase in sweetened beverages supply stopped in 2014.
Compared to wave 1, household supply of total energy, energy density, contribution of carbohydrates to total energy, and density of magnesium, zinc, potassium, and sodium including salt were lower in successive waves (Table III). The higher decrements were observed in sodium considering salt and energy density. In contrast, the following micronutrients tend to be higher in posterior waves: vitamin A, cholesterol, vitamin C, sodium without considering salt, fiber, contribution of proteins, total fats, and saturated fat to total energy. No linear trend was observed in the case of calcium and iron.
Table III. Energy and nutrient supply by waves among Mexican households
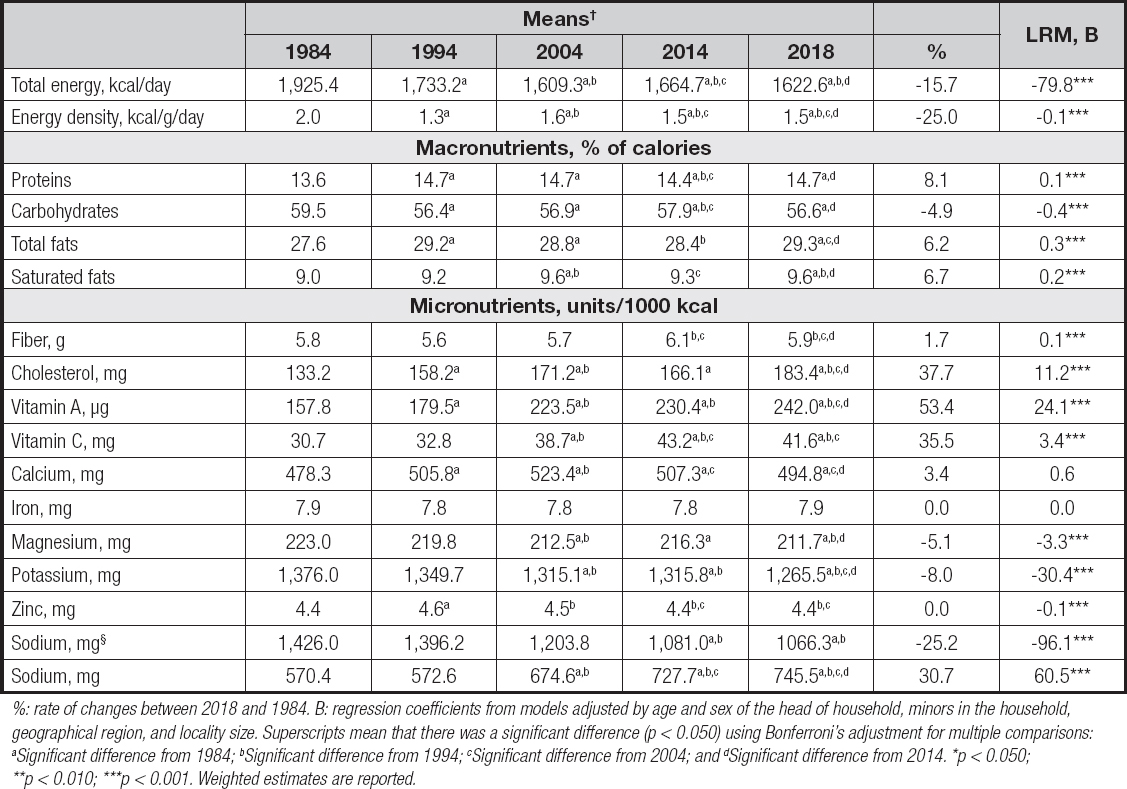
%: rate of changes between 2018 and 1984. B: regression coefficients from models adjusted by age and sex of the head of household, minors in the household, geographical region, and locality size. Superscripts mean that there was a significant difference (p < 0.050) using Bonferroni's adjustment for multiple comparisons: aSignificant difference from 1984; bSignificant difference from 1994; cSignificant difference from 2004; and dSignificant difference from 2014. *p < 0.050; **p < 0.010; ***p < 0.001. Weighted estimates are reported.
In the five waves, UMPFs were the main source of energy, carbohydrates, saturated fats, protein, potassium, fiber, and iron (Table IV). However, their contribution to energy and every analyzed nutrient decreased over time. Ingredients contribution to energy, carbohydrates, saturated fats, sodium, and iron also decreased. Conversely, PFD and UPFD contribution to energy and nutrients increased, with the increment of the former being higher than that of the latter.
Table IV. Percent contribution of each nutriment to total daily household food supply by adult equivalent in Mexican households from 1984 to 2018 by NOVA food groups
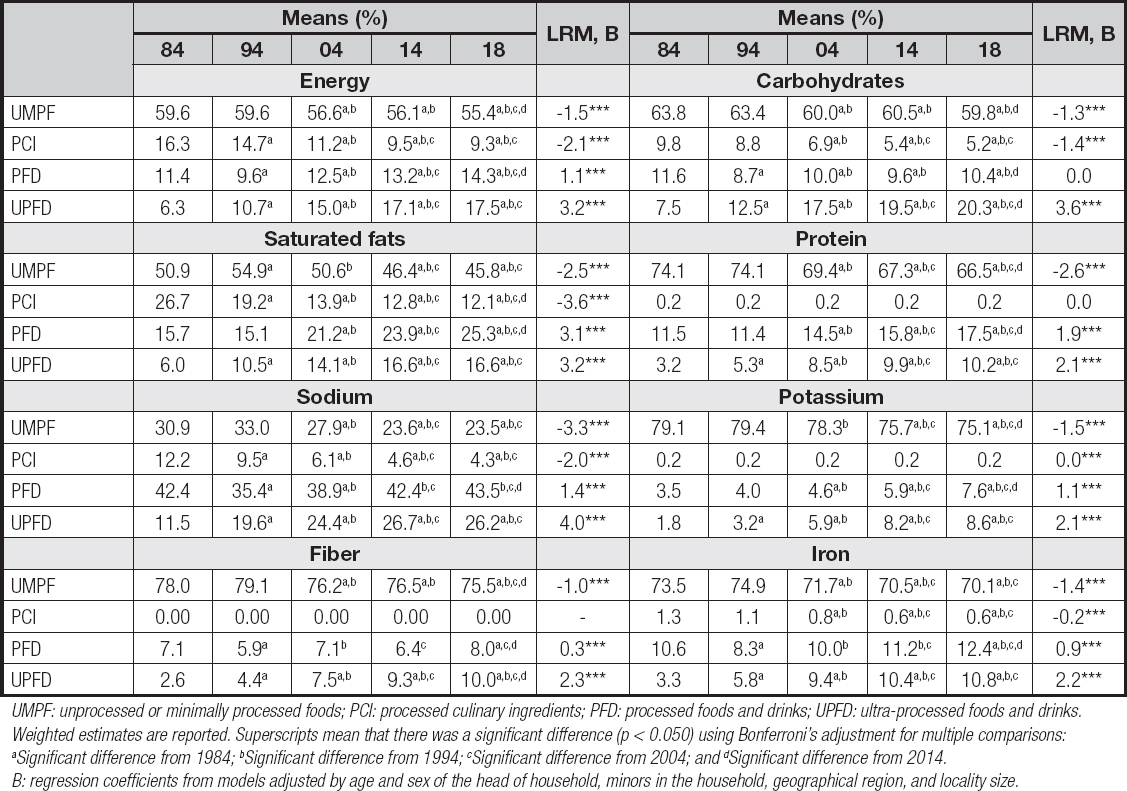
UMPF: unprocessed or minimally processed foods; PCI: processed culinary ingredients; PFD: processed foods and drinks; UPFD: ultra-processed foods and drinks. Weighted estimates are reported. Superscripts mean that there was a significant difference (p < 0.050) using Bonferroni's adjustment for multiple comparisons: aSignificant difference from 1984; bSignificant difference from 1994; cSignificant difference from 2004; and dSignificant difference from 2014. B: regression coefficients from models adjusted by age and sex of the head of household, minors in the household, geographical region, and locality size.
Along the waves, the supply of PFD, energy, fats, saturated fats, vitamin A, and sodium were higher as the education was higher, whereas ingredients and carbohydrate supply were lower (Table V). UPFD also was higher with more education, and these differences increased over time. Protein, cholesterol, calcium, and zinc were greater as education was higher, and energy density and fiber were lower; but these differences decreased over time. Over time more education was associated with lower supply of UMPF, energy, iron, and magnesium, and more supply of vitamin C; however, at wave 1 there were no differences in these items between education groups. Over the waves, more family income had less UMPF, fiber and potassium supply. At wave 1, more family income was related with more supply of PFD, UPFD, proteins, total and saturated fats, cholesterol, vitamin C, vitamin A, calcium, zinc, and sodium without considering salt; however, the increase of these items over time was lower as family income grew higher. At wave 1, energy density and the supply of carbohydrates, iron, magnesium, and sodium considering salt were lower as family income grew higher, and these differences decreased over time.
Table V. Association of education and income with NOVA food groups, energy and nutrient supply in Mexican households, 1984-2018
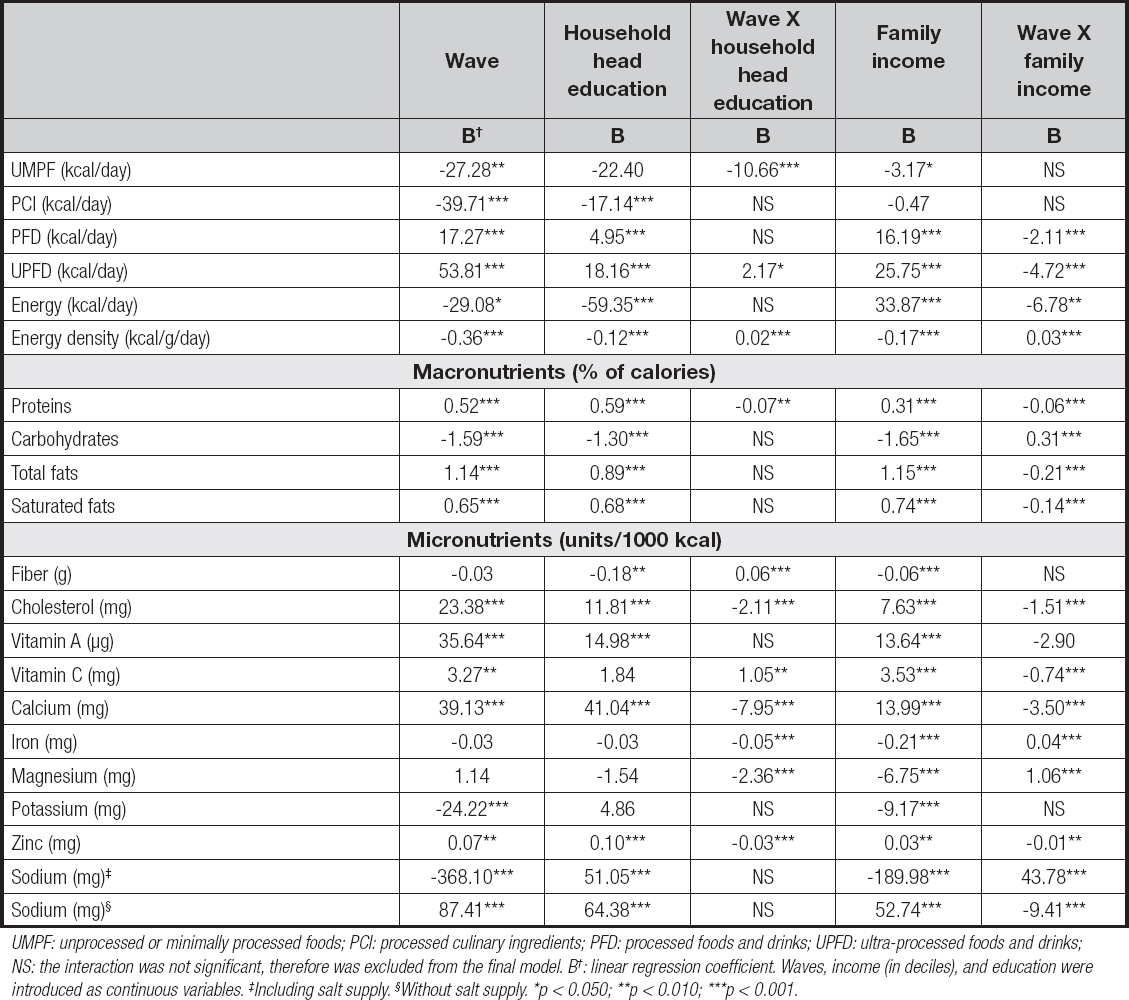
UMPF: unprocessed or minimally processed foods; PCI: processed culinary ingredients; PFD: processed foods and drinks; UPFD: ultra-processed foods and drinks; NS: the interaction was not significant, therefore was excluded from the final model. B†: linear regression coefficient. Waves, income (in deciles), and education were introduced as continuous variables. ‡Including salt supply. §Without salt supply. *p < 0.050; **p < 0.010; ***p < 0.001.
DISCUSSION
The supply of fruits and vegetables and most PFD and UPFD increased in Mexican households. The opposite happened with most UMPF subgroups. Similarly, all ingredients and processed cereal supplies decreased across the five waves. At the nutrient level, the previous changes at food level have produced reductions in energy supply, energy density, proportion of calories from carbohydrates, and density of magnesium, potassium, zinc, and sodium considering salt, whereas the proportion of calories from proteins, total and saturated fats, and density of fiber cholesterol, vitamin A, vitamin C, and sodium without considering salt increased.
The nutrition transition argument proposes that industrialization and urbanization increases PFD and UPFD supply (27). Part of our results support this premise because PFD and UPFD increased from 1984 to 2018, whereas the opposite trend was observed for UMPF and ingredients. The same trends were reported previously for the period 1984 to 2016 (9). Among the factors that could have a role in the raising of UPFD are: the profit aims by the food industry, the marketing that can have impact in food choices, the palatability and the convenience of UPFD that are appealing for people who work long hours or commute long distances and do not have enough time to prepare meals (28-30). An interesting finding in our study was that the increase of sweetened beverages supply stopped in 2014. Sweetened beverages are products that were taxed as part of a government intervention aimed to promote healthy eating (31).
The social environment in Mexico is changing; people spend more time at work and less time at home, this leads to less time to cook; consequently, people must look for more suitable options that can be available and accessible in a short time interval (9). PFD and UPFD meet these criteria; they are easy to find, ready to eat, and economically accessible (29). A recent study reported that the expenditure of food eaten away from home increased from 22.8 % in 2008 to 25.4 % in 2016 among Mexicans (28).
Despite the increase in UPFD supply, UMPF are predominant in Mexican households and are the main source of energy and most nutrients, except sodium. Even the fresh fruits and vegetable supply has increased, which can explain the increment in vitamin C supply. In terms of contribution of UMPF and ingredients to energy, our estimate for 2014 was similar to the intake of Mexican adults assessed in 2012 (56.1 % versus 54.0 %, and 10.2 % versus 9.5 %, respectively) (30). The consumption of UPFD was higher than household supply (29.8 % versus 17.1 %) and the opposite trend was observed for PFD (6.0 % versus 13.2 %) (30). Part of the discrepancies could be because the Mexican NHIES does not assess food eaten away from home, which has a higher supply of UPFD. In any case, compared with high-income countries, our findings and previous studies (9,30) show that supply and consumption of PFD and UPFD in Mexico is still low (31.9 %). In the USA they represented 67.3 % of total energy intake (32), and 61.7 % of household energy supply in Canada (33).
Changes in food groups supply have produced modifications in the energy and nutrient supply in Mexican households. The following changes in our study show how PFD and UPFD have become the main source of some nutrients in Mexican households that used to be obtained mainly from ingredients: in the eighties, oils and fats were one of the main sources of total energy; however, after the eighties processed cereals became one of the main sources of total energy (Supplementary Table III) - www.nutricionhospitalaria.org/files/4248/ADMA3-03686-01.pdf While progressively table sugar and table salt have been less important as sources of carbohydrates and sodium, respectively, sweetened beverages and processed cereals have increased their contribution to the former, and ultra-processed cereals and meat as the latter (Supplementary Table IV www.nutricionhospitalaria.org/files/4248/ADMA4-03686-01.pdf . The reduction in ingredients is relevant because people are aware when they use them for cooking or eating (e.g., add salt to prepared meal), therefore it is easier to regulate the amount that is used. In contrast, the increase of UPFD is worrisome because they have “unseen" ingredients that for most people are hard to know and regulate. Education campaigns to raise awareness of this fact are needed.
The rise of ultra-processed cereals, processed meat and dairy, prepared food, desserts, and sweetened beverages supplies in Mexican households had as a consequence a rise in saturated fat, cholesterol, and sodium supply. This is a concern given their association with negative health outcomes. Saturated fat consumption is a risk factor for high blood pressure, impaired glucose tolerance, and dyslipidemia (34). Similarly, sodium intake has been associated with higher blood pressure (34).
Legumes supply in Mexican households decreased over the last thirty-four years, and this could be related to the reduction in potassium supply. This finding is consistent with the stagnation of legume production and the reduction in national supply (28). This pattern should be a public health concern because legume consumption is associated with lower risk of colorectal and breast cancer, cardiovascular disease, and type-2 diabetes (35). Government support to the production of legumes is required to increase national supply, and subsequently this could increase their household supply and consumption. In addition, mass communication campaigns could be implemented to encourage legume consumption.
Although meat, vegetable and fruit production in Mexico has increased, most fruits and vegetables are exported (28). This might be associated with the below-recommended consumption of fruits and vegetables among Mexican households. Government policies should be aimed at increasing fruit and vegetable supply for national consumption. Fruit and vegetable consumption is a protective factor for chronic diseases including cardiovascular diseases, diabetes, and some forms of cancer (36-38). Fish consumption has also been associated with some benefits for cardiovascular function (34); however, fish supply in Mexican households is below the recommended amount.
The increase or decrease in the production and supply of certain food groups is not independent of the other ones. The Mexican alimentary system became more industrialized, and therefore globalized, with foreign investments, primarily due to the 1994 North America Free Trade Agreement (NAFTA). In 1993 (before NAFTA), subsidies to agriculture production disappeared in 1995 (39). Subsequently, support to agriculture increased in 2002 but then decreased in 2018. Most of the Mexican government's subsidies have been distributed to the richest 10 % of the farming producers. In contrast, small farming producers who are responsible for producing fresh foods for national consumption were placed at a disadvantage due to the decreased in subsidies associated with NAFTA. In this way, a strong policy directed to support small farming producers should be implemented to promote the production and retailing of UMPF. Eventually, this measure could influence the household supply and individual consumption of UMPF.
Changes in diet disparities associated with socioeconomic status are an important element of the nutrition transition. There is a co-existence of healthy and unhealthy characteristics in food and beverage supply and consumption across the different socioeconomic strata in Mexico. While households with low socioeconomic status have a higher supply of UMPF, and lower energy density, iron, magnesium, and potassium, they also have a lower supply of protein and micronutrients (vitamins A and C, calcium and zinc). On the other hand, high socioeconomic status households have a higher supply of protein, vitamin A, calcium, and zinc; but also a higher supply of PFD and UPFD, total and saturated fats, cholesterol, and sodium without considering salt.
A strength of this study is the use of a national survey that covers several time periods over a 34-year timeframe. This allows us to see changes in food supply over time. Furthermore, these data represent household food supply rather than individual intake, which give us a better idea of what families are exposed to and consume at home. One limitation is that the NHIES survey asks participants how much they spent on foods eaten away from home, but it does not record the type and amount of food and beverages consumed outside the household. Therefore, we were unable to estimate the quantity of food and beverages acquired away from home and their energy and nutrient content.
UMPF has been dominant in the Mexican household supply for over three decades. This makes them the main source of most nutrient, except sodium. Positive changes have been seen including an increase in healthy components such as fresh fruits and vegetables, and vitamins A and C. However, some of our findings highlight the need for policies aimed at promoting healthier diets. Although the fresh fruit and vegetable supply has increased in recent years, it remains lower than ideal. Legumes are another food group that needs promotion so that their consumption does not decrease. Although UPFD and PFD are not predominant in the Mexican household food supply, they have increased in an accelerated way. This has been conducive to an increment in unhealthy dietary components including saturated fat, cholesterol, and sodium. The Mexican society is in a primal time to stop the increase of PFD and UPFD, and increase or at least keep the level of UMPF supplies. In addition to bolstering the recent tax-based regulatory measures, more policies aimed at promoting the production and sales of healthier options of PFD and UPFD by the food industry and retailers are required. A challenge to nutrition policies is identifying interventions that simultaneously maintain the healthy characteristics of low socioeconomic household's diets while at the same time preventing access to unhealthy products. In this scenario, the incorporation of moderate amounts of fresh, lean meat and skim dairy products to the traditional Mexican diet (based mainly on UMPF) could be promoted.

