


 Servicios personalizados
 Inglés (pdf)
 Articulo en XML
 Referencias del artículo
 Enviar articulo por email
 Citado por SciELO
  Citado por Google
  Similares en
SciELO
Similares en
SciELO  Similares en Google
 Permalink
INTRODUCTION
Childhood obesity, a complex public health problem, is not only on the rise but has reached epidemic levels according to the World Health Organization (WHO) (1 ). This pathology, being of multifactorial origin, now affects developing and developed nations to the same degree (2 ).
A worldwide database reveals that 18 % of children and adolescents from 5 to 19 years of age suffer from obesity (3 ). Regarding 12- to 19-year-olds, the reported prevalence of obesity in the USA is 20.6 % (4 ), and in Mexico 38.4 % (2 ). Unfortunately, Mexico has the highest level of adolescent obesity in the world.
Since adolescence is marked by accelerated growth, the degree of adiposity depends on the balance between food intake and a large energy expenditure (5 ). Consequently, measuring the body dimensions of adolescents can favor the early detection of excess fat distribution and help prevent chronic diseases associated with obesity in adulthood (6 ). There are currently diverse methods of indirectly exploring the distribution of body fat, including anthropometric indicators (AIs) and bioelectrical impedance analysis (6 ,7 ).
It is crucial to determine the distribution of body fat because abdominal obesity constitutes a cardiometabolic risk (CMR) factor in children and adolescents (8 ,9 ). Body mass index (BMI), conicity index (CONI), and waist circumference (WC) have all proven to be valid as criteria for examining anatomical regions of adolescents (10 ). However, BMI is an inaccurate measure of abdominal obesity, as it does not reflect the distribution of body fat or differentiate between lean (fat-free) and adipose tissue mass (11 ). Although CONI can detect abdominal obesity (especially in adult women), it is of limited value for children and adolescents (12 ).
According to studies carried out on adolescents, body fat percentage (BFP) is intimately related to factors involved in CMR (6 ), and the waist-to-height ratio (WHtR) is more closely associated with CMR than WC or BMI (13 ). The importance of these findings is recognized by researchers who study the etiology of factors potentially participating in CMR, and thus inevitably influences their selection of the best AIs for determining such risk.
The selection of ideal AIs for assessing CMR may depend on the particular population in question. For example, the body composition of Latin Americans is distinct from that of Europeans. Even within Latin America, regional differences exist in the mixtures of populations. There are scarce reports in Mexico on the sensitivity and specificity of the various AIs for estimating CMR in adolescents. Hence, the principal aim of the current contribution was to analyze the usefulness of diverse AIs (BMI, WC, CONI, WHtR, and BFP) for evaluating obesity as a CMR factor in Mexican adolescents.
METHODS
A descriptive, cross-sectional, and analytical study was conducted during 2019 in three public high schools in Tuxtla Gutiérrez, Chiapas, Mexico. Through convenience sampling, a group of 2,181 15- to 16-year-old adolescents was formed, all being in the first semester of high school (this being the equivalent of the tenth grade).
The response rate was 91.7 % and the exclusion criterion was the wish not to participate. The final sample consisted of 2,000 students, including 1,079 females (53.9 %) and 921 males (46.1 %). An informed consent was obtained from the corresponding parents or guardians. The protocol was reviewed and approved by the committee of the Mexican National Academy of Bioethics.
The nutritional status (NS) of adolescents was evaluated utilizing AIs and bioelectrical impedance analysis, with the support of dietitians trained in the techniques recommended by Lohman (14 ). The measurements were always performed in the morning under the following conditions: after a 12-hour fast and evacuation of the bladder, with participants wearing light clothing (shoes removed) and standing in an upright position. Additionally, the subjects were instructed to avoid previous exercise or the intake of diuretics.
Weight and BFP were determined on a bioelectrical impedance analysis scale (Tanita, model BC-533, Arlington Heights, Illinois, USA) with an accuracy of 100 grams. Height was measured using an ultrasonic stadiometer (Inkids Inlab), known to be accurate to 1 millimeter. WC was established with a latex tape measure (Bodyfit) having an accuracy of 1 millimeter. The latter measurement was taken at the midpoint between the lower edge of the last rib and the upper limit of the Iliac crest, as indicated by the WHO guidelines. BMI was calculated by dividing weight (in kilograms) by height (in meters) squared, which allowed for the classification of the adolescents into categories of NS: underweight was considered at ≤ 2 standard deviation (SD), normal weight from -2 to +1 SD, overweight at > 1 SD, and obesity at > 2 SD, based on the Z-score proposed by the WHO for age and gender (15 ).
When diagnosing overweight and obesity by using WC, the optimal cut-off points employed were ≥ 73.8 and ≥ 74.1 centimeters for males, and ≥ 68.9 and ≥ 76.6 centimeters for females (16 ). The WHtR was calculated by dividing WC in centimeters by height in centimeters, thus classifying NS into overweight and obesity based on cut-off points for males (≥ 0.458 and ≥ 0.463) and females (≥ 0.445 and ≥ 0.468) (16 ). The CONI is found by multiplying a constant (0.19) by the square root of the quotient of body weight (in kilograms) divided by height (in meters), then dividing this number into WC (in meters). It allows for a classification of individuals of both genders into well-nourished (< 1.1) and obese (≥ 1.1) (17 ).
The BFP catalogs adolescents by taking into account the percentiles for their age and gender: low in fat (P3), healthy (≥ P4), high in fat (≥ P90), and obese (≥ P97) (18 ). Finally, CMR was estimated in both genders by using the cut-off values of WHtR (≥ 0.55).
A determination was made of central tendency measurements, position, and dispersion for continuous variables. The Kolmogorov-Smirnov test was applied to verify the normal distribution of quantitative variables (p > 0.05). As the majority of values did not fit a normal distribution, a nonparametric statistical analysis was carried out. The Mann-Whitney U-test was applied to compare the average values of the various AIs. The possible link between gender and the prevalence of each category of NS (obesity and CMR) obtained with a given AI was evaluated by utilizing the chi-squared test. The odds ratio was employed to establish the association between obesity and CMR. The level of significance was considered at p < 0.05.
To scrutinize the association between the different AIs, Pearson's correlation coefficient (r) was ascertained (considering r > 0.7 as significant) and the dispersion was graphed. The coefficient of determination (R2) was calculated to explore the quantitative relation between AIs (Fig. 1).
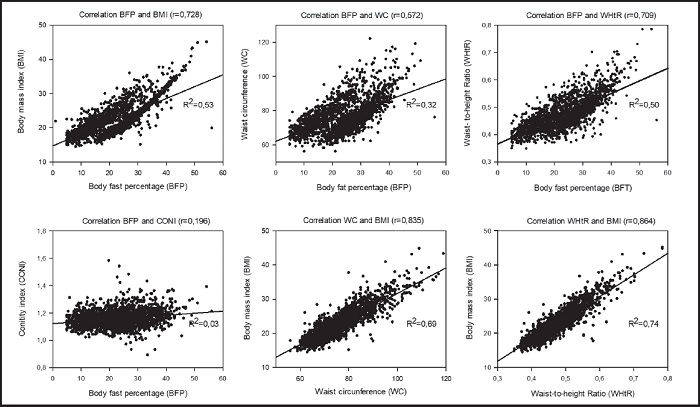
Figure 1. Analysis of the correlation of diverse anthropometric indicators using Pearson's correlation coefficient (r) and the coefficient of determination (R2)
Finally, receiver operating characteristic (ROC) curves were examined to assess the sensitivity and specificity of the various AIs (BMI, WC, CONI, and BFP) for estimating the CMR associated with obesity in adolescents. The area under the ROC curve (AUROC) served as an indicator of these AIs to predict obesity-related CMR. An AUROC value of 1 denotes a perfect predictive power for an AI, while a value ≤ 0.05 evidences the level of chance. The statistical package for social science (SPSS), version 22 (Chicago, IL, USA), was used for all statistical analyses.
RESULTS
The upper part of table I shows the variables considered for the participants. Average (and SD) age was 15.27 (0.44) years, weight was 59.36 (12.89) kilograms, height was 161.3 (8.2) centimeters, and WC was 76.1 (9.9) centimeters. The average values were higher for males than females regarding weight, height, WC, and CONI. Among females, they were greater for BMI, WHtR, and BFP.
Table I. Comparison of the nutritional status (NS) of study participants by gender, based on anthropometric indicators
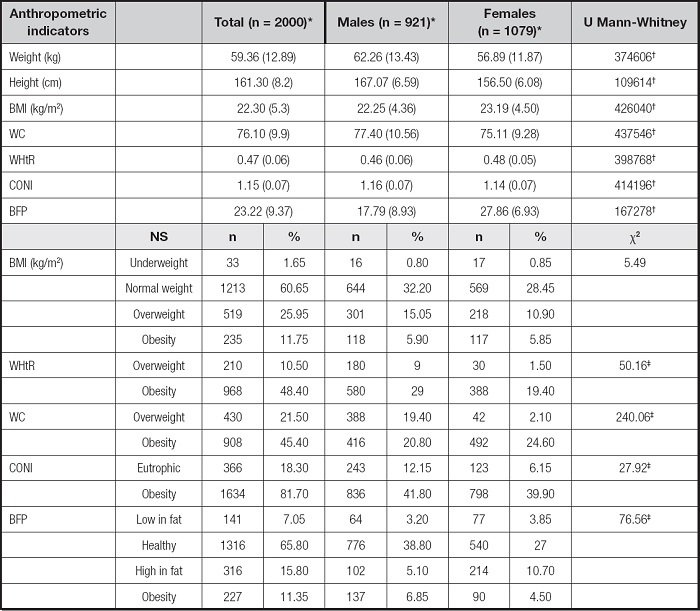
BMI: body mass index; WHtR: waist-to-height ratio; WC: waist circumference; CONI: conicity index; BFP: body fat percentage.
*Mean (standard deviation).
†Significant difference between males and females, Mann-Whitney U-test; z-score (p < 0.001).
‡Significant associations between gender and nutritional status (NS), chi-squared test (χ2) (p < 0.001).
The lower part of table I includes the five AIs presently employed, of which CONI portrayed the highest prevalence of obesity, with 81.7 % (1,634 individuals). In second place was WHtR, defining obesity at 48.4 % (968), followed by WC with 45.4 % (908). BMI and BFP detected the lowest prevalence of obesity, 11.7 % (235) and 11.3 % (227), respectively. The chi-squared test demonstrated that NS was dependent on gender for four of the five AIs (WHtR, WC, CONI, and BFP). Overweight was identified in more males than females — BMI revealed 15 % (301) and 10.9 % (218); WHtR revealed 9 % (180) and 1.5 % (30); and WC revealed 19.4 % (388) and 2.1 % (42), respectively. Likewise, obesity was more prevalent in males than females when measured by the WHtR and BFP, finding 29 % (580) vs. 19.4 % (388) and 6.85 % (185) vs. 4.5 % (90), respectively. Contrarily, the percentage of obesity was greater in males than females when using WC (24.6 % (492) vs. 20.8 % (416), respectively), and similar in the two genders based on BMI and CONI, displaying 5.9 % (118) and 5.8 % (117) for the former disease, and 41.8 % (836) and 39.9 % (798) for overweight.
Both the correlation coefficient and determination coefficient evidenced a positive and significant relationship of BFP with BMI and WHtR. A similar correlation was also detected between WC and BMI or WHtR and BMI. No significant relation was observed between BFP and WC or BPF and CONI.
In all cases of obesity as diagnosed by the different AIs, a significant association existed with CMR (Table II). With the cut-off values of WHtR to define CMR, the association of the latter was strongest with obesity as identified by WC, and strong with the classification based on BMI, followed by obesity as detected with CONI and finally BFP.
Table II. The correlation of obesity and cardiometabolic risk
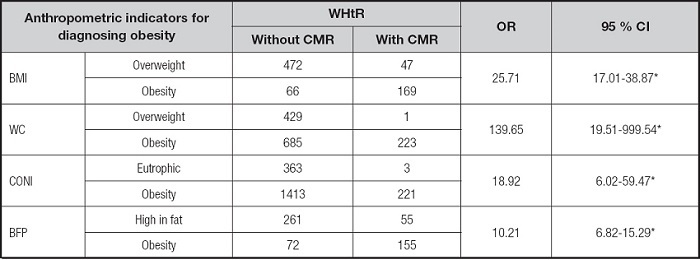
BMI: body mass index; WHtR: waist-to-height ratio; WC: waist circumference; CONI: conicity index; BFP: body fat percentage; 95 % CI: 95 % confidence interval. The cardiometabolic risk (CMR) was estimated by using the WHtR cut-off points.
*Significant associations between obesity and CMR, based on the odds ratio (OR) test; z-score (p < 0.001).
The discriminatory power of diverse AIs for estimating CMR is described in table III. For both genders, BMI gave the best AUROC, as well as the highest percentage for specificity and the greatest positive predictive value (PPV). In contrast, the AUROCs for WC and CONI were < 0.8.
Table III. Efficacy of anthropometric indicators for predicting obesity-related cardiometabolic risk in adolescents
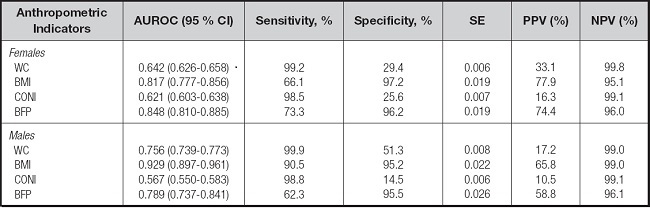
AUROC: area under the ROC curve; 95 % CI: 95 % confidence interval; SE, standard error; PPV: positive predictive value; NPV: negative predictive value; BMI: body mass index; WC: waist circumference; CONI: conicity index; BFP: body fat percentage.
DISCUSSION
The gender-based determination of NS in adolescents by utilizing the criteria associated with AIs represents an essential means of monitoring growth and development (19). The values of two of the five AIs currently examined (WHtR and BFP) were significantly higher in female than in male adolescents, which coincides with the findings reported by similar previous studies (7,17). This may be linked to the phenotypic characteristics of each gender regarding height and distribution of body fat (20).
Although a significant correlation was found between CMR and obesity when determining the latter with various AIs, it is necessary to carry out an in-depth analysis of the strengths and weaknesses of each of these parameters for diagnosing obesity and predicting CMR in adolescents. Accordingly, obesity, as evaluated by using WC, was significantly associated with CMR, but this feature was overshadowed by lack of correlation with BPF, low PPV, and an AUROC near 0.5 in women, possibly due to the absence of the correction factor represented by height (21). When the factor of height was considered by using the WHtR to classify overweight, a strong association emerged with cardiovascular risk factors (22). Consequently, the CMR of adolescents should not be assessed by employing WC alone but rather in combination with other AIs and biochemical studies.
On the other hand, the values of WHtR served as a reference to evaluate the degree of CMR (8) expressed by each of the other AIs employed, judging by the results of previous studies, the great capacity of WHtR for diagnosing obesity, and the strong correlation found presently with BFP and BMI. Nevertheless, we recognize the need to complement this estimate of CMR in future research by comparing WHtR with the previously established gold standards, especially the lipid profile and fasting glucose (23).
Of the five AIs employed presently, CONI portrayed the highest percentage of obesity (81.7 %) in both genders. The better capacity of CONI, as compared to WHtR, for detecting obesity was described in a study on 1,519 Venezuelan children and adolescents between 3 and 16 years of age (27). The diagnostic capacity of the CONI may be linked to multiple factors considered in its formulation (weight, height, and WC), thus allowing for a global assessment of body fat distribution (24).
However, CONI did not significantly correlate with BPF, and displayed the lowest PPV percentage. The current data show it to be unsuitable for predicting CMR in adolescents, in agreement with a previous report (10). This could be related to the well-known influence of the hormonal factor on the changes in body fat distribution that occur during adolescence (15).
BFP showed a strong correlation with the majority of the AIs herein examined (BMI, WC, and WHtR), and had a significant capability for predicting cardiometabolic risk, although its AUROC was different between women and men. The latter difference was probably due to the multiple factors that affect bioelectrical impedance analysis, including age, ethnicity, and degree of body fat (25). Since body fat alters body geometry and the distribution of water in the organism, it can negatively affect the relevance of bioelectrical impedance analysis with respect to obesity (25). A comparative study demonstrated the superior capability of X-ray absorptiometry over bioelectrical impedance analysis for quantifying BFP in Colombian children and adolescents (26). Thus, this AI can be used as a complementary tool for diagnosing obesity and predicting CMR.
Interestingly, BMI shares diverse similarities with BFP, such as its capacity to diagnose obesity, its positive and significant relation with other AIs (BFP, WC, and WHtR), and its great predictive capability as regards CMR. This is in line with other studies on adolescents in the USA (27) and Colombia (13), which have found BMI to be instrumental for evaluating the association of different factors with CMR, similar to WC and WHtR. Moreover, BMI proved to be better than WC for predicting CMR in patients suffering from metabolic syndrome (28-30).
It is of particular interest to examine the similarity between the prevalence of obesity detected with BMI and BFP and the high correlation found between both indicators. Previous reports have indicated the significant capacity of BMI to predict BFP in adolescents (1). However, the efficacy of each of these two AIs changes with age. In another study, involving Latin American young adults from 18 to 31 years, BMI was significantly less effective than BFP for detecting diagnosed obesity (32). Hence, the advantage represented by BMI for diagnosing obesity and predicting CMR in adolescents should be taken into account by doctors working at the primary health care level.
In conclusion, BMI proved to be a suitable parameter for diagnosing obesity and predicting CMR in adolescents, and showed a close relationship between these two conditions. Furthermore, it is a nonexpensive, easy to apply technique for clinics and hospitals. The ability to identify such alterations would help to consolidate good eating habits during adolescence.

