


 Servicios personalizados
 Inglés (pdf)
 Articulo en XML
 Referencias del artículo
 Enviar articulo por email
 Citado por SciELO
  Citado por Google
  Similares en
SciELO
Similares en
SciELO  Similares en Google
 Permalink
INTRODUCTION
Cardiovascular disease (CVD) is the main cause of premature death and disability. In 2012, 17.5 million people died, and it is expected that in 2030 the number of deaths will be 23.6 million (1). Obesity is associated with a 20 to 40 % higher risk of death (2). Obesity is related to the development of CVD, including atherosclerosis and symptomatic coronary disease, heart failure, and atrial fibrillation (3). Obesity increases the risk of CVD comorbidities such as hypertension, dyslipidemia, glucose intolerance and diabetes (4). One of the first subclinical stages in the atherosclerotic process is a deterioration of endothelial-dependent vasodilation. A mediator of endothelial dysfunction is the level of oxidative stress, which correlates with the accumulation of adipose tissue (5). When production of reactive oxygen species is high, the process of cellular damage occurs and can facilitate the development of CVD (6).
Currently, body mass index (BMI) is considered the main estimator of obesity, which is very practical to obtain. BMI is related to fat mass as estimated by bioimpedance (r = 0.75, p < 0.01 and r = 0.82, p < 0.01, for men and women, respectively) (7). Yet, the correlation of BMI and fat mass varies in childhood and adolescence, in older adults, and in people with different catabolic processes. A BMI > 30 kg/m2 has a specificity of 95 % in men and 99 % in women for the diagnosis of obesity, and a sensitivity of 36 % and 49 %, with a higher number of false negatives (8).
Several studies have questioned the usefulness of BMI as a predictor of cardiovascular risk. Asthon determined that cardiovascular risk increases from a BMI of 22 kg/m2 in women aged 30 to 64 years (OR: 1.58; 95 % CI, 1.2-2.0) (9). In Asia, given the increase in the prevalence of diabetes, cardiovascular risk factors and the high body fat percentage in the population, the WHO modified the cut points to 23 kg/m2 for overweight and 25 kg/m2 for the diagnosis of obesity. Flegal reported a lower mortality from any cause with a BMI of 24 to 30.9, it being lowest between 27 and 27.9 kg/m2 (10). Other studies found a lower mortality from all causes between BMI 23.7 (95 % CI, 23.4-24.3) to 27 kg/m2 (95 % IC: 26.5-27.6), and the risk of mortality caused by excess weight is observed with a BMI ≥ 30 kg/m2 (11,12).
Among causes associated with lifestyle, nutrition plays an important role in the etiology of CVD. Poor quality diets are rich in refined grains and added sugars, salt, unhealthy fats, and foods of animal origin; and low in whole grains, fruits, vegetables, legumes, fish and nuts (12). In Mexico, according to the National Health and Nutrition Survey (ENSANUT) of 2016, the prevalence of overweight and obesity was 72.5 %, this being higher for the group of 40 to 49 years in men and 50 to 59 years in women, but for the population aged 20 years and over, women presented an increase in the figures for overweight plus obesity from 73.0 % (2012) to 76.8 % (2018); for men, the figures for overweight and obesity also showed an increase from 2012 to 2018, with 69.4 % to 73.0 % (13).
The estimation of cardiovascular risk has been the cornerstone in clinical guidelines for the evaluation of obesity, and there is growing interest in the development of a more sensitive risk prediction for risk cardiovascular factors, which implies going beyond traditional risk factors using only or always BMI. We need to integrate a recommendation to increase early detection of the main risk factors for cardiovascular disease with different parameters in addition to BMI, and derivate these to analyze the sensitivity and specificity of BMI and other main cardiovascular risk factors (anthropometric, dietetic, biochemical and sociodemographic variables) in middle income urban participants in Guanajuato, Mexico, at different age ranges, as well as cardiovascular risk.
MATERIALS AND METHODS
We carried out a cross-sectional, comparative study in 385 adults (33 %, n = 125, males) of 20 to 59 years of age. The sample size required was 82 participants for each group; we used the r test considering a correlation of 0.70 between CVD and the presence of obesity as measured by BMI; a bilateral alpha of 0.05 and a beta of 20. The selection criteria were adults of both sexes without a history of CVD (coronary heart disease, cerebrovascular disease or congenital heart disease), middle-income urban participants from health clinics, educational centers and local businesses of the city of Leon, Guanajuato, Mexico. We obtained an informed consent for each participant. The population was stratified for every 10 years (20 to 29, 30 to 39, 40 to 49 and 50 to 59). The independent variable was BMI and the response was the percentage of high global CVD risk (Framingham Risk Score > 20 %). The biochemical variables (LDL, HDL, triglycerides and glucose), anthropometric (body fat percentage, waist circumference and hip circumference), clinical (blood pressure) and dietary (consumption of lipids, carbohydrates, proteins, sugar and fiber) were measured. Physical activity and gender were considered confounding factors.
ANTHROPOMETRIC
Anthropometric measurements were taken following the International Society of Advancement of Kinanthropometry (ISAK) protocol. The weight, body fat percentage and fat mass were measured with the Tanita SC-240 bioimpedance (BIA) scale. A calculation of BMI was obtained, and was considered obesity at a value ≥ 30 kg/m2. The measure of impedance is obesity and body fat percentage > 25 % in men and 35 % in women (14). The cut-off point for waist and hip circumference was considered at 80 cm in women and 90 cm in men (15).
BIOCHEMICAL
A blood sample of 10 ml was taken in the morning after a period of ten to twelve hours fasting for the determination of glucose levels, triglycerides, cholesterol, low density lipoprotein (LDL), and high density lipoprotein (HDL), performed by dry chemistry with the KODAK EKTACHEM DT60 II® (16).
CLINICAL
Blood pressure was taken according to the indications in the Draft of the Official Mexican Standard PROY-NOM-030-SSA2-2017 for the prevention, detection, diagnosis, treatment, and control of systemic arterial hypertension (17). The high global CVD risk at ten years was calculated using the Framingham risk score, which considers the variables sex, age, systolic pressure, presence of treatment for hypertension, presence of smoking, diabetes, total cholesterol, and HDL cholesterol. The individuals were classified as a high global CVD risk (10-year risk of a CVD event, 20 %) when it was greater than 20 % (18,19).
DIETARY
A food consumption questionnaire designed by the authors and a 24-hour food recall were applied (20). Nutrient content was calculated for proteins, carbohydrates and fats in the diet, grams of sugar, and fiber. All analyses were performed with the Nutrikcal® software, version 4.0. Food intakes were adjusted for 1,000 calories to determine the percentages of consumption. For the calculation of the OR, the percentage of dietary lipids (35 %) (21), the percentage of saturated fatty acids (7 %) (22), the consumption of cholesterol (300 mg) (19), sugar (25 g) (23), sodium (2000 mg) (24), dietary fiber (25 g) per day (25), and the consumption of industrialized juice were considered binary variables. A percentage of adequate adequacy was considered with a range of 90 to 100 % (26).
STATISTICAL ANALYSIS
The BMI percentiles of the total sample were calculated. Normality tests were performed with the Kolmogorov-Smirnov test. The differences between the groups were determined by one-way ANOVA for the variables with normal distribution, and the Kruskal-Wallis test for non-parametric variables. The association between cardiovascular risk and the rest of variables was tested using Spearman’s correlation. The odds ratio was calculated for the dietary and anthropometric variables in relation to the high global CVD risk. The tests were performed with a significance lower than 0.05 and a power of 80 %. Receiver operating characteristic (ROC) curve analyses were performed to calculate the sensitivity and specificity of BMI for the diagnosis of obesity. All tests were performed with the SPSS program, version 18.0.
ETHICS ASPECTS
This study was carried out considering the Declaration of Helsinki in its 2013 version, according to the Regulations of the General Law on Health in Research on Human Beings, and following ethical principles. Each participant signed an informed consent form. The project was approved by the Institutional Committee on Bioethics in Research of the University of Guanajuato (CIBIUG-P037-2015).
RESULTS
The study included a sample of 885 participants, the prevalence of high global CVD risk was 4 % (n = 13), 2 % in the forty-year group and 11 % for the fifty-year group (Table I). For the construction of percentiles with the results of BMI with the values for both genders, a BMI of 25 kg/m2 was in the 50th percentile for the twenty-year group, 27 for the thirty-year group, 29 for the forty-year group, and 28 for the fifty-year group (Fig. 1).
Table I. Sample characteristics by age group, gender, and high global CVD risk (n = 385).

*10-Year CVD risk > 20 %: high global CVD risk (10-year risk of a CVD event > 20 %) according to the Framingham CVD risk assessment tool.

Significant differences for multiple CVD risk factors were found including systolic blood pressure (p < 0.01) and total cholesterol levels (p < 0.01). The fifty-year group showed a lower BMI (p < 0.01), waist circumference (p < 0.01) and percentage of body fat (p < 0.01) compared to the forty -year group (Table II). Total cholesterol levels were greater for the fifty-year group when comparing groups, it was the same for the low-density lipoproteins (p < 0.01) (Table II).
Table II. Comparison of the clinical, biochemical and anthropometric variables by age group.

The data are expressed as medians and ranges.
p*: normality test with the Kolmogorov Smirnov test.
p: mean difference test using one-way ANOVA and Kruskal- Wallis for variables with non-parametric distribution.
*Tukey-Kramer post-hoc test for multiple comparisons significant at p < 0.05 with respect to the 20-year group.
†Tukey-Kramer post-hoc test for multiple comparisons significant at p < 0.05 with respect to the 30-year group.
‡Tukey-Kramer post-hoc test for multiple comparisons significant at p < 0.05 with respect to the 40-year group.
In the evaluation of dietary variables, significant differences were observed with a greater consumption for the twenty-year group in energy consumption (p < 0.01), lipids (p < 0.01), monounsaturated fatty acids (p = 0.04), polyunsaturated fatty acids (p = 0.04) and sodium intake (p < 0.01) (Table III). For the consumption of beverages with added sugars, 70 % (n = 280) of the sample reported consuming soft drinks, and 26 % (n = 98) industrialized juices.
Table III. Comparison of dietary intake of the stratified population by age group.
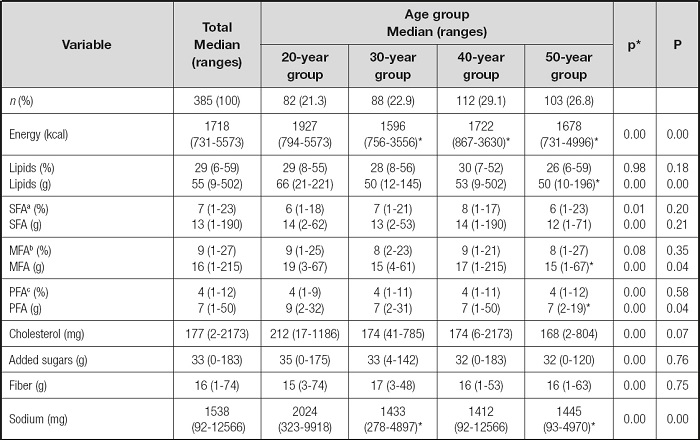
aSaturated fatty acids.
bMonounsaturated fatty acids.
cPolyunsaturated fatty acids. Data are expressed as medians and ranges.
p*: normality test with the Kolmogorov Smirnov test
p: mean difference test using one-way ANOVA and Kruskal-Wallis for variables with non-parametric distribution.
*Tukey-Kramer post-hoc test for multiple comparisons significant at p <0.05 respect to the 20-year group.
The twenty-year group showed an early exhibition for the consumption of sugary drinks (p < 0.01), a higher frequency of industrialized juice consumption at present (p < 0.01), a greater amount of industrialized juice ingested per day (p < 0.01), and an increased consumption of industrialized food per day (p < 0.01).
A significant correlation was obtained between the BMI and the body fat percentage (r = 0.8, p < 0.01), fat mass (r = 0.9, p < 0.01), waist circumference (r = 0.9, p < 0.01), and hip circumference (r = 0.9, p < 0.01), for the total sample (Table IV).
Table IV. Correlation coefficients between body mass index (BMI), 10-year CVD risk, and anthropometric variables.

a10-Year CVD risk: 10-year risk of a CVD event according to the Framingham CVD risk assessment tool.
p*: normality test with the Kolmogorov Smirnov test for the total sample (n = 385). Spearman’s correlation test was used.
*The correlation was significant at a level of 0.05, unilateral.
†The correlation was significant at a level of 0.01, unilateral.
The high global CVD risk showed a significant correlation with waist circumference (r = 0.4, p < 0.01), BMI (r = 0.3, p < 0.01), fat mass (r = 0.3, p < 0.01) and body fat percentage (r = 0.2, p < 0.01) in all age groups (Table IV). Regarding the anthropometric risk factors for the high global CVD risk, the odds ratio of obesity diagnosed by a BMI > 30 kg/m2 was 6.1 (95 % CI, 1.6-22.6, p < 0.01).
For the dietary variables, an odds ratio of 3.2 (95 % CI, 1.0-9.9, p = 0.03) was obtained for higher consumption of 300 mg/dl of cholesterol per day (Table V).
Table V. Odds ratios (OR) for the anthropometric and dietary variables with 10-year CVD risk.

a> 35 % lipids; consumption > 35 % of calories from lipids per day.
b> 7 % saturated fatty acids; consumption > 7 % of calories from saturated fatty acids per day.
c> 10 % saturated fatty acids; consumption > 10 % of calories from saturated fatty acids per day.
d> 300 mg cholesterol; consumption > 300 mg of cholesterol per day.
e> 25 g sugar; consumption > 25 g of added sugar per day.
f> 25 g fiber; consumption > 25 g of fiber per day.
g> 30 g fiber; consumption > 30 g of fiber per day.
h> 2000 mg sodium; consumption > 2000 mg of sodium per day.
p: the level of statistical significance was established at p < 0.05.
For the sensitivity and specificity of the BMI for the total sample and the anthropometric parameters for high global CVD risk, the waist circumference and the percentage of body fat percentage had a sensitivity of 100 %, BMI of 77 % (Table VI).
Table VI. Sensitivity and specificity of body mass index (BMI) for the total sample and anthropometric parameters for the determination of 10-year CVD risk.

a10-year CVD risk > 20 %: high global CVD risk (10-year risk of a CVD event > 20 %) according to the Framingham CVD risk assessment tool.
The sensitivity and specificity of BMI for the current diagnosis of obesity according to WHO (BMI > 30 kg/m2) had a specificity of 93 % in men and 100 % in women, while sensitivity had values of 51 % and 57 %, respectively (Table VI). Regarding the calculation of BMI cutoffs to detect obesity according to body fat percentage, for men, the area under the curve was 0.93 for a BMI of 26.65 kg/m2, with a sensitivity of 90 % and a specificity of 85 %. For women, the area under the curve was 0.95 with a BMI of 25.5 kg/m2, with a sensitivity of 90 % and a specificity of 83 %.
DISCUSSION
The indicators of cardiovascular disease have been widely described and adapted to other formats such as the Pan American Health Organization, but given the lifestyle changes, it is necessary to reevaluate these instruments and diagnostic indicators such as BMI, the most widely used tool for diagnosing obesity and an independent predictor of CVD risk.
According to the list of WHO/ISH risk prediction charts by epidemiological sub-regions, Spain is in classification A for “very low child mortality and very low adult mortality”, Mexico is in classification B for “low child mortality and low adult mortality”, and the Democratic People’s Republic of Korea in D for “high child mortality and high adult mortality”. However, in our study, the proportion of participants with a cardiovascular risk greater than 20 %, according to the Framingham risk score, was only 4 % compared to studies reporting 30.4 % in Spain (men and women of 55-74 years, n = 5966) and 12 % in South Korea (men aged 25-65 years, n = 180) (27-29).
Although the frequency of high global CVD risk was lower than expected for the total sample, the fifty-year group (n = 103), with the highest frequency of cases with high global CVD risk (n = 11), showed differences with respect to the twenty-year group with greater waist circumference, systolic blood pressure, BMI, body fat percentage, fasting glucose levels and triglycerides (p < 0.05). Only LDL cholesterol represented a significant difference for the fifty-year group compared to the rest of the groups (p < 0.01).
On the other hand, in the forty-year group the prevalence of high global CVD risk was two percent (n = 2) and presented values of diastolic blood pressure, BMI, and body fat percentage even higher than the fifty-year group (p < 0.05). It should be considered that according to studies, up to 49.7 % of people without cardiovascular risk factors (blood pressure < 140/90 mmHg, fasting glucose < 126 mg/dl, total cholesterol < 240 mg/dl and LDL cholesterol < 160 mg/dl) can present subclinical atherosclerosis, and among the variables that are associated independently with their presence are LDL cholesterol levels (OR, 1.14; 95 % CI, 1.08-1.19, p < 0.01), so that their evaluation should be considered for primary prevention even in individuals conventionally considered without risk factors (30).
No cases with high global CVD risk were found in the younger groups (20 and 30 years). However, it should be noted that the Framingham score was designed based on a population over 30 years old, and the strength of the association between the factors of individual risk and mortality differs by ethnicity; as such, it may not identify individuals with predisposing lifestyles to develop long-term cardiovascular disease (28).
HIGH CARDIOVASCULAR RISK AND ANTHROPOMETRIC VARIABLES
According to our study, BMI (r = 0.3, p < 0.01) and waist circumference (r = 0.4, p < 0.01) are the anthropometric variables with the greatest association with global CVD risk in all age groups, and BMI is a risk factor for high global CVD risk (OR, 6.1; 95 % CI, 1.6-22.6).
The fifty-year group showed a mean BMI and waist circumference less than the forty-year group (p < 0.05); however, it had a greater number of participants with high global CVD risk; these variations could be associated with body composition, low subcutaneous fat and the presence of visceral fat. Visceral fat increases with age and suggests a phenotype with less capacity to capture free fatty acids in adipose tissue (31). In a study of adults with type 2 diabetes with a mean age of 65 ± 12 years, the area of visceral and subcutaneous fat was measured by computed axial tomography and showed an association with the thickness of the carotid intima-media; according to their results, having high visceral fat and decreased subcutaneous fat is significantly associated with carotid intima-media thickness (β = 0.42, p < 0.001), which provides evidence that high visceral fat with low-fat subcutaneous accumulation is an important determinant for carotid atherosclerosis, and subcutaneous fat may protect against atherosclerosis. However, there are no cutoffs to classify the relationship between subcutaneous and visceral fat with cardiovascular risk (32).
SENSITIVITY AND SPECIFICITY OF BMI FOR THE DIAGNOSIS OF OBESITY
Despite the significant association between BMI and body fat percentage (r = 0.8, p < 0.01), the current cut-off points for the detection of obesity showed excellent specificity (93 % for men and 100 % for women) but poor sensitivity with values of 53 % and 50.89 % for men and women. A higher body fat percentage is associated with greater resistance to hepatic and muscular insulin; thus, the low sensitivity of BMI leaves about half of the people with obesity, defined by body fat percentage, without a diagnosis of risk (33). It is worth mentioning that there is no strong basis for choosing any single measure of obesity as a gold standard (34); but, it is known that a low BMI and high body fat percentage are independently associated with increased mortality (35). Although there are high-tech imaging options such as computed tomography and magnetic resonance with excellent accuracy, their cost, technical complexity and lack of portability exclude their routine use. On the other hand, the use of BIA finds that 61.25 % of women classified as nonobese by BMI are false negatives (34); however, more longitudinal evidence is needed to strengthen this relationship.
According to our results, the cut-off value recommended by the WHO for the detection of obesity does not reflect the actual excess of adipose tissue (8,10). Our data agree with the results by Romero-Corral and collaborators, who determined that BMI has a sensitivity of 49 % and, according to the literature, it can decrease to 25.6 % when it comes to postmenopausal caucasian women (8).
According to Gómez Ambrosi and his research in the American population, the cutting points that diagnose obesity with greater precision are 29 kg/m2 in men and 27 kg/m2 in women. We propose cutoffs for the diagnosis of obesity by BMI, based on body fat percentage, at 25.5 kg/m2 for women and 26.6 kg/m2 for men. We agree with the recommendation issued by Gómez Ambrosi to include the evaluation of body composition in routine practice for the diagnosis of obesity. Although there is no recommended universal method to measure body fat percentage, bioelectrical impedance analysis (BIA) is considered a portable, non-invasive and low-cost method; however, its reliability and precision can be influenced by the type of instrument, hydration, and the prediction equation used (36). The clinical evaluation of excess fat in individuals with normal BMI should begin at an early age, and obesity should be evaluated by fat mass and fat-free mass (33).
RISK FACTORS FOR THE INCREASE IN CARDIOVASCULAR RISK: DIETARY INTAKE
Although we did not show participants with high global CVD risk, the group with the highest dietary risk behaviors was the twenty-year group, with a higher energy and sodium consumption than the rest of the groups (p < 0.01). Although it also had a higher consumption of lipids, total cholesterol, and sugar grams, differences were not statistically significant.
The dietary guidelines for Americans, in its 2010 version, recommend keeping daily cholesterol intake below 300 mg (37); and describe that reduction of dietary cholesterol to 300 mg per day is not included in the 2015 edition since this parameter is no longer considered necessary when constructing healthy eating patterns. However, the OR of consumption of more than 300 mg of cholesterol per day in our population for high global CVD risk was 3.2 (95 % CI, 1.0-9.9, p = 0.03). Only cholesterol levels were shown to be a factor of high global CVD risk, although the results may be limited by the size of our sample. Significant differences were observed in age of onset of consumption of beverages with added sugars (p < 0.01), which is worrisome because, while in the twenty-year group there were no cases with high global CVD risk, and the high-risk population was concentrated in the fifty-year group, the exposure to these risk products started earlier in the younger groups (p < 0.01).
In the present study, the consumption of industrial juice was higher in the twenty-year group, with significant differences when compared with the rest of groups (p < 0.01). According to studies, regular consumption of sugary drinks (two soft drinks per day compared to one soft drink per month) has been associated with a 35 % increase in the risk of coronary heart disease in women, even after taking into account other factors like diet and lifestyle (19).
In our sample, 100 % of patients with high global CVD risk reported a positive soda consumption of at least one cup of soda twice a week, and average sugar consumption of 40 ± 32 grams per day. The WHO recommends that the maximum sugar energy consumption be less than 5 %, about 25 grams of sugar per day (30); and according to the Collin, drinking 24 ounces of sweetened drinks or more per day represents a double risk of death from heart disease compared to those who drink less than one ounce per day (HR, 2.5; 95 % CI, 1.3-4.8) (38).
On the other hand, a high sodium intake increases blood pressure and mortality from CVD (31); prospective studies suggest a J-shaped association between sodium intake and CVD risk. In our sample, sodium intake was higher in the younger group as compared to the fifty-year group (p < 0.01).
In a review of 23 epidemiological studies (n = 274,683) the lowest risk of cardiovascular events and deaths occurred with an intake between 2.7 and 5 g of sodium per day (39); however, according to the expert consensus of the Institute of Medicine (IOM) and the AHA, the average sodium intake in the US population is currently 3,440 mg per day and should be reduced. According to the 2015-2020 American Dietary Guidelines, it is recommended to maintain sodium intake below 2300 mg per day for adults and children over 14 years of age (37).
Regarding the relationship between the intake of processed meats and cardiovascular risk, the OR for consumption of sausages was 1 (95 % CI, 0.2-3.7, p = 0.99). Processed red meats are associated with an increase in cardiovascular diseases and strokes (39). However, for our population, the relationship between these variables was not conclusive.
Regarding the limitations of the study, we found a low frequency of high global CVD risk according to the Framingham Risk Score, which could have limited the positive and negative predictive values as well as the association with cardiovascular risk. It should be considered, when studying cigarette smoking as a risk factor for stroke, that in the Framingham cohort 55.6 % of men and 36.1 % of women smoked; and although smokers showed a lower weight compared to non-smokers (p < 005), they presented an increased risk of hypertension, heart attack, and stroke. However, in the present study, the prevalence of smoking was lower than 10 % for the total sample. Integrating the population from the twenty-year group can make a difference by how old you are and that, to some extent, risk expression could be contained in this age, so the sample should be higher for this age group.
Another limitation is the quantification of sodium intake and antioxidants, which was carried out by means of a 24-hour recall, a retrospective dietary evaluation method, however, the gold standard is 24-hour urinary sodium excretion, which was not feasible. Finally, a recent study that derives from the analysis of the 2018 health and nutrition survey, reflects figures similar to those studied in our population, which reflects an urgent call to action in the face of overweight and obesity figures, mainly in the age group of 20 years, which was the group with the highest metabolic and cardiovascular risks, mainly reflected in the dietary analysis (40).
CONCLUSIONS
BMI presented a significant association with cardiovascular risk according to the Framingham risk score for all age groups; however, it did not significantly predict high global CVD risk in 30 % of cases. Although biochemical values were mostly adequate for the twenty-year group, dietary consumption did not reflect the same behavior, where this group had higher intakes than the other age groups for cholesterol, sugar additives, energy, and saturated fats. Among the different age groups, BMI was found to be a specific diagnostic test in men and women (93 % and 100 %, respectively), as well as positive predictive values. However, when considering high global CVD risk, the results suggest that BMI should be integrated with waist measurement and body fat percentage to obtain a higher sensitivity. Waist circumference and percentage of body fat as determined by bioimpedance showed an adequate sensitivity; however, several factors must be taken into account, such as the type of instrument or equipment, as well as the prediction equation used. A surveillance strategy for these variables should be integrated for the population in their twenties.

