


 Servicios personalizados
 Inglés (pdf)
 Articulo en XML
 Referencias del artículo
 Enviar articulo por email
 Citado por SciELO
  Citado por Google
  Similares en
SciELO
Similares en
SciELO  Similares en Google
 Permalink
INTRODUCTION
End-stage renal disease (ESRD) is characterized by a definitive, total or almost total, irreversible loss of renal function, which is accompanied by endocrine, gastrointestinal, neurological, electrolytic, and water alterations (1). Overhydration becomes important due to its role in the development of cardiovascular complications, which are the main cause of death in kidney disease patients regardless of age, type of dialysis modality, cause of ESRD, race, or geographic region (2). In ESRD, overhydration is relevant for its association with mortality, in addition, nutritional alterations and systemic inflammation, accompanied by an increase in catabolism, are also evident and further increase morbidity and mortality. This entity is known as protein-energy wasting (PEW), which has a prevalence of 28-54% in patients on renal replacement therapy (3) and to a lesser extent (11-54 %) in patients in stages 3 and 4 of chronic kidney disease (CKD) (4-6). PEW is also associated with more hospitalizations, longer hospital stays, and higher morbidity and mortality. Therefore, adequate evaluation of nutritional status including measurements of body composition is vital (7).
One of the most commonly used methods of measuring body composition owing to its accuracy and ease of application is bioelectrical impedance analysis (BIA), which offers a noninvasive evaluation of human body composition to estimate total body water (TBW) based on the physiological principle of constant tissue hydration, which assumes that 73 % of lean body mass (LBM) is water, and the LBM from fat mass (FM) is determined using a simple equation based on two compartments (LBM = total weight − FM). BIA studies are based on the relationship between the electrical properties of the human body, the body composition of different tissues, and the total water content in the body (8). Similar to all indirect methods of estimating body composition, BIA depends on some assumptions related to the electrical properties of the body, its composition, its state of maturation, its level of hydration, age, sex, race, and health/physical condition (8).
Given that in most patients with kidney disease, the assumption of normal hydration is not met, one of the tools that has been used to unbias the diagnosis of body composition is bioelectrical impedance vector analysis (BIVA). This method is based on the components of bioimpedance (Z), resistance (R), and reactance (Xc) standardized by height and phase angle (PA) and not by estimates from prediction equations (9,10). Different body composition analyzers currently on the market use different measurement techniques, such as monofrequency (a single frequency), multifrequency (more than one frequency), spectroscopy (frequencies from 0 to infinity), and segments (measurement of the trunk and extremities at multiple frequencies) (11,12). These analyzers can vary in size and cost, among other characteristics. Results and diagnoses regarding body composition obtained through the different measurement techniques may differ, but no evidence of such disparities is available.
Our main objective was to identify the degree of agreement between the components of BIA analysis and BIVA results obtained through four different measurement technologies (monofrequency, multifrequency, spectroscopy, and segmental techniques). Additionally, we evaluated the degree of agreement between the estimates of FFM and FM by BIA and by the gold-standard method of dual X-ray absorptiometry (DEXA).
MATERIALS AND METHODS
STUDY DESIGN AND PARTICIPANTS
A cross-sectional study was conducted in a group of patients with ESRD. Convenience sampling was used. Patients who were seen at the outpatient replacement therapy consultation of the Instituto Nacional de Ciencias Médicas y Nutrición Salvador Zubirán (INCMNSZ) were invited to participate in the study. Those who accepted the invitation were scheduled for an appointment to undergo BIA and DEXA measurements. They were asked to fast for 4 hours, not to drink alcohol 48 hours before, and not to perform strenuous exercise on the day of the measurement. Male and female patients aged 18 to 65 years and diagnosed with ESRD who were on HD were included. Patients who did not meet the requirements of fasting, alcohol consumption, or exercise, women who were menstruating, and those with amputation of extremities, metal implants, pacemakers, or extensive tattoos were excluded.
ANTHROPOMETRIC AND CLINICAL EVALUATION
On the day of the visit, after the HD session, body weight was measured with a Tanita BC-533 scale (Tanita Corp., Tokyo, Japan) and height with a Harpenden wall stadiometer (Holtain Ltd., UK). From these, the body mass index (BMI) was calculated. Blood pressure was measured by the nurse in charge at the end of the HD session. Biochemical data were collected from the clinical record of the patient within the week after the measurement. The glomerular filtration rate (GFR) was estimated with the Chronic Kidney Disease Epidemiology Collaboration (CKD-EPI) equation. All the information, as well as the results of the BIA and DEXA studies, were collected on the data collection sheet for each participant.
DEXA
To perform the whole-body DEXA study, the research team ensured that 1 day before the appointment, the patient had not received oral contrast administration in the previous 5 days or undergone an isotopic study in the previous 2 days (13) The DEXA scan was performed after the HD session in a standardized manner as recommended by the manufacturer. The patient was placed in the supine position, centered on the table with the arms stretched to the sides of the body, the hands facing the legs without touching them, and thumbs up. The patient was asked to hold still until the examination arm finished the evaluation (13). The measurement was carried out with a Discovery QDR series machine (Hologic, Bedford, Massachusetts United States). After the scan, the results sheet was printed, which showed the values for FM (g), fat percentage (%), and FFM (g) = lean mass + bone mineral content.
EVALUATION OF BODY COMPOSITION BY CONVENTIONAL BIA AND BIVA
Conventional BIA analysis
Body composition was evaluated by BIA 10 minutes after the DEXA scan, as well as after the HD session, using four BIA analyzers: Spectroscopic BIA (BIA-BIS): Body composition monitor (Fresenius Medical Care®, Germany), which is a spectroscopic impedance analyzer (bioimpedance spectroscopy) based on 50 different frequencies ranging between 5 and 1000 kHz. Multifrequency BIA (BIA-MF): Quadscan 4000 (Bodystat LTD®, Isle of Man, UK), which performs measurements at 5, 50, 100, and 200 kHz. Single-frequency BIA (BIA-SF): Quantum IV (RJL systems®, Michigan, United States), which performs measurements at 50 kHz. Segmental multifrequency BIA (BIA-MS): InBody S10 (InBody®, Seoul, Korea), which performs measurements at 1, 5, 50, 250, 500, and 1000 kHz.
BIA measurements were performed according to the criteria established by the National Institutes of Health Technology Assessment Conference Statement (14). The electrodes were placed in pairs on the right extremities, located on the back of the hand and foot near the phalanx-metacarpal and phalanx-metatarsal joints, in the styloid process of the wrist, and between the medial and lateral malleolus of the ankle, through which the current of each BIA analyzer was introduced. For scanning by the BIA-MS analyzer, eight electrodes were placed: two on both feet and two on both hands. The measurements were performed one time with each analyzer consecutively at an interval of 2 to 3 minutes, which was only the time required to connect the electrodes of each analyzer between measurements.
Information on body components was recorded. FFM (kg and %), FM (kg and %), TBW (l and %)., intracellular water (ICW) (l and %), and extracellular water (ECW) (l and %) were estimated according to the prediction equations included with each analyzer. The BIA-SF analyzer software provided the option to choose the equation, so the formula for the Mexican-American population was chosen.
BIVA
Body composition was analyzed using the bioimpedance vector analysis method of Piccolli et al. (15,16), and different alterations in body composition were qualitatively detected. The values of the BIA components (R, Xc, and PA of each body composition analyzer at 50 kHz) were recorded to draw the BIVA graph (17) and to standardize the measurements of the analyzers by taking them at the same frequency (50 kHz). For each analyzer, the data were obtained as follows: BIA-BIS: The Fluid Management Tool (Cole-Cole section) provided by the manufacturer was used. BIA-MF: data were derived using Bodystat Phase Software provided by the manufacturer. BIA-SF: the data were recorded directly from the analyzer screen. BIA-MS: the data were obtained from the screen directly. However, in this case, given that the Xc values were recorded by segment, the values of the whole body were calculated by adding the values of the trunk and the extremities of the right side according to the manufacturer’s instructions. The R value was calculated using the formula:

Once the data for each patient were obtained with the different analyzers, the impedance vectors were plotted individually on the RXc graph after standardizing the R and Xc by height and considering the reference values (18) to identify both the state of hydration and body tissues. Subsequently, the data were plotted as a group in BIVA confidence software (19) to identify the differences between the analyzers. The individual or group vectors located within the ellipses of 50 and 75 % indicate a normal body composition, both in body tissues and hydration status, whereas those located outside the 75 % ellipses represent alterations in body composition.
HYDRATION DEFINITION
Vector displacements parallel to the major axis indicated changes in hydration. Vectors within the 50 % tolerance ellipse were considered to indicate normal hydration, whereas lengthening of vectors > 75 % percentile of the upper range of percentiles indicated dehydration. Conversely, shortening of vectors > 75 % percentile reference ellipses in the lower range indicated overhydration. Vectors positioned to the left of the major axis reflected increasing cell mass, and vectors to the right indicated decreasing cell mass. Thus, > 75 % tolerance ellipses of the upper right quadrant indicated lean patients and > 75 % tolerance ellipses of the lower quadrant indicated cachectic patients, whereas > 75 % tolerance ellipses of the upper left quadrant indicated athletic patients and > 75 % tolerance ellipses of the lower left quadrant indicated obese patients (9). The cut-off points for the hydration status was the same for the ellipses plotted by the 4 different devices.
ETHICS STATEMENTS
This study was approved by the Ethics Committee and Human Biomedical Research Committee of the INCMNSZ, with approval number 1771. All patients who participated signed informed consent forms.
STATISTICAL ANALYSIS
The general characteristics of the participants are presented in measures of central tendency and dispersion according to their distribution and type of variable. Continuous variables are presented as the mean and standard deviation or the median and interquartile range. Categorical variables are presented as frequencies and percentages. To identify the distribution of the variables, the Shapiro-Wilk normality test was used.
To determine the differences in the components of BIA (R, Xc, R/H, Xc/H, and PA) between the four analyzers, as well as differences in the body compartments (FFM, FM) given by the analyzers and DEXA, we used one-way repeated-measures analysis of variance for parametric variables and the Friedman test for nonparametric variables, followed by the Bonferroni and Dunn post hoc tests, respectively. For the MS measurements, Dunnett’s post hoc test was used. To compare the measurements by the analyzers within the RXc graph of the BIVA, Hotelling’s T2 test was applied to both the female and male graphs. To evaluate the agreement between the measurements of the BIA components (R, Xc, R/H, Xc/H, and PA) by the four analyzers, as well as the agreement between the measurements of body compartments (FFM and FM) by the BIA devices and DEXA, the intraclass correlation coefficient (ICC) was calculated, and the value for absolute agreement with its confidence intervals (95 % CI) was calculated. To interpret the ICC, the scale according to Koo and Li was used (20), where ICC < 0.5 is considered poor agreement, ICC = 0.50 to 0.75 moderate agreement, ICC = 0.75 to 0.9 good agreement, and ICC > 0.9 excellent agreement.
To analyze the concordance of the diagnoses given when plotting the average of the R/H and Xc/H of each machine on the RXc graph, the Fleiss kappa test was used (κ). The results were interpreted according to those recommended by Landis and Koch (21): κ < 0.0 was considered poor agreement, κ = 0.0 to 0.20 slight agreement, κ = 0.21 to 0.4 fair agreement, κ = 0.41 to 0.6 moderate agreement, κ = 0.61 to 0.80 substantial agreement, κ > 0.81 almost perfect agreement, and κ = 1 perfect agreement.
Bland-Altman plots were drawn to visually evaluate the agreement between the measurements made with DEXA and the different BIA analyzers, and the 95 % limits of agreement were estimated for the differences in the means between DEXA and each BIA analyzer.
In all tests, p < 0.05 was considered statistically significant. All statistical analyses were performed with IBM SPSS Statistics for Windows, Version 26.0. Armonk, NY: IBM Corp, except for the Bland-Altman plots, which were drawn with MedCalc Statistical Software, version 18.5, Ostend, Belgium. Hotelling’s T2 test was performed on the BIVA confidence spreadsheet (19).
RESULTS
CHARACTERISTICS OF THE PARTICIPANTS
A total of 32 patients were evaluated, two of whom were excluded from the analysis for having erroneous measurements by one of the BIA devices. Table I shows the general characteristics of the population enrolled.
Table I. General characteristics of the population.

SD: standard deviation; IQR: interquartile range; BMI: body mass index; SBP: systolic blood pressure; DBP: diastolic blood pressure; MAP: mean arterial pressure; eGFR: estimated glomerular filtration rate; Serum Cr: serum creatinine.
*Myocardial infarction, coronary thrombosis, ischemic heart disease, heart failure.
BIA RESULTS
The comparison of the BIA data, both raw and standardized by height, is shown in table II. Statistically significant differences were found between the data.
Table II. Comparison and intraclass correlation coefficients between raw and height-standardized electrical impedance components of the BIA-BIS, BIA-MF, BIA-SF and BIA-MS analyzers.
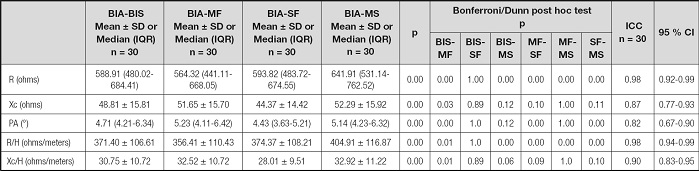
SD: standard deviation; IQR: interquartile range; BIA: bioelectrical impedance analysis; BIS: bioimpedance spectroscopy; MF: multifrequency; SF: single frequency; MS: multifrequency segmental; ICC: intraclass correlation coefficients; CI: confidence interval; R: resistance; Xc: reactance; PA: phase angle; R/H: resistance/height; Xc/H: reactance/height.
The agreement between the BIA components is shown in table II. High ICCs were observed for both raw and standardized strength by height. The ICC for PA was low, although the value obtained indicated good concordance (0.82, 95 % CI: 0.67-0.90).
IMPEDANCE VECTORS
With the data obtained from the components of the BIA by each analyzer standardized by height (R/H and Xc/H), the BIVA results were plotted by sex. When placing the male population in a group on the RXc graph, the measurements by the four analyzers were located in the lower-right quadrant, following a clear pattern of overhydration and malnutrition, which is characteristic of the HD population (Fig. 1.A). No significant differences were found when performing the pairwise comparison. Notably, however, the measurement performed by the BIA-MF analyzer indicated that part of the group evaluated by this analyzer was located in the normality ellipses, that is, in the 50th-75th percentiles of the tolerance ellipses. In the females, the measurements of the four analyzers were also located in the lower-right quadrant, but the ellipses of the women did not show an altered hydration status but rather a clear pattern of malnutrition. As in the males, no significant differences were identified in the pairwise comparisons between the analyzers, although the vector of the BIA-MS analyzer was longer, which located some of the female population evaluated in the quadrant of lean body compositions (Fig. 1B).

Figure 1. A and B. Graph of impedance vectors in men and women on HD as evaluated by the BIA-BIS, BIA-SF, BIA-MF, and BIA-MS analyzers (BIA-BIS: spectroscopic; BIA-MF: multifrequency; BIA-SF: single-frequency; BIA-MS: segmental multifrequency; Xc/h: reactance/height; R/H: resistance/height).
After plotting both men and women by groups, the concordance between the diagnoses obtained was analyzed according to the quadrant where the R/H and Xc/H measurements were located in the RXc graph of each analyzer. These are presented both by hydration status and by the state of body tissues in table III. The overall agreement and the agreement by hydration status according to the κ index indicated substantial concordance in the diagnoses by the analyzers. The concordance of the diagnoses by body tissues was moderate for the lean category but substantial for the rest of the categories, with the exception of obesity (Table III).
Table III. Concordance between the diagnoses for hydration status and body tissues according to the quadrant where the data were located in the RXc graph.

BIA: bioelectrical impedance analysis; BIS: bioimpedance spectroscopy; MF: multifrequency; SF: single frequency; MS: multifrequency segmental; κ: kappa; CI: confidence interval.
*Fleiss’s global κ index.
FAT AND FAT FREE MASS, BIA ANALYSIS, AND DEXA
After the evaluation using the impedance vectors, the FFM and FM, measurements were compared between each analyzer and DEXA. TBW, ICW and ECW measurements were also compared only between the four impedance devices. The patients who underwent scans with any of the four analyzers while having edema or dehydration were identified to exclude them from the analysis to ensure that only measurements of patients were included where the prediction equations of FFM, FM, TBW, ICW and ECW could be applied without bias, complying with the assumptions of normal hydration with which the formulas were derived.
When evaluating the body composition of the 14 normohydrated patients, statistically significant differences were found in the FFM and FM compartments between the five methods. Total body water, intracellular and extracellular data were also reported, however these results were compared only between the four impedance analyzers finding statistically significant differences between body water compartments. Table IV shows these results in both percentages, kilograms and liters. The measurements of FFM (kg) by the BIA-BIS analyzer were the lowest, while those obtained by the BIA-MF analyzer were the highest. Consequently, the values of the FM measurements by BIA-BIS were the highest and by BIA-MF the lowest. In the case of TBW measurements, a similar pattern of the FFM measurements was observed, the highest were recorded by the BIA-MF, but not for ICW and ECW, where the device with the highest measurements was the MS-BIS. In contrast, the lowest measurements were recorded by BIA-BIS device for TBW, ICW and ECW (Table IV).
Table IV. Body composition of patients evaluated with the four BIA devices and DEXA.

SD: standard deviation; IQR: interquartile range; BIA: bioelectrical impedance analysis; BIS: bioimpedance spectroscopy; MF: multifrequency; SF: single frequency; MS: multifrequency segmental; FFM: fat-free mass; FM: fat mass; TBW: total body water; ICW: intracellular water; ECW: extracellular water.
ap < 0.05 FFM and FM comparison between DEXA and the designated analyzer, Dunnett post-hoc test TBW.
bp < 0.05 TBW, ICW, ECW comparison between devices, ANOVA (mean ± SD) or Friedman test (median [IQR]).
To evaluate the agreement between the FM and FFM values estimated by DEXA and the four body composition analyzers, the absolute agreement ICC was calculated for each body compartment (Figs. 2 and 3). All the ICC scores showed a concordance between good and excellent. The BIA-MF analyzer had the lowest ICC in the FFM compartment, while the BIA-MS analyzer had the highest ICC in the FFM compartment. In the FM compartment, the lowest ICC values were also given by the BIA-MF analyzer, and the highest ICC values were given by the BIA-BIS analyzer.

Figure 2. Bland-Altman plots of FFM measurements to visually evaluate the agreement between the DEXA measurements and those of the different electrical impedance devices. The solid blue lines in the middle represent the mean bias. The dotted lines represent the upper and lower limits of agreement (± 1.96 standard deviation [SD]). The error bars in blue represent the 95 % confidence interval for the upper and lower limits of agreement (BIS: bioimpedance spectroscopy; MF: multifrequency; SF: single-frequency; MS: segmental multifrequency; FFM: fat-free mass).

Figure 3. Bland-Altman plots of the FM measurements to visually evaluate the agreement between the DEXA measurements and those of the different electrical impedance devices. The solid blue lines in the middle represent the mean bias. The dotted lines represent the upper and lower limits of agreement (± 1.96 SD). The error bars in blue represent the 95 % confidence interval for the upper and lower limits of agreement (BIS: bioimpedance spectroscopy; MF: multifrequency; SF: single-frequency; MS: segmental multifrequency; FFM: fat-free mass).
The Bland-Altman plot in figure 2 indicates the degree of agreement between measurements by each of the analyzers and by DEXA. In the case of FFM, the lowest average bias of -2.5 kg was found for the measurements performed with the BIA-BIS analyzer.
The limits of agreement were wide (95 % CI: 14.1-9.1 kg), followed (in order from lowest to highest bias) by the measurements performed with the BIA-MS (4.2 kg [95 % CI: -0.1 to 8.4 kg]), BIA-SF (5.1 kg [95 % CI: -1.1 to 11.2 kg]), and BIA-MF (7.3 kg [95 % CI: 2.7-11.9 kg]) analyzers.
The Bland-Altman plot in figure 3 indicates the degree of agreement between measurements by each of the analyzers and by DEXA for FM. A lower average bias of -2.4 kg was identified for the measurements performed with the BIA-BIS analyzer, but it had wide limits of agreement (-8.3 to 3.6 kg). The same was true for the BIA-SF analyzer, which also had wide limits, although the bias was small (-2.8 kg). Despite showing a greater average bias than the two aforementioned analyzers, BIA-MS (-4.0 kg) and BIA-MF (-5.0) showed narrower limits of agreement (-8.5 to 0.5 kg and -9.7 to -0.2 kg, respectively).
DISCUSSION
The present study shows the performance of vector diagnosis when body composition measurements are performed with different types of impedance emitted according to the technology of four body composition analyzers. In Mexico, different body composition analyzers are available on the market. In this study, those available in the area of nutrition at the Department of Nephrology of the National Institute of Medical Sciences and Nutrition Salvador Zubirán were compared. The impedance vector method was used because this tool qualitatively evaluates the state of hydration and body composition, in addition to being one of the most commonly used methods in patients with renal diseases (22-28). The present study scanned all the patients with a single-frequency device (BIA-SF), two multifrequency devices (BIA-MF, BIA-MS; one of them segmental), and a spectroscopic device (BIA-BIS). Single-frequency analyzers normally operate at 50 kHz, which allows them to calculate body resistivity and estimate TBW and FFM (8,29,30). TBW quantification with single-frequency devices is sufficiently precise, but monofrequency radiation passes only through extracellular water, not intracellular water (31,32). Multifrequency analyzers use empirical linear regression models for different frequencies, such as 1, 5, 50, 100, 200, 500, and 1000 kHz, to estimate TBW, extracellular water, and intracellular water to calculate FFM. They can precisely distinguish variations in hydration levels. At frequencies below 5 kHz and above 200 kHz, multifrequency devices have less bias and greater precision than single-frequency devices when estimating extracellular water (32). Unlike multifrequency devices, BIS devices use mathematical models and equations (Hanai equations) to adjust a polynomial curve called a Cole-Cole plot to quantify the relationships between R and the different fluid compartments for values of R from 0 to infinity and thereby derive empirical prediction equations.
In our study, the R and Xc values were taken at a frequency of 50 kHz in all the analyzers to standardize them and be able to plot them by the BIVA method (17). However, the differences in the measurements of the devices have an impact on the gross bioelectrical estimation and therefore on the analysis of the components of BIA (R, Xc, R/H, Xc/H, and PA), as reflected in our study and that of Tinsley (28). These authors compared a BIA multifrequency device (mBCA 515/514, Seca®, GmbH & Co, Hamburg, Germany) with a BIS bioelectric spectroscopy device (SFB7, ImpediMed®, Carlsbad, CA, USA) in adult women and found significant differences in R, Xc, and PA (p < 0.0001) (28).
Despite the differences between the measurement methods for R, Xc, and PA, the agreement observed between the measurements of these components was good to very good, which is in line with the findings of Bernal (29) when comparing a BIA-SF analyzer (RJL Quantum X, RJL systems®, Michigan, United States) with a BIA-MF analyzer (Bodystat Quadscan 4000, Bodystat LTD®, Isle of Man, UK) in a population with stable chronic heart failure. Similar results were found in the article by Silva, where multifrequency bioelectrical impedance spectroscopy (BIS, Xitron 4200) was compared with a single-frequency device (SF-BIA, BIA-101, RJL/Akern Systems) in two populations, active adults and elite athletes, and excellent concordance correlation coefficients and excellent concordance correlation coefficients were obtained (33). These results are consistent with the lack of significant differences in the ellipses generated with the R/H and Xc/H measurements in men or in women. However, when the diagnoses by location were analyzed in the RXc graph, the κ index showed substantial concordance for hydration status and body tissues (κ = 0.71, κ = 0.68, respectively). This result was probably influenced by the sample size and the number of categories, which increases in the classification of body composition, since more categories usually correspond to a lower κ, which is in line with the findings of Bernal (29), who calculated κ to be greater for both the states of hydration (κ = 0.91) and body tissues (κ = 0.92), although the sample included 406 patients. Although the sample number influences the concordance of the diagnosis, great care must be taken when interpreting the impedance vectors, especially in patients on HD, since an inaccurate diagnosis of hydration status can have repercussions for the treatment chosen and therefore lead to serious complications in patients.
Although DEXA has been considered the gold standard to evaluate body composition (31,32,34), this method is accurate for measuring certain body compartments, such as FM and FFM, but not TBW; thus, we could not compare measurements of this parameter by the different devices, so only the measurements are recorded in an informative way but not comparative with any gold standard.
The body compositions (FFM, FM) of the HD patients evaluated in this study differed between the analyzers, which was expected since each analyzer can have different prediction equations. When determining the ICC, the values of the four analyzers for the different body components reveal that the agreement with DEXA according to the Koo and Li scale (20) was good to excellent. In this analysis, the ICC considers any difference between measurements as discordance regardless of whether they are constant or proportional; when more sources of discrepancy exist, the ICC will be lower because the analyzers measure the same value (35,36). The highest concordance values of FFM were obtained by the BIA-MS analyzer. These data are consistent with those found by Buckinx (37), who evaluated the same BIA-MS analyzer as we did, with DEXA as the gold standard, in healthy subjects and obtained high ICCs for all the individual body segments (ICC = 0.82 (0.77-0.86) in the trunk, ICC = 0.87 (0.83-0.90) in the right arm, ICC = 0.92 (0.90-0.94) in the left arm, and ICC = 0.18 (0.49-0.30) in the left leg). Unfortunately, they did not estimate the ICC of the whole body. In the body compartment of FM, the MF analyzer obtained the lowest ICC values, and although the agreement was good, these results coincided with those found by Revindranath (38) (ICC = 0.82 [0.68-0.89]). The ICC of the BIA-BIS analyzer was the highest for FM, showing excellent concordance; however, this finding differs somewhat from the results of the Ellegård study (39). These authors obtained good agreement (0.76) using BIA-BIS equipment (Xitron Hydra 4200, Xitron Technologies, San Diego, CA, USA) in postpartum women with obesity or overweight; therefore, the discrepancies may be related to the populations studied.
The concordance found in the Bland-Altman plot between DEXA and the BIA analyzers revealed a lower bias in the measurement of FFM with the BIS equipment than with the other equipment. These results are similar to those found by Eyre (40). In a population with ESRD on peritoneal dialysis and HD, both studies found that BIA underestimated FFM, although the underestimation was greater in our study (-2.5 kg) than in Eyre’s study (-0.38 [2.76 to -3.52] kg).
As shown by our Bland-Altman plot, the analyzer with the least bias in the measurement of FM was again the BIA-BIS, with an underestimation of -2.8 kg, which is in line with Bellafronte (41), who also found an underestimation, although the value was lower, in a population in HD in both men -0.19 (-8.26 to 8.64) kg and women -0.20 (-6.58 to 6.17) kg. Importantly, despite the small difference between the BIA-BIS analyzer and DEXA in our study, the limits of agreement were wide; in contrast, the BIA-MS analyzer showed a greater bias but much narrower limits of agreement for both the FFM and FM evaluations.
The greatest limitation of the present study is the sample size. The study must be replicated in clinically healthy patients without comorbidities that can affect hydration status, since although we verified our findings in a subsample without overhydration, this subsample was very small given that it was a population with ESRD. Another recommendation is that the manufacturers of the analyzers should publish the prediction equations with which the body components are determined to analyze the variables that can cause differences in the measurements. One of the strengths of the study is that the assumptions of normohydration were met to compare FM and FFM estimates between each analyzer and DEXA, reducing the biases that can arise when using the prediction equations in patients who are dehydrated. Another strength is that this is one of the few studies to show agreement in both the vector analysis and the body components with more than two BIA analyzers.
CONCLUSIONS
The present study showed that the BIA BIS, MF, SF, and MF demonstrate substantial agreement with respect to BIVA diagnosis of hydration and body tissue status. The agreement between the components of BIA evaluated by four technologies is good. The four BIA measurement techniques showed very good agreement with DEXA, all with high ICCs. The concordance of the Bland-Altman-Altman plot showed the lowest bias for the BIA-BIS analyzer for both FFM and FM, although the limits of agreement were wide. The narrowest limits of agreement were found with the BIA-MS analyzer.

