


 Custom services
 English (pdf)
 Article in xml format
 Article references
 Send this article by e-mail
 Cited by SciELO
  Cited by Google
  Similars in
SciELO
Similars in
SciELO  Similars in Google
 Permalink
INTRODUCTION
The world faces a global challenge of Malnutrition that needs to be addressed for achieving sustainable development (1). Diet QUALITY (DQ) assessment is useful to evaluate diet in population groups at high Nutritional risk, such as the institutionalized populations that present a greater risk of Malnutrition, which is associated with an increase in morbidity and mortality risks (2,3). The assessment of DQ is usually performed by calculating the frequency of consumption of different food groups or by estimating dietary energy and nutrient intakes.
The definition and criteria for the Diet QUALITY indicators (DQIns) have been reviewed and discussed by different researchers (4,5), DQIns are commonly defined by components, where each component refers to a dimension within the indicator that contributes with a specific weight to the overall score.
Several authors have reviewed the definition of DQIns or have discussed the criteria that should be considered to evaluate this concept (4,6,7). One of the main uses of DQIns is to associate certain combinations of components with the risk of geriatric syndromes (GS) and chronic diseases (8). The application of DQIns in the elderly was reviewed by Fernandes et al. (9). In this systematic review (SR), all indicators were adaptations of the original Healthy Eating Index (HEI) developed by Kennedy et al. in 1995 (10). However, it is difficult to compare DQIns between studies because of the variation in the number and type of components and the use of different scoring systems.
In 2010, Rumbak et al. (11) applied the instrument to older people in eleven NURSING homes (NHs) in Croatia, including components in the form of nutrients, food portions, and two scores (diversity and moderation). In Spain, Norte et al., in 2011, adapted the HEI to the Spanish population, including the elderly (Indice de Alimentación Saludable) (12). Subsequently, Hernández et al. (2015) updated this index, applying it to non-institutionalized elderly (> 80 years) (13). In 2018, the Healthy Aging Diet Index was proposed to measure the adequacy of the intake of nutrients from the diet with regard to healthy aging, this index being applied in Spanish non-institutionalized elderly (14). However, despite the fact that these indicators have been developed in the elderly, they are solely applicable to estimate the individual intake of subjects.
Regarding the assessment of the DQ in institutionalized persons, without the application of DQIns, there are numerous Spanish studies on this issue. One example is the study by Rodríguez-Rejón et al. in 2017 (15). In this research, the DQ was evaluated by a validated index on the QUALITY of meals and meal service, and the menus were assessed by weighed food records. This study concluded that it is necessary to ensure the implementation of regular routines for controlling the QUALITY of meals, meal service, and Nutritional value of the menus offered in NHs.
The large number of NUTRITION care QUALITY indicators in hospitals and NHs highlights the importance of improving Nutritional care in these institutions (16). However, the great variability of these indicators shows that there is little consensus among the NUTRITION community on the best way to assess and measure NUTRITION care QUALITY. The limited methodological and conceptual validity of these DQIns makes international consensus a complicated goal.
Therefore, it is now necessary to develop alternative tools to assess DQ through a unidimensional measure. However, it is necessary to consider dietary components as an alternative to nutrients, due to the complexity that these would have in the evaluation of the menus offered in NHs. Consequently, it is desirable to develop an instrument that is extremely easy to apply by assessing components such as food groups, foods, and dietary characteristics.
To date, and to our knowledge, no specific a priori DQIn has been developed to assess dietary and Nutritional DQ in NHs. Due to the importance of a proper DQ evaluation in NHs, the development of an indicator to measure the QUALITY of the menus offered in NHs by means of DQIns is deemed necessary. Thus, the aim of the study was to propose and apply a new DQIns with a priori methodology to estimate the DQ of the menus offered, and one that can be easily applied in NHs.
MATERIAL AND METHODS
The QUALITY Index for NUTRITION in NURSING homes (QUINN) is a new tool in the study: A Novel a priori Diet QUALITY Indicator and its Application in Long-Term Care Homes. This research aims to propose and apply an instrument with the conventional concept of DQIns from epidemiological studies in order to estimate the DQ of the menus offered, in a simple way and in NHs for the elderly. The study was approved by the Drug Research Ethics Committee-Medicines (CEIm) of the Valladolid Health Area, West, Río Hortega university Hospital (Ref. CEIm: 21-PI061). All residents or their legal tutors signed an informed consent form to authorize the presence of personnel of the institution in the dining areas during mealtimes.
This indicator was implemented in a public NH located in Valladolid, Spain. The study was conducted over five weeks, by establishing mean serving sizes in each recipe or food (17,18). The sample of patients who consumed the menu comprised 137 individuals. The offered menu at this NH was elaborated and supervised by a team of kitchen staff, a gerontologist, and dietitians (approximately, 10 persons). In this NH the offered menu has been adapted to the Mediterranean diet since this dietary pattern is the Nutritional model of choice for the prevention and treatment of the most prevalent diseases in geriatrics (19-23).
FOOD CONSUMPTION ESTIMATION
The dietary study was performed by quantifying the frequency of consumption of foods offered in the menu of the NH, which was, as aforementioned, a regular menu adapted to the Mediterranean diet (24-27) (Table SI). The frequency of intake of ten food groups and 20 subgroups was classified as follows: 1- cereals, and potatoes; 2- vegetables; 3- fruits; 4- dairy; 5- legumes; 6- eggs; 7- meat (white meat, red meat, and processed meat); 8- fish (white fish, and oily fish); 9-fats and oils (olive oil, other vegetable oils and animal oils and fats); 10- sweets and sugars (cookies, pastries, juices, and added sugars).


Table SI. (cont.). Menus offered in the NURSING home during the evaluation cycle.

Fruit: orange, apple, pear, banana, kiwi. Choice between soluble cereals, decaffeinated coffee, or coffee. In the morning a glass of unsweetened commercial juice is offered as a snack, and a coffee with milk as an afternoon snack.
METHODOLOGY OF THE QUALITY INDEX FOR NUTRITION IN NURSING HOMES: QUINN
In order to assess the DQ we developed an a priori DQIn for NHs, the so-called QUALITY Index for NUTRITION in NURSING homes (QUINN). To initiate the project, the DQIns (components, and scoring systems) that had been applied in similar populations were extensively studied (9,12,13). The QUINN components was based on a rapid review (Rap Rev) (28,29) conducted on the foods more closely related to the prevention and treatment of the most prevalent chronic diseases and GS in the geriatric population (14,19,23,30). The Rev Rap is a synthesis of evidence that may provide more rapid information for decision support in comparison with conventional SR (28). The Rap Rev provides reviews with a systematic methodology that comply with the basic principles of SR, thus avoiding bias and following an exhaustive evaluation and synthesis of the studies (31-33). In reporting this Rap Rev, the criteria of the Preferred Reporting Items for Systematic Reviews and Meta-Analyses (PRISMA) statement from its 2020 update (34,35) have been applied. Due to the objectives and time-shortening nature of this Rev Rap, some items such as risk of bias assessment and searching at least two databases were not performed.
A reproducible search strategy was developed for the application in the MEDLINE database (PubMed), last reproduced on 27 December 2020. The search strategy for the identification of the studies of the components to be included in the QUINN was the following: (((((((((((((((((((((((((((((((((((((((((((Fruit[MeSH Terms]) OR (vegetables[MeSH Terms])) OR (Fruits)) OR (Vegetables)) OR (((Fruits)) OR (Vegetables)) AND (Variety)) OR (legumes)) OR (beans)) OR (fabaceae[MeSH Terms])) OR (Edible Grain[MeSH Terms])) OR (“Edible Grain”)) OR (cereals)) OR (“Whole grains”)) OR (“Whole grains”[MeSH Terms])) OR (“olive oil”[MeSH Terms])) OR (candy[MeSH Terms])) OR (Dietary Sugars[MeSH Terms])) OR (dairy products[MeSH Terms])) OR (“red meat”[MeSH Terms])) OR (poultry[MeSH Terms])) OR (seafood[MeSH Terms])) OR (eggs[MeSH Terms])) OR (“Dietary proteins”[MeSH Terms])) OR (dietary fats[MeSH Terms])) OR (“olive oil”)) OR (candy)) OR (“dietary sugars”)) OR (sweets)) OR (sweetened)) OR (pastry)) OR (“bakery products”)) OR (“sugary drinks”)) OR (biscuits)) OR (cookies)) OR (“dairy products”)) OR (milk)) OR (“red meat”)) OR (poultry)) OR (seafood)) OR (“oily fish”)) OR (eggs)) OR (“dietary proteins”)) OR (“dietary fats”))) AND ((((((((((((((((((frailty[MeSH Terms]) OR (Malnutrition[MeSH Terms])) OR (“Cognitive Dysfunction”[MeSH Terms])) OR (constipation[MeSH Terms])) OR (“Pressure ulcer”[MeSH Terms])) OR (“Deglutition Disorders”[MeSH Terms])) OR (frailty)) OR (Malnutrition)) OR (“Cognitive Dysfunction”)) OR (constipation)) OR (“Pressure ulcers”)) OR (“Deglutition Disorders”)) OR (“Cardiovascular Diseases”[MeSH Terms])) OR (“Cardiovascular Diseases”)) OR (immobility)) OR (“geriatric syndromes”)))). In addition, the following filters were applied: Clinical Trial, Comparative Study, Meta-Analysis, Observational Study, Systematic Review, Humans, Aged: 65+ years, and articles from 2010/1 - 2020/12.
A detailed description of the methodology of this indicator (QUINN index criteria, components and scoring system) and the main recommendations for its application are provided in this publication (47).
CHARACTERISTICS OF THE SUBJECTS
To evaluate the Nutritional status of the subjects (36) two tools were used, namely the Mini Nutritional Assessment, MNA (37,38), and the Controlling Nutritional Status -CONuT instrument (39). Functional capacity was evaluated using Barthel's index (40), the Lawton and Brody scale (41), and the Short Physical Performance Battery SPPB (42). The assessment of the cognitive state was performed using the Lobo Mini Cognitive Test (43,44). These scales were selected because they are some of the most studied and validated internationally for studying these topics (45). These tools were applied by a geriatrician, nurses, and dietitians during the period of time that the diet was estimated.
STATISTICAL ANALYSIS
The descriptive analyses of variables by total sample, sex, and age groups were based on median and main percentiles (quartile 1 and quartile 3), or interquartile range (IQR) for continuous variables and frequencies for categorical variables. Median differences by sex were evaluated using the Mann-Whitney u test (p-value < 0.05 was considered as statistically significant). All analyses were performed using the statistical software package version R Studio 3.5 (46).
RESULTS
PROPOSAL OF THE QUALITY INDEX FOR NUTRITION IN NURSING HOMES: QUINN
After performing the search strategy designed in PubMed, 1270 articles were initially retrieved, of which 1126 were excluded after reviewing the title; of the remaining articles, after reading the abstracts 109 were also excluded; four references were added because of expert recommendations, obtaining a total of 39 articles; after reading their full text 24 were finally selected. Further details of the screening and study selection process are detailed in this publication (47).
The QUINN considered 15 dietary components, of which 12 were basic food components: vegetables, fruits, legumes, olive oil, cereals, dairy, fish, white meat, eggs, which were classed as positive, and other foods (fats, red and processed meats, and sweets), which were classed as potentially harmful. Besides, it considered additional dietary components to assess special features of DQ: variety of vegetables and fruits, oily fish intake, and whole grains consumption. A description of the justification of the dietary components included in the proposal for the QUINN is shown in table I. The main characteristics of the studies as regards the components included in the QUINN are shown in table II.
Table I. Justification of the dietary components included in the proposal of QUINN for NHs.

CVD: cardiovascular disease; CHD: coronary heart disease; IHD: ischemic heart disease; QUINN: QUALITY Index for NUTRITION in NURSING homes; NH: NURSING home; RD: respiratory disease; T2DM: type 2 diabetes mellitus.
Table II. Main characteristics of the studies on the dietary components included in the proposal of the QUALITY Index of NUTRITION in NURSING homes (QUINN).

Table II. (cont.). Main characteristics of the studies on the dietary components included in the proposal of the QUALITY Index of NUTRITION in NURSING homes (QUINN).
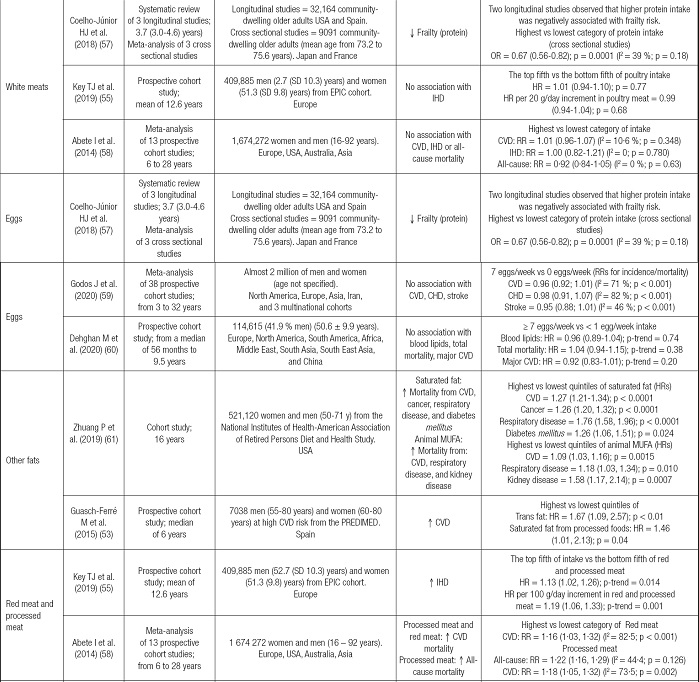
Table II. (cont.). Main characteristics of the studies on the dietary components included in the proposal of the QUALITY Index of NUTRITION in NURSING homes (QUINN).

CHD: coronary heart disease; CVD: cardiovascular disease; ENRICA: study on NUTRITION and cardiovascular risk in Spain (Estudio sobre Nutrición y RIesgo CArdiovascular en España); EPIC: European Prospective Investigation into Cancer and NUTRITION; EVOO : extra virgin olive oil; HR: hazard ratio; IHD: Ischemic heart disease; MMSE: mini-mental state examination; MuFA: monounsaturated fatty acids; OR: odds ratio; PREDIMED: PREvención con DIeta MEDiterránea; PuRE: Prospective urban and Rural Epidemiological study; RD: respiratory disease; RR: relative risk; T2DM: type 2 diabetes mellitus; uSA: united States of America..
In each of the dietary components (basic and additional), all foods included in each subgroup were described, as well as their serving size depending on the specific food or whether it was used as a main dish, side dish, or ingredient. Slight modifications have been introduced to the original QUINN (47) to adapt it to the reality of NHs. These modifications have been performed on the components of vegetables, white fish and seafood, and sweets, and portion sizes have been adjusted according to the recommendations of the Spanish Society of Community NUTRITION (SENC) for the elderly (Table SII).

Regarding the scoring method, each component was classified into four categories (scores: 0, 1, 2, and 3 points per component), using fixed cut-off levels of consumption of each component. For example in the case of vegetables component 0 points, < 0.5 servings/day; 1 point, 0,5-1 servings/day; 2 points, 1.5 servings/day, and 3 points, ≥ 2 servings/day; for the red and processed meat component it would be 0 points, ≥ 5 servings/week; 1 point, 4 servings/week; 2 points, 3 servings/week, and 3 points, ≤ 2 servings/week; finally, or the variety of vegetables and fruits every three days, 0 points, ≤ 2; 1 point, 3-4; 2 points, 5-7, and 3 points, ≥ 8.
The QUINN ranged from 0 to 45 points, the highest values of the score meaning compliance with each index component. The overall DQ categories were established as follows: very low (0-8 points), low (9-17 points), moderate (18-26 points), good (27-35 points), and very good (≥ 36 points). A detailed description of a dietary QUALITY indicator for application in NH, QUINN, is shown in table III. More details on how to apply this tool can be found in this recent publication (47).
Table III. Description of the components, criteria, and scoring system of the QUALITY Index for NUTRITION in NURSING homes (QUINN).

The overall diet QUALITY categories were established as follows: very low (0-8 points), low (9-17 points), moderate (18-26 points), good (27-35 points), and very good (≥ 36 points). Modified from Hernández-Ruiz et al., 2022 (47).
aCooked and raw vegetables.
bDoes not include juices.
cTotal consumption of cereals (whole and refined). Does not include bakery or pastry.
dDoes not include sugary dairy or sugary dairy desserts.
eIncludes all types of fats and oils except olive oil.
fIncludes cookies, pastries, sugary drinks, ice cream, and sugar.
gWhole grain bread, brown pasta, and rice..
MENU OFFERED BY THE NURSING HOME
The menu offered by this NH was found to supply a higher number of plant-based food items, such as vegetables, fruits, legumes, and relatively important amounts of extra virgin olive oil (a median of 4.3 servings). By studying the consumption frequencies of the offered menu, bread was the most consumed food within the cereals group. Dairy and eggs were the two food groups that were consumed most by the subjects. Concerning protein foods such as meat and fish, high intakes were observed. A description of the food groups and subgroups counted in each week of the centre menu is shown in table IV.
Table IV. Total servings per week of the menu offered by the NURSING home.

aMedian (Q1-Q3) consumption over the five weeks assessed.
bFoods with recommended weekly intake or limited consumption: legumes, white fish, shellfish, white meat, eggs, red meat, processed meat, pastry and bakery, added sugars, and oily fish) or divided by seven for foods with recommendations given in servings per day (vegetable, fruit, olive oil, bread, potato, pasta, rice, milk, and dairy products).
CHARACTERISTICS OF THE PARTICIPANTS
Table V shows the main characteristics of the total sample, by sex and age groups. Among the participants, n = 87 (64 %) were women, and the median age was 87 years (IQR = 12.0). Based on the BMI, significant differences were observed by sex (p-value < 0.001). According to the Barthel index, the median score was 65 points (IQR = 60.0), moderate dependence. In relation to the assessment of the risk of Malnutrition by MNA, a median score of 21.5 points (risk of Malnutrition) was obtained (IQR = 5.5). The median score of the CONuT index was 2 points, (IQR = 4.0), light Malnutrition.
Table V. Main basic characteristics of the total sample, by sex and age groups (n = 137).

Adapted and modified from Hernández-Ruiz et al., 2021 (70). RESULTS expressed as median and interquartile range (IQR). CONuT: CONtrolling Nutritional status score range (0-12 points); MEC Lobo: Lobo Mini Cognitive Test score range (0-35 points); MNA: Mini Nutritional Assessment score range (0-30 points); SPPB: Short Physical Performance Battery (0-12 points).
*(< 0.05),
†(> 0.001)..
APPLICATION OF QUALITY INDEX FOR NUTRITION IN NURSING HOMES
The mean value of the QUINN was 34 points; thus, the menu was classified as good diet, within the overall DQ categories were established as follows: very low (0-8 points), low (9-17 points), moderate (18-26 points), good (27-35 points), and very good (≥ 36 points). (Table VI). The components contributing more importantly to the total score were those items related to the Mediterranean diet (high consumption of legumes, extra virgen olive oil, white fish and shellfish, low intake of other fats, and a wide variety of fruits and vegetables), together with cereals, white meat, dairy, and eggs (23). Overall, these components met the maximum score criteria (3 points/component). The food items offered in the menu belonging to the vegetables, fruits, sweets, and oily fish groups were classified in the intermediate score categories, as these foods did not achieve the above recommendation (1-2 points/component). The components that showed a greater need for change were red meat and processed meat, and whole grains (minimum score, 0 point per component). The main RESULTS of the QUINN and its components relative to the mean intake of the subjects are shown in table VI.
Table VI. Evaluation of the components and overall score of the QUINN from the menu offered for 5 weeks.

The overall diet QUALITY categories were established as follows: very low (0-8 points), low (9-17 points), moderate (18-26 points), good (27-35 points), and very good (≥ 36 points).
aScore according mean of the menu offered by the NURSING home for 5 weeks - scores for each component (0 to 3 points).
DISCUSSION
This study proposes an easily applied instrument to determine the DQ, the so-called QUALITY Index for NUTRITION in NURSING homes — QUINN. An a priori methodology was applied for its development. Therefore, a first novel proposal has been developed that is extremely easy to apply to assess the QUALITY of the diet involving the menus offered in NURSING homes. The selection of the types of components (food groups, foods, and characteristics of the diet) has allowed the application of this instrument in a remarkably simple approach compared to other indicators previously described with nutrient components. The use of prefixed cut-off points will facilitate the comparison of health outcomes through their application in several NHs. The application of this tool in NHs allows to easily assess the DQ of the offered menu without the need to transform food intake into nutrients. Therefore, this instrument provides information on the DQ of a menu and might be useful to implement intervention strategies to improve the institutions' diet in a simple way.
Several reviews have collected the most applied indicators, especially those developed in adults and elderly with the aim of measuring the individual intake of the population (71,72). The most applied indicators in this population are HEIs, DQIs, and Mediterranean diet indexes (4,19,23). However, although this is the main objective for which these tools are usually used, we considered to propose an a priori-derived DQ tool to assess the DQ of the menus offered by NHs.
Owing to the increasing interest in studying dietary patterns, several indicators are constantly being developed. These tools have been applied and validated in several populations in recent years (73). This fact has caused an increase in the number of indicators developed, resulting in a high variability between these instruments (4). On the other hand, the evolution of scientific knowledge about different groups of foods, specific foods, and nutrients concerning the risk of developing GS (74,75), and chronic diseases makes it necessary to continuously update such tools (76). To update these tools it is important to consider issues related to the choice of components to be included and their methodology; i.e., criteria and scoring methods (4).
Concerning the application of DQIns in the elderly, it is important to remark the SR published by Fernandes et al., 2015. This SR found that the median score of the HEIs in most studies ranged between 51-80 points (maximum 100 points), indicating the need for dietary changes. In 2011 Norte et al. reported that 72 % of the Spanish population requires changes in their diet (12). In 2015 Hernández-Galiot and Cambrodón described that by HEI, 64 % of non-institutionalized Spanish adults over 80 years required modifications in their dietary pattern (13). The study by Lozano et al. showed that the Spanish elderly obtained a score similar to that obtained when assessing DQ with previously developed DQIns (6/14 points) (14). The previous RESULTS indicated that individuals had a low compliance with nutrient requirements related to healthy ageing: fiber, folate, calcium, vitamin D, monounsaturated fatty acids, omega-3 fatty acids, total proteins, and liquids; and an excessive consumption of saturated fatty acids, sodium, cholesterol, and added sugars (15). However, although these indicators have been proposed in the elderly, they only estimate the individual intake of the participants, whereas the tool that we propose measures the overall DQ of the menus offered by NH.
It should be noted that the validated Nutritional screening tools in NHs, such as the Mini Nutritional Assessment - Short Form, MNA®-SF or complete MNA® (77,78), as well as the FRAIL-NH (79,80), are recommended to be applied every three months, as they are useful as geriatric assessment instruments. It might be possible that with the simultaneous application of QUINN and MNA, every three months, the residents will benefit from a comprehensive Nutritional intervention. Therefore, in future studies, both tools (MNA and QUINN) could be used to assess the DQ of the menus offered in a much more straightforward method than the previously developed DQIns.
In the context of this study, an increased offer of whole grains, a reduction in the quantity of sweets, and a decrease in the offer of red meat and processed meat, are the main dietary components that should be considered to improve the DQ of the menus offered. It is worth noting that in previously mentioned HEIs, important dietary components for elderly patients are not considered, such as dairy (54), eggs (59,60), and foods that are a good source of low-cost protein, widely accepted by this population, also providing calcium, vitamin D, and other micronutrients. The Healthy Aging Diet Index evaluated nutrient intake related to healthy aging; nevertheless, it requires a detailed Nutritional analysis for its application. This instrument considers dietary components in the form of nutrients rather than specific food groups or food items, which could hamper their quick and easy application in NHs. In this sense, the QUINN could be a tool suitable for assessing the DQs in NH because this instrument considers groups of foods of special interest, and in turn, it is easy to apply without presenting the need to transform food consumption into nutrient intakes.
This study has main limitation is that the instrument has only been applied in one center and with a five-week menu offering. It is necessary to consider slight modifications in some of the components focusing on the season in which the instrument is applied. This is an issue that is not considered in these tools but may need to be considered in the development of future DQIns. This aspect is particularly important in the case of the development of DQIns with components in the form of subgroups or specific foods due to their specific nutrient content. The application of an instrument based on these considerations could provide useful information to institutions where seasonal foods are selected as in the present NH. The QUINN does not include beverage components (water, coffee, or infusions, unsweetened), since these are components that are not generally included in these indicators. In addition, it could be of interest to include a component to estimate the consumption of ready to cook foods in NHs where food is not cooked in the kitchens themselves and is served by external caterers.
Among the strengths of this study, the following should be noted. The main contribution of this research is the novelty of this indicator development. Among this instrument's utilities, due to its simplicity and concision, the applicability in NHs is noteworthy. Based on the proposal of the QUINN, the simple application of this tool will allow comparing the DQ between different NHs. Since fixed cut-off levels have been set for this indicator, the same amounts of the different food groups and the food items included as components in this instrument and their health benefits could be compared among several NHs.
In future research, it would be desirable to assess whether modifications of the menus to adopt higher QUINN scores result in health improvements. Future studies should also apply this indicator and explore its association with the risk of developing chronic diseases that are highly prevalent in the geriatric population.
It would be interesting to evaluate the real intake with regard to the menus offered in order to determine the real food consumption of the residents of the NHs, by applying a precise double-weighing method (15,81). Also, it would be desirable to propose an easily applicable DQIns to monitor the amounts consumed. Therefore, it would be desirable in future studies to include a component in the QUINN that will evaluate the amount of the menu that the subjects in the residences have consumed because the portions that are served are not always completely consumed or the subjects might consume double portions of some dishes, side dishes or other intakes throughout the day. Subsequently, it would be interesting to include other dietary components in the QUINN such as the calculation of the calorie density of the menu per day and the distribution of macronutrients based on the real quantities consumed.
An overly critical issue for the elderly is appropriate beverage consumption to support an adequate state of hydration, considering the consumption of water and other fluids, as well as the intrinsic water contained in food (82). In future research, it would be appropriate to develop an indicator to evaluate the QUALITY of NHs dietary liquids.
In future studies, it would be also desirable to use the QUINN to evaluate the QUALITY of other menus in centers that generally have lower Nutritional QUALITY, such as triturated diets (3,15). The inclusion of this instrument in the QUALITY criteria of NHs is fundamental because the offer of menus and the study of their adequacy are the basis to achieve an acceptable offer of foods in these institutions, with the aim of to treat and prevent the main chronic diseases and GS.
CONCLUSIONS
The menu of this NH in Spain showed a good DQ according to the QUINN. The QUINN is an easy-to-apply tool that allows to assess DQ in NHs. Furthermore, it allows to detect improvements in the menu offered by any given HN. The fifteen components of this instrument can capture the complexity of the diet through a one-dimensional measure by assessing basic and special components. This tool might be useful to evaluate the association of the DQ in NHs with health-related aspects and chronic diseases in geriatrics and GS. The DQ evaluated by this indicator will be useful to propose intervention strategies aimed at improving the diet in this setting, which in turn may lead to reduce risk factors associated with ageing-related diseases.

