


 Servicios personalizados
 Inglés (pdf)
 Articulo en XML
 Referencias del artículo
 Enviar articulo por email
 Citado por SciELO
  Citado por Google
  Similares en
SciELO
Similares en
SciELO  Similares en Google
 Permalink
INTRODUCTION
It is reported that the incidence of Malnutrition in hospitalized patients was 22.0 % (1). Malnutrition is not only closely related to disease severity, but also brings negative effects such as increased risk of infection and death to patients (2-4). In recent years, Nutritional assessment has been actively carried out in cancer, diabetes, heart failure and other diseases (5-7). These studies remind clinicians to implement necessary Nutritional interventions when treating these diseases, which will greatly improve the prognosis of patients. However, data on Nutritional status of patients with aplastic anemia (AA) are rarely reported.
When assessing the Nutritional status of patients, we cannot only focus on the low body mass index (BMI) patients. Overweight and obesity are gradually becoming a public health problem that cannot be ignored (8). Overweight and obese people are also at risk for Malnutrition. For example, Leibovitz et al. found that 23.2 % of overweight patients and 24.8 % of obese patients suffered from Malnutrition, and Malnutrition will significantly increase the length of hospital stay and the risk of death for overweight or obese patients (9). However, comprehensive assessment scales including Nutritional Risk Screening 2002 (NRS2002) and Subjective Global Nutritional Assessment (SGA) have strongly relied on low BMI or weight loss (10,11). These comprehensive assessment scales may reduce overall Malnutrition rates because they largely ignore overweight or obese patients (12).
In order to clarify the Nutritional status of aplastic anemia patients, in this study, patients were divided into low BMI group (BMI < 24 kg/m2) and high BMI group (BMI ≥ 24 kg/m2) and the combined index generated by four simple and objective Nutritional screening tools (Nutritional Risk Index [NRI], Prognostic Nutritional Index [PNI], Control Nutritional Status [CONUT] and Instant Nutritional Assessment [INA]) was used to assess the Nutritional status of the above two groups. These four Nutritional screening tools obtain the corresponding RESULTS by calculating the patient's objective laboratory data, and have been extensively verified (13-16).
MATERIALS AND METHODS
PATIENTS
This study was a retrospective study. The study population was hospitalized patients who were newly diagnosed with aplastic anemia in the Department of Hematology from January 2016 to December 2020. Our exclusion criteria were as follows: a) patients with age < 18 years; b) patients with blood transfusion records before admission; and c) patients with incomplete medical records. This study has been approved by the Ethics Committee of the Affiliated Hospital of Shandong University of Traditional Chinese Medicine. The patient's identity information was anonymized, so the patient informed consent was exempted.
DATA COLLECTION
Patients' demographic information (gender, age, height, weight) and laboratory data (white blood cell count [WBC], neutrophil count [ANC], lymphocyte count [LY], red blood cell count [RBC], hemoglobin [Hb], platelet count [PLT], reticulocyte count [RET], serum albumin [ALB], C-reactive protein [CRP] and total cholesterol [TC]) were collected. The laboratory data required for Nutritional assessment came from the same batch of blood samples collected at the time of admission. Blood routine were detected by automated hematology analyzer XN-Series (product standard number: YZP/JAP 2342-2012). The biochemical indexes were detected by Au680 automatic biochemical analyzer (instrument serial number: 2013072477).
NUTRITIONAL ASSESSMENT
All patients underwent Nutritional assessment within 48 hours after admission. We divided the patients into low BMI group and high BMI group using 24 kg/m2 as a threshold. All patients included in this study were Chinese and, in China, overweight or obesity was defined as BMI ≥ 24 kg/m2 (17). We used NRI, PNI, CONUT and INA to assess Nutritional status of patients with aplastic anemia.
NRI = [1.519 * ALB (g/l)] + 41.7 * (current / ideal weight) (18). The ideal weight of all patients was calculated by Lorentz equations: male = height − 100 − [(height − 150) / 4]; female = height − 100 − [(height − 150) / 2.5]. NRI ≥ 100 was defined as no MalNutritional risk, and 97.5 ≤ NRI < 100, 83.5 ≤ NRI < 97.5, and NRI < 83.5 were defined as mild, moderate and severe MalNutritional risk, respectively.
PNI = [10 × ALB (g/dl)] + [0.005 × LY (mm3)]. PNI ≥ 38 was defined as no MalNutritional risk, 35 ≤ PNI < 38 was defined as moderate MalNutritional risk, PNI < 35 was defined as severe MalNutritional risk, and there was no mild MalNutritional risk in the classification of PNI (19).
CONUT was developed in 2005 (20). It consists of three parts: ALB, LY and TC. CONUT 0-1 was defined as no MalNutritional risk, whereas 2-4, 5-8 and 8-12 were defined as mild, moderate and severe MalNutritional risk, respectively.
INA consisted of a classification of four degrees of Nutritional status: 1st degree: ALB ≥ 35 g/L, LY ≥ 1.5 × 10⁹ g/l; 2nd degree: ALB ≥ 35 g/l, LY < 1.5 × 10⁹ g/l; 3rd degree: ALB < 35 g/l, LY ≥ 1.5 × 10⁹ g/l; 4th degree: ALB < 35 g/l, LY < 1.5 × 10⁹ g/l (21). Either ALB < 35 g/l or LY < 1.5 × 10⁹ was considered as MalNutritional risk.
We combined the evaluation RESULTS of NRI, PNI, CONUT and INA into a combined index (22). If a patient was defined as MalNutritional risk to any degree by any three of the four screening tools, the person was diagnosed as malnourished by the combined index. The combined index was considered as our hypothetical gold standard.
STATISTICAL ANALYSIS
One-way ANOVA was used for measuring data conforming to normal distribution among the three groups. If the data did not conform to normal distribution, the rank-sum test was used, and the Chi-squared test was used for counting data. Kappa index was used to measure the consistency between different Nutritional screening tools. Sensitivity, specificity, positive predictive value, negative predictive value, positive likelihood ratio and negative likelihood ratio were used to judge the effectiveness of different Nutritional screening tools. ROC curve was used to evaluate the diagnostic value of different Nutritional screening tools. All data were expressed as mean ± standard deviation and p < 0.05 was considered as significant. All data were analyzed using SPSS26.0 software (IBM Corporation, Armonk, NY, USA).
RESULTS
STUDY POPULATION CHARACTERISTICS
The hospitalization records of 195 patients with aplastic anemia were collected, including 123 AA patients, 47 SAA patients and 25 VSAA patients. Table I describes the baseline characteristics of 195 patients. In blood routine, WBC (p < 0.001), ANC (p < 0.001), and RET (p < 0.001) decreased with the deepening of disease severity. This phenomenon was consistent with the characteristics of aplastic anemia. In the Nutritional screening tools, the NRI and PNI scores of VSAA and SAA patients were significantly lower than those of AA patients (p < 0.001), while the CONUT scores were significantly higher than those of AA patients (p < 0.001). In addition, the CRP inflammatory index of AA patients was significantly lower than that of SAA and VSAA patients (p < 0.001).
Table I. Characteristics of the study population.
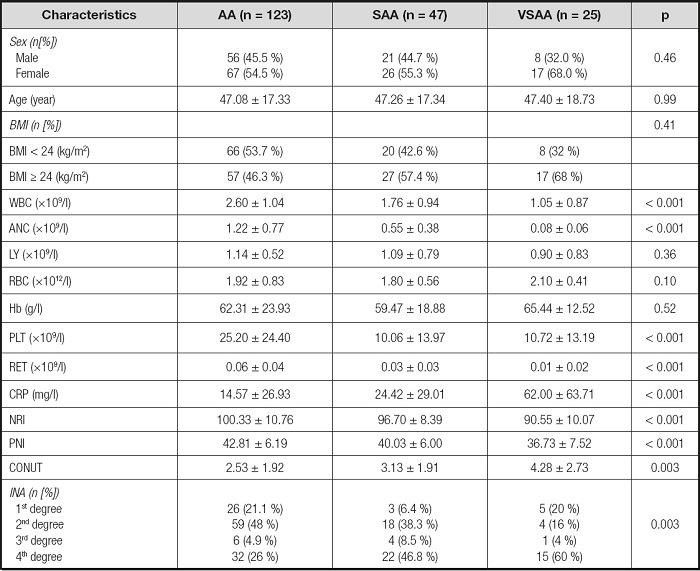
AA: aplastic anemia; SAA: severe aplastic anemia; VSAA: very severe aplastic anemia; BMI: body mass index; WBC: white blood cell count; ANC: neutrophil count; LY: lymphocyte count; RBC: red blood cell count; Hb: hemoglobin; PLT: platelet count; RET: reticulocyte count; CRP: C-reactive protein; NRI: Nutritional Risk Index; PNI: Prognostic Nutritional Index; CONUT: Control Nutritional Status; INA: Instant Nutritional Assessment.
NUTRITIONAL STATUS OF PATIENTS WITH APLASTIC ANEMIA
As shown in table II, when using NRI, PNI, CONUT and INA to assess Nutritional status, 74.5 %, 31.8 %, 75.5 % and 87.3 % of the patients in the low BMI group had any degree of Malnutrition risk, respectively; and 31.8 %, 29.4 %, 67.1 % and 76.5 % of the patients in the high BMI group had any degree of Malnutrition risk, respectively. In addition, 60.9 % of patients with low BMI were diagnosed as Malnutrition by the combined index, and 38.8 % of patients with high BMI were diagnosed as Malnutrition by the combined index. After integrating the data of the two groups, the overall prevalence of Malnutrition in patients with aplastic anemia was 51.3 %.
Table II. Distribution of Malnutrition risk identified by different Nutritional assessment scales and combined index (CX).
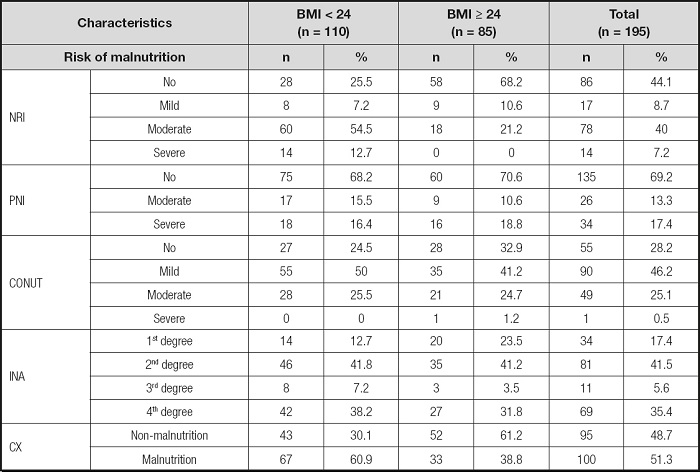
BMI: body mass index; NRI: Nutritional Risk Index; PNI: Prognostic Nutritional Index; CONUT: Control Nutritional Status; INA: Instant Nutritional Assessment; CX: combined index.
RELATIONSHIP BETWEEN NUTRITIONAL STATUS AND SEVERITY OF DISEASE
As shown in figure 1, in the high BMI group, the prevalence of Malnutrition increased significantly with the aggravation of the disease (p = 0.03) and in the low BMI group, the prevalence of Malnutrition in SAA and VSAA patients was also significantly higher than that in AA patients (p = 0.01). After integrating the data of two groups, we found that the more severe the disease, the higher the prevalence of Malnutrition (p < 0.001).
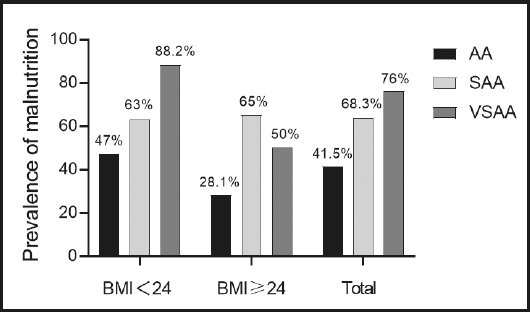
Figure 1. Prevalence of Malnutrition according to severity of the disease (AA: aplastic anemia; SAA: severe aplastic anemia; VSAA: very severe aplastic anemia).
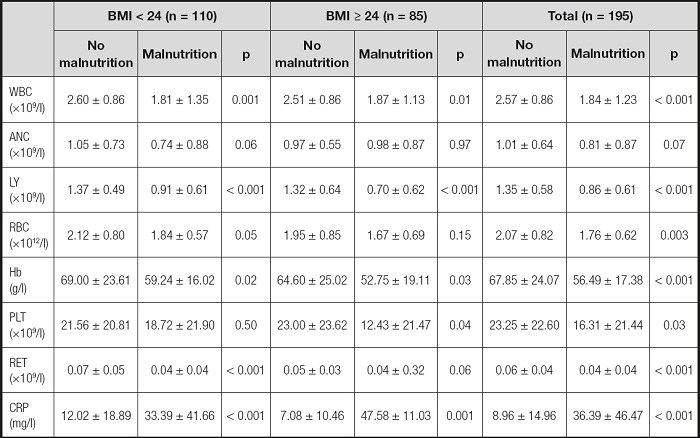
Table III showed the laboratory data grouped by Nutritional status. In the low BMI group, WBC (p = 0.001), LY (p < 0.001), Hb (p = 0.02), RET (p < 0.001), and CRP (p < 0.001) of patients with non-Malnutrition were significantly higher than in malnourished patients. In the high BMI group, WBC (p = 0.01), LY (p < 0.001), Hb (p = 0.03), PLT (p = 0.04) and CRP (p < 0.001) of patients with non-Malnutrition were significantly higher than those of patients with Malnutrition. Regardless of BMI, laboratory RESULTS of malnourished patients were worse than those of well-nourished patients.
COMPARISON OF DIFFERENT NUTRITIONAL SCREENING TOOLS AND COMBINED INDEX
As shown in table IV, in the low BMI group, the sensitivity of NRI, CONUT and INA was 100 %, and the sensitivity and negative predictive value of PNI were the lowest among the four screening tools. In the high BMI group and total, the highest sensitivity and negative predictive value were found in INA, but its specificity and positive predictive value were the lowest. PNI had the highest specificity and positive predictive value, and NRI had the highest positive likelihood ratio in all groups. Regardless of BMI, NRI had the highest consistency.
Table IV. Comparison of different Nutritional screening tools and combined index.
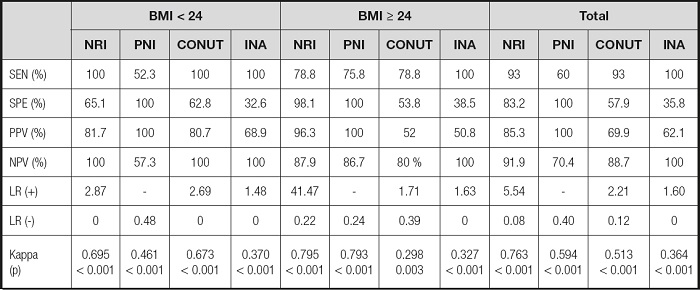
SEN: sensitivity; SPE: specificity; PPV: positive predictive value; NPV: negative predictive value; LR(+): positive likelihood ratio; LR(-): negative likelihood ratio; NRI: Nutritional Risk Index; PNI: Prognostic Nutritional Index; CONUT: Control Nutritional Status; INA: Instant Nutritional Assessment.
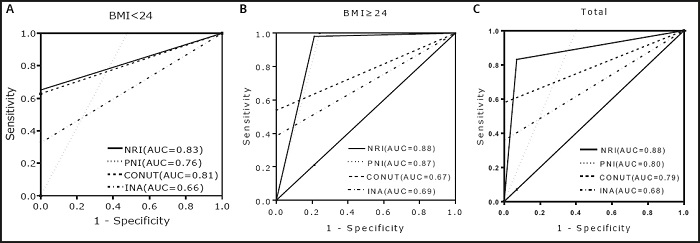
The ROC curve was used to measure the diagnostic value of different Nutritional screening tools (combined index was the standard). As shown in figure 2, NRI had the highest area under the curve in all groups.
DISCUSSION
Our study was the first to use objective Nutritional screening tools to assess Nutritional status of patients with aplastic anemia. In our study, 60.9 % of low BMI patients and 38.8 % of high BMI patients were diagnosed as Malnutrition by the combined index. Previous researchers compared the differences of Nutritional indicators such as serum albumin between AA and SAA patients (23). Combined with previous research, our study enriched the Nutritional data of patients with aplastic anemia.
The ESPEN guidelines were considered as the gold standard for Malnutrition and were often compared with other Nutritional assessment scales when assessing Nutritional status in hospitalized patients (24,25). ESPEN defined Malnutrition as follows: a) BMI < 18.5 kg/m2; b) weight loss > 10 % due to non-human factors regardless of time, or weight loss > 5 % within three months and at least one of the following: BMI < 20 kg/m2 (age < 70) or BMI < 22 kg/m2 (age > 70) and fat free mass index (FFMI) < 15 kg/m2 (female) or FFMI < 17 kg/m2 (male) (26).
We can clearly see that ESPEN guidelines have also strongly relied on low BMI or weight loss. Since our study included overweight or obese patients, using ESPEN guidelines to diagnose Nutritional status in patients with aplastic anemia may reduce the overall prevalence of Malnutrition. Therefore, patients were divided into two groups according to BMI and the method of Pablo et al. was used, taking the combined index as the presumed gold standard. This method has been widely verified (27-29).
We tend to pay more attention to the Nutritional status of the emaciated population, and it is challenging to recognize that overweight or obese people suffer from Malnutrition. On the one hand, there is a lack of a Nutritional evaluation scale specially designed for obese or overweight people, while it is difficult to identify muscle wasting in overweight or obese people with standard Nutritional physical examination (30). On the other hand, this idea will overturn the normal understanding (obesity or overweight belongs to over-NUTRITION). At present, no epidemiological study on obesity or overweight in patients with aplastic anemia has been found, but with the rising obesity rate of hospitalized patients (31), the problem of Malnutrition in overweight or obese patients with aplastic anemia should not be ignored. In our study, 85 (43.5 %) patients were diagnosed as overweight or obese (the mean BMI of 85 patients was 26.59 [95 % CI: 26.12, 17.06]), of which 33 (38.8 %) suffered from Malnutrition (diagnosed by the combined index).
In our study, after integrating the data of the two groups, the overall prevalence of Malnutrition calculated by the combined index was 51.3 %. The prevalence of Malnutrition varies from disease to disease. For example, the Malnutrition rate can reach about 39 % in hepatitis B-related cirrhosis (32), while it is only 17 % in chronic obstructive pulmonary disease (33). Although there were great differences in the RESULTS of different Nutritional screening tools, the Nutritional status of patients with aplastic anemia was still not optimistic. Our study showed that the severity of the disease was related to the Nutritional status of patients. The Malnutrition rate of SAA and VSAA patients was significantly higher than that of AA patients, which means that the more serious the disease, the worse the Nutritional status of patients. In addition, the high level of inflammation in patients with aplastic anemia may be a potential factor leading to poor Nutritional status, as Sieske et al. found that inflammation would aggravate the MalNutritional risk of patients (34). In this study, we found that the CRP inflammatory index of well-nourished patients was significantly lower than that of malnourished patients in the two groups (low BMI and high BMI).
In order to find the best Nutritional screening tool for patients with aplastic anemia, the consistency between different screening tools and combined index was compared. In the low BMI group, CONUT and INA had the highest sensitivity, but their specificity and positive predictive value were significantly lower than those of NRI and PNI, which means that CONUT and INA overestimated the number of Malnutrition, resulting in a high misdiagnosis rate. Although PNI had the highest specificity and positive predictive value, its sensitivity and negative predictive value were the lowest among the four screening tools, suggesting that PNI underestimated the number of Malnutrition and led to a higher rate of missed diagnosis. In the high BMI group, although CONUT had the same sensitivity as NRI, its specificity and positive predictive value were significantly lower than those of NRI, suggesting that CONUT exaggerated the prevalence of Malnutrition. In addition, when assessing the Nutritional status of overweight or obese patients with aplastic anemia, PNI can be used as an alternative tool for NRI, because the kappa value of PNI was similar to NRI. Regardless of BMI, NRI is the best tool to assess the Nutritional status of patients with aplastic anemia, because the highest consistency and area under curve was found in NRI. In our opinion, this fact was related to the NRI calculation method. The calculation formula of NRI includes Nutritional indicators and body weight. Compared with the other three screening tools, it seems more comprehensive.
Although we emphasized that the accuracy of the traditional comprehensive scale and ESPEN guidelines will be affected when evaluating overweight or obese people, we did not use the combined index to compare and verify. This is the defect of our study, and we will further study it in the future work. The fact of using the combined index generated by four Nutritional screening tools to assess Nutritional status of patients with aplastic anemia also brings some problems, because the parameters required for Nutritional evaluation will be affected by the disease itself. For example, the destruction of the immune system in patients with aplastic anemia will not only lead to lymphopenia (35), but also increase the risk of infection. Albumin, as an acute phase reactive protein, will decline during infection (36). Due to the lack of previous work, we were unable to obtain follow-up data of patients. We only analyzed the relationship between Nutritional status and disease severity, and whether Nutritional status could significantly affect the clinical outcome of patients remained unknown, therefore, further research is needed to clarify these problems in the future. In addition, the sample size of this study is small, and the data may be biased. For example, in the low BMI group, the small sample size of VSAA patients may lead to falsely high Malnutrition rates in patients with VSAA.
CONCLUSIONS
Our data showed that the Malnutrition rate of patients with aplastic anemia was 51.3 % and more than 30 % of obese or overweight patients suffered from Malnutrition. Therefore, the Nutritional status of overweight or obese patients should not be ignored. The Nutritional status of patients with aplastic anemia was related to the severity of the disease. NRI is the best tool for assessing the Nutritional status of patients with aplastic anemia.

