


 Serviços customizados
 Inglês (pdf)
 Artigo em XML
 Referências do artigo
 Enviar este artigo por email
 Citado por SciELO
  Citado por Google
  Similares em
SciELO
Similares em
SciELO  Similares em Google
 Permalink
INTRODUCTION
Obesity is a worldwide health problem of epidemic proportions that is related to diabetes mellitus type 2, hypertension, dyslipidemia, myocardial infarction, stroke, and cancer (1). Insulin resistance is also related to this whole set of complications associated with obesity. Moreover, some studies have reported that saturated fat worsens, whereas polyunsaturated and monounsaturated fats improve, insulin resistance (2).
In this context, adiponectin as expressed in adipose tissue is an important insulin sensitizer that regulates glucose metabolism and energy homeostasis (3,4). Adiponectin levels are decreased in obese patients (5), and hypoadiponectinemia is related to insulin resistance, diabetes mellitus type 2, and metabolic syndrome (6,7). Adiponectin is the most abundant adipokine, and is involved in the following functions: it enhances energy consumption and fatty acid oxidation, improves overall insulin sensitivity, and also has anti-inflammatory and anti-oxidant properties, as well as cardiovascular protective actions (8,9). Circulating concentrations have a strong genetic component, with heritability estimated at over 40 % (10). This adipokine is encoded by the ADIPOQ gene, which is located on chromosome 3 at q27 and has three exons (11). Interestingly, obese subjects show varying responses to dietary interventions, which suggests that a significant gene-dietary interaction occurs (12). Only a scarce number of all known ADIPOQ genetic variants have been evaluated regarding their effects in relation with biochemical changes after hypocaloric dietary interventions. One common genetic variant of the ADIPOQ gene is rs822393 (-4522C/T), which is located in the proximal promoter region. The single nucleotide polymorphism (SNP) rs822393 modulates adiponectin promoter activity and produces decreased circulating levels of adiponectin and worse insulin action (13,14). A short-term interventional study with a Mediterranean hypocaloric diet (15) showed increases adiponectin levels, adiponectin/leptin ratio, and HDL-cholesterol in non-T-allele carriers. This diet had a moderate caloric restriction of 500 calories for 3 months with a contribution of monounsaturated fats that accounted for 50 % of the caloric contribution from total fat amount. Finally, some SNPs of the ADIPOQ gene have been demonstrated to interact with dietary intake of fat, and this interaction modifies adiponectin levels (16).
The aim of our study was to analyze the metabolic effects of two hypocaloric diet with different dietary fat profiles during 3 months according to the genetic variant rs822393 of ADIPOQ.
SUBJECTS AND METHODS
SUBJECTS AND CLINICAL INVESTIGATION
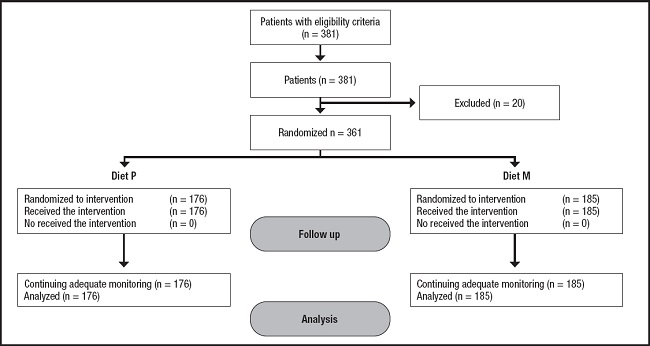
We performed a randomized interventional study. The Local Institutional Ethics Committee (HCUVA Committee PI9/2017) approved the study protocol, and a written informed consent was obtained from participants, including genetic analyses. A continuous consecutive methodology was used to recruit 381 Caucasian obese patients taken care of at a tertiary Hospital in an urban area of Spain. Eligibility criteria were the following: obese patients with body mass index (BMI) ≥ 30 kg/m2 and an age over 20 years. On the other hand, exclusion criteria included: evidence of previous cardiovascular or cerebrovascular disease, severe renal or hepatic disorders, active alcohol consumption (> 20 g/day), uncontrolled hypothyroidism, diabetes mellitus, receiving drugs known to influence lipid levels (fibrates, statins, hormonal therapy, glucocorticoids and anti-inflammatory drugs) or glucose levels (sulfonylureas, thiazolidinedione, insulin, glucagon-like peptide (GLP-1) receptor antagonists, S-GLT2 (type-2 sodium-glucose cotransporter), DPP-IV (dipeptidyl peptidase-4) inhibitors, metformin). Figure 1 shows a flow chart with the 381 recruited patients and 20 excluded patients; a total of 361 patients finished the study.
The parameters of the sample were registered at the beginning and after 3 months of dietary intervention. Adiposity parameters (weight, body mass index (BMI), total fat mass, and waist circumference) were recorded. Blood samples for analysis were drawn after a minimum of 10-h overnight fast, and serum was stored at -80 °C until analyzed. The next biochemical parameters were measured: total cholesterol, LDL-cholesterol, HDL-cholesterol, triglycerides, C-reactive protein (CRP), fasting glucose, insulin, leptin, total adiponectin, and resistin. The following parameters were calculated: LDL-cholesterol, insulin resistance as homeostasis model assessment (HOMA-IR), and adiponectin/leptin ratio.
DIETARY INTERVENTION
All obese patients in this interventional study received individualized counseling on diet and exercise. As above-mentioned, patients were randomly allocated to one of two diets for a period of 12 weeks - Diet P (enriched in polyunsaturated fatty acids) and Diet M (enriched in monounsaturated fatty acids), and subtracting 500 daily calories from usual intake. The target percentage of energy derived from carbohydrate, fat and protein in the two diets were: Diet P (45.7 % of carbohydrates, 34.4 % of lipids and 19.9 % of proteins); Diet M (46.6 % of carbohydrates, 34.1 % of lipids and 19.2 % of proteins). The recommended distribution of dietary fats in Diet P was: 21.8 % of saturated fats, 55.5 % of monounsaturated fats and 22.7 % of polyunsaturated fats (7 g per day of w-6 fatty acids, 2 g per day of w-3 fatty acids, and a w6/w3 ratio of 3.5). The recommended distribution of fats in Diet M was: 21.7 % of saturated fats, 67.5 % of monounsaturated fats and 10.8 % of polyunsaturated fats. The recommended physical activity consisted of aerobic exercise at least three times per week (60 min each) such as running, walking, cycling or swimming. All recruited patients received instructions to record their daily dietary intake for five non-consecutive days. A dietitian assessed adherence to the diet every fourteen days with a phone call. Dietary records were analysed using a specific software (Dietosource®, Genève, Switzerland), including national food composition tables as reference (17). Physical activity was recorded by each subject with a self-reported questionnaire.
GENOTYPING ADIPOQ GENE
Buffy coats removed from blood samples were stored in EDTA-coated tubes at -80 °C. Genomic DNA was extracted from 200 µL buffy coat using a standard salting out method by QIAamp® DNA blood kit. Oligonucleotide primers and probes were designed with the Beacon Designer 5.0 (Premier Biosoft International®, LA, CA, USA). A 60 µL PCR reaction mixture containing 2 µL of genomic DNA, 10 µL of 10 x buffer reaction (My Taq™ DNA polymerase, BIOLINE), 1.5 µL each of forward and reverse primers, 0.5 µL of My Taq DNA polymerase (My Taq™ DNA polymerase, BIOLINE) and 44.5 µL of water were used in the reaction. PCR reaction was carried out using primer forward: 5'- ACGTTGGATGAAAGCATGACACGGAGCTTC -3' and reverse 5'- ACGTTGGATGAACCCTCACCCATGTCAGC -3' in a 2 µL final volume (Termociclador Life Technologies, LA, CA, USA). DNA was denatured at 90 °C for 3 min and subsequently by 50 cycles of denaturation at 90 °C for 30 secs, and annealing at 56.1 °C for 60 secs. We used as internal standard for RT-PCR (GAPDH) with a forward sequence: GTCTCCTCTGACTTCAA and reverse sequence: ACCACCCTGTTGCTGTA. If both strands grew in a patient sample, this patient was classified as heterozygous. If only one strand grew in a patient sample, this patient was classified as homozygous. The thermal cycler software classifies each patient as homozygous wild type (CC), heterozygous (CT), and homozygous mutant (TT). Moreover, a negative control and control samples representing all genotypes were included in each reaction. Hardy Weinberg equilibrium was determined with a statistical test (Chi-squared). The variant of AIPOQN gene was in Hardy Weinberg equilibrium (p = 0.53).
BIOCHEMICAL DETERMINATIONS
Total cholesterol, HDL-cholesterol, triglycerides, C-reactive protein (CRP), fasting glucose and insulin were measured using an automated analyzer COBAS INTEGRA 400® (Roche Diagnostic, Montreal, Canada). LDL-cholesterol was determined using Friedewald's formula (LDL cholesterol = total cholesterol - HDL cholesterol - triglycerides / 5) (18). The homeostasis model assessment (HOMA-IR) was used to determine insulin resistance (glucose x insulin / 22.5) (19).
All adipokines were measured by enzyme immunoassay (ELISA); serum adiponectin levels (R&D systems, Inc., Minnesota, USA) with a normal range of 8.65-21.43 µg/ml (20), resistin levels (Biovendor Laboratory, Inc., Brno, Czech Republic) with a normal range of 4-12 ng/ml (21), and leptin levels (Diagnostic Systems Laboratories, Inc., Texas, USA) with a normal range of 10-100 ng/ml (22). The adiponectin/leptin ratio was calculated as a direct ratio between both values. Finally, CRP levels were determined by immunoturbimetry (Roche Diagnostics GmbH, Mannheim, Germany), with a normal range of (0-7 mg/dl).
ADIPOSITY PARAMETERS
In order to express body mass index (BMI), height and weight were measured with a stadiometer (Omrom, LA, CA, USA) and an electrical scale (Omrom, LA, CA, USA), respectively. BMI was calculated as body weight (kg) divided by height squared (m2). Waist circumference (WC) was determined with a flexible non-stretchable measuring tape (Omrom, LA, CA, USA) from the midpoint between the lateral iliac crest and the lowest rib to the nearest 0.5 cm. Impedanciometry was used to calculate total fat mass with an accuracy of 5 g (22) (EFG, Akern, It). Blood pressure was measured twice at 10-minute intervals using a digital sphygmomanometer (Omrom, LA, CA, USA).
STATISTICAL ANALYSIS
Sample size was determined to detect differences over 10 ng/dl of adiponectin after dietary intervention with 90 % power and 5 % significance. The sample size necessary was 175 obese patients in each diet group.
All analyses were performed under a dominant genetic model with rs822393 T- allele as the risk allele (CC vs. CT+ TT). The Kolmogorov-Smirnov test was used to analyze variable distribution. A descriptive analysis of the data (mean, standard deviation, frequency of genotypes) and subsequently an inferential analysis (χ2 test, Student's t-test, and non-parametric test) were carried out. A Bonferroni test was applied for multiple testing to reduce type-I error in association analysis. The statistical analysis to evaluate the interaction between the gene and each dietary intervention was performed using ANCOVA (covariance analysis) adjusted by age, sex, and BMI modeling the dependent variable with the starting values. IBM SPSS version 23.0 software package (SPSS Inc. Chicago, IL) was used to make the statistical analyses. Significance was assumed for p < 0.05.
RESULTS
Three hundred and sixty-one Caucasian obese patients were recruited in the study with the following genotypes (221 CC [61.2 %], 115 CT [31.9 %] and 25 TT [6.9 %]). Allelic frequency was C (0.77) and T (0.23). The mean age of the whole group was 51.1 ± 7.0 years (range: 27-61) and mean BMI was 36.9 ± 2.3 kg/m2 (range: 31.5-38.3). Sex distribution was 259 females (71.7 %) and 102 males (28.3 %). Age was similar in both genotype groups (wild type [CC] vs. mutant type [CT+TT]) (51.9 ± 6.1 years vs 50.3 ± 6.1 years: ns). Sex distribution was similar in both genotype groups, males (27.3 % vs 29.2 %) and females (72.7 % vs 70.8 %).
All patients completed the 3-months follow-up period with both dietary interventions without dropouts (Fig. 1). Below we describe the dietary intakes of the 176 obese patients (104 CC as wild genotype and 59 CT/13 TT as mutant genotype [CT+TT]) treated with diet P. In these patients, the basal evaluation of dietary intakes showed an energy of 2016.3 ± 318.8 kcal/day with the following macronutrient distribution: carbohydrate intake was 44.5 % of total calories (216.9 ± 51.1 g/day), fat intake was 35.3 % of total calories (79.1 ± 11.1 g/day) and protein intake was 20.1 % of calories 82.1 ± 13.1 g/day. During the 3 months of dietary intervention, these subjects followed the dietary recommendations of arm P: 1409.9 ± 115.8 calories per day (45.3 % of carbohydrates, 34.2 % of lipids and 20.5 % of proteins). The percentages of dietary fats were: 20.2 % of saturated fats, 54.0 % of monounsaturated fats and 23.8 % of polyunsaturated fats (6.9 g per day of w-6 fatty acids, 1.8 g per day of w-3 fatty acids, and a w6/w3 ratio of 3.6). No differences were detected in physical activity between both genotype groups (164.1 ± 22.3 min/week vs 175.3 ± 30.9 min/week: p = 0.39).
In the 185 subjects (117 CC as wild genotype and 56 CT/12 TT as mutant genotype [CT+TT]) treated with diet M, basal energy intake was 2013.2 ± 292.9 kcal/day. The distributions of macronutrients in these subjects were: carbohydrate intake of 215.1 ± 29.1 g/day (44.0 % of calories), fat intake of 79.1 ± 14.3 g/day (34.6 % of calories) and protein intake of 86.2 ± 12.1 g/day (22.4 % of calories). During treatment, these patients reached the target recommendations of Diet M: 1401.1 ± 102.3 calories per day (45.2 % of carbohydrates, 34.1 % of lipids and 20.7 % of proteins). The distribution of dietary fats was: 20.2 % of saturated fats, 68.3 % of monounsaturated fats and 11.5 % of polyunsaturated fats. Physical activity was similar in both genotype groups (175.1 ± 19.3 min/week vs 182.3 ± 23.1 min/week: p = 0.48).
ADIPOSITY PARAMETERS AND BLOOD PRESSURE
As showed in table I, there were no statistically significant differences in adiposity parameters and blood pressure levels either in the baseline values or in the values after the nutritional intervention. After both hypocaloric diets with two different profile of dietary fatty acids, body weight, body mass index (BMI), fat mass, waist circumference and systolic blood pressure decreased.
Table I. Adiposity parameters and blood pressure at basal time and after both dietary interventions (mean ± SD).

BMI: body mass index; DBP: diastolic blood pressure; SBP: systolic blood pressure; WC: waist circumference. Statistical differences in each genotype group:
*o statistical differences between genotype groups.
After the intervention with Diet P, patients of both genotypes (CC vs. CT+TT) responded with a similar improvement in body weight (-4.7 ± 1.1 kg vs. -4.6 ± 1.0 kg: p = 0.41), BMI (-1.6 ± 0.2 kg/m2 vs. -1.4 ± 0.5 kg/m2: p = 0.33), fat mass (-3.4 ± 0.9 kg vs. -3.3 ± 0.8 kg: p = 0.31), waist circumference (-3.4 ± 0.9 cm vs. -3.1 ± 0.6 cm: p = 0.52) and systolic blood pressure (-13.0 ± 3.9 mmHg vs. -12.1 ± 2.9 mmHg: p = 0.40). After hypocaloric Diet M, both genotype groups (CC vs. CT+TT) had also similar improvements in body weight (-4.7 ± 1.2 kg vs. -4.8 ± 1.1 kg: p = 0.43), BMI (-1.6 ± 0.1 kg/m2 vs. -1.3 ± 0.2 kg/m2: p = 0.39), fat mass (-3.8 ± 1.0 kg vs. -3.7 ± 0.7 kg: p = 0.41), waist circumference (-4.0 ± 1.1 cm vs. -3.9 ± 0.9 cm: p = 0.41) and systolic blood pressure (-11.1 ± 3.0 mmHg vs. -10.8 ± 2.7 mmHg: p = 0.34), too. These improvements previously mentioned were similar with both hypocaloric diets.
BIOCHEMICAL ASSAYS
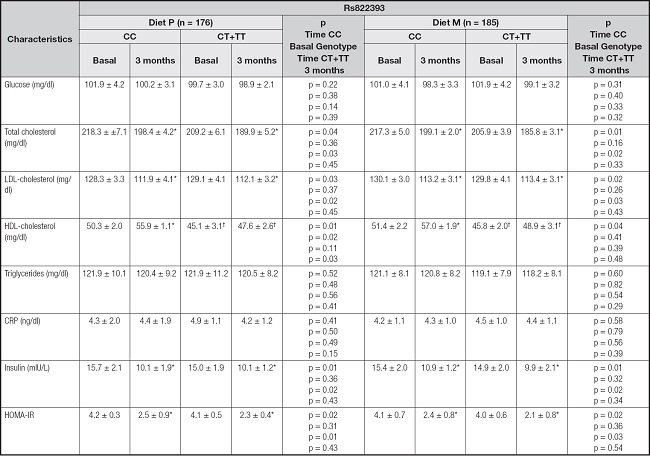
For the variant rs822393 of the ADIPOQ gene there were no differences in basal biochemical parameters with a dominant model (CC vs CT+TT) (Table II), only the basal and posttreatment levels of HDL were lower in the T-allele carriers. Insulin, HOMA-IR, total cholesterol and LDL cholesterol significantly decreased in both genotype groups.
Table II. Biochemical parameters at basal time and after both dietary interventions (mean ± SD).
CRP: C-reactive protein; HOMA-IR: homeostasis model assessment. Statistical differences in each genotype group:
*Statistical differences between genotype groups: †.
After dietary intervention with a polyunsaturated enriched hypocaloric diet (Diet P), subjects in both genotype groups showed a significant improvement in total cholesterol levels (CC vs CT+TT) (-20.1 ± 4.1 mg/dL vs. -20.2 ± 4.4 mg/dl: p = 0.71), LDL-cholesterol (-17.6 ± 3.1 mg/dl vs. -17.0 ± 2.9 mg/dL: p = 0.43), insulin levels (-5.4 ± 1.0 mU/L vs. -5.0 ± 0.4 mU/L: p = 0.28) and HOMA-IR (-1.7 ± 0.3 units vs. -1.4 ± 0.4 units: p = 0.23). A similar improvement in the same parameters and in the same magnitude was observed after the monounsaturated enriched hypocaloric diet (Diet M); total cholesterol levels (CC vs CT+TT) (-18.2 ± 5.2 mg/dL vs. -20.1 ± 4.4 mg/dl: p = 0.32), LDL-cholesterol (-16.9 ± 4.2 mg/dl vs. -16.3 ± 3.8 mg/dL: p = 0.41), insulin levels (-4.5 ± 1.1 mU/L vs. -4.6 ± 1.6 mU/L: p = 0.32) and HOMA-IR (-1.7 ± 0.1 units vs. -1.4 ± 0.2 units: p = 0.39). The magnitude of improvement of all these previously mentioned parameters was similar with both hypocaloric diets.
Moreover, HDL-cholesterol (CC vs CT+TT) (delta: 5.6 ± 1.1 mg/dl vs. 2.7 ± 0.9 mg/dl; p = 0.01) improved only in non-T-allele carriers after Diet P. The same results were observed after Diet M (delta: 5.5 ± 0.8 mg/dl vs. 3.1 ± 0.9 mg/dl; p = 0.03).
ADIPOKINES
Table III reports changes of serum adipokines and adiponectin/leptin ratio. Leptin levels were significantly improved after both dietary interventions and in both genotype groups. In both dietary intervention groups, basal and post-intervention adiponectin levels and adiponectin/leptin ratios were lower in T-allele carriers than in non-T-allele carriers.
Table III. Adipokines and cytokine levels (mean ± SD).

Statistical differences (p < 0.05) in each genotype group:
*Statistical differences between genotype groups: †.
After diet P and in non-T-allele carriers (CC vs. CT+TT), serum adiponectin (20.1 ± 2.9 ng/dl vs. 6.8 ± 3.0 ng/dl; p = 0.02) and adiponectin/leptin ratio (0.57 ± 0.1 units vs. 0.20 ± 0.08 units; p = 0.03) increased in a significate way. Similar results were observed after the intervention with Diet M. In non-T-allele carriers (CC vs. CT+TT), serum adiponectin (19.5 ± 2.9 ng/dl vs. 4.5 ± 2.8 ng/dl; p = 0.01) and adiponectin/leptin ratio (0.54 ± 0.1 units vs. 0.15 ± 0.08 units; p = 0.03) increased in a significant way.
DISCUSSION
In this interventional study of Caucasian obese subjects, we have shown a significant association between the rs822393 polymorphism of the ADIPOQ gene and metabolic response after two different hypocaloric diets, one enriched with monounsaturated fatty acids and the other enriched with polyunsaturated fatty acids. In these obese Caucasian subjects' study we reported a significant increase in HDL-cholesterol, adiponectin levels and adiponectin/leptin ratio in non-T-allele carriers, regardless of the type of diet. Finally, T-allele carriers showed lower levels of HDL-cholesterol, adiponectin and adiponectin/leptin ratio than non-T-allele carriers.
The rs822393 variant of the ADIPOQ gene has a scarce number of published studies with contradictory results. One of them is the Healthy Lifestyle in Europe by Nutrition in Adolescents Study (14). This cohort study of young people demonstrates a relationship between this genetic variant and HDL-cholesterol, as the results of our study of adult people. Surprisingly, these relationships with the lipid profile have not been found in other research studies (24). However, this rs822393 has been related in some studies with cardiovascular risk, hence its possible role in modifying the lipid profile (25). Probably the different ethnicities of the patients evaluated in the investigations can explain some of the differences found in the studies. For example, Rayma et al. had reported the same low HDL cholesterol levels in the T-allele carriers found by us in our sample of Caucasian obese patients, but in their case in obese Indian patients (26). The second metabolic finding in our study is low levels of adiponectin in T-allele carriers, too. This association has been previously reported in the CARDIA study (Coronary artery development in young adults) (27). These low levels of adiponectin could be explained by the fact that rs822393 is an intronic variant with the capacity to modify the alternative-splicing pattern (28). These two metabolic findings (low HDL-cholesterol and low adiponectin levels) are probably closely related, because adiponectin is capable of modulating the levels of HDL-cholesterol with activation of lipoprotein lipase and ATP-binding cassette transporter A1, and secondly with an increase in the hepatic production of ApoA1 (29-31).
A previous study of 3 months with a caloric intake of 1500 ca- lories/day and a Mediterranean diet profile with 50 % of all fats in the form of monounsaturated fats, also demonstrated a significant improvement in adiponectin levels, adiponectin/leptin ratio and HDL-cholesterol (32). In a second intervention study, the same metabolic results were observed (33). In this case, the diet was 1000 calories a day and the intervention lasted 9 months, with a higher percentage of monounsaturated fats, reaching 60 % of the total fat provided. Some studies have demonstrated higher levels of adiponectin after diets enriched in unsaturated fat than in diets enriched in protein or carbohydrates (34). In one study, mean adiponectin levels showed a significant increase after supplementation with omega-3 fatty acids for 3 months (35). In a rat model, a lower proportion of dietary saturated/monounsaturated/polyunsaturated fatty acids modified the expression of adiponectin with a high-fat diet (36). Even in non-obese individuals, a differential response for postprandial adiponectin has been demonstrated as a function of the amount of sugar and fat in a typical meal (37). Finally, in the GOLDN study, a significant association was reported between a genetic variant of the ADIPOQ gene and obesity and metabolic-related traits with dietary modifications (38).
The strength of our study was in its design a randomized, controlled, feeding trial with high retention and adherence and diets with a practical relevance to the population. Limitations included a small sample size, and small changes in HDL cholesterol and adiponectin levels. Second limitation is that we only determined one SNP of ADIPOQ, other SNPs could be related to our findings. Third, the associations between ADIPOQ variant and metabolic changes could be modified by other gene-environmental interactions, that we have not been able to consider in our design. Fourth, the findings are in metabolic alterations and not in cardiovascular events, but the existence of a relationship with the adiponectin/leptin ratio is promising. For example, an adiponectin/leptin ratio below or near to 0.5 may indicate an increase in metabolic risk (39,40), as shown by carriers of the T-allele before and after dietary intervention. Finally, the self-reported dietary intake is not reliable and it might include bias of under- or over-reporting.
In conclusion, after two different hypocaloric diets, enriched in polyunsaturated fatty acids and monounsaturated fatty acids, obese subjects with the T-allele of rs822393 did not improve adiponectin levels, adiponectin/leptin ratio, and HDL-cholesterol, despite the loss of weight. Therefore, the genotyping of patients with this rs822393 variant before starting a hypocaloric diet enriched in fat is interesting to predict their metabolic response, which is more important than the fat profile of the diet.

